
Key risk events today:
US CB Consumer Confidence; (CAD) Gov. Council Member Schembri Speaks.
(Previous analysis as well as outside sources – italics).
EUR/USD:
The start of the final full week of August had the DXY finish Monday noticeably off worst levels, with the EUR/USD daily picture printing a similar landscape, only off best levels.
Technical structure on the weekly timeframe remains unchanged – here’s a reminder of Monday’s technical briefing:
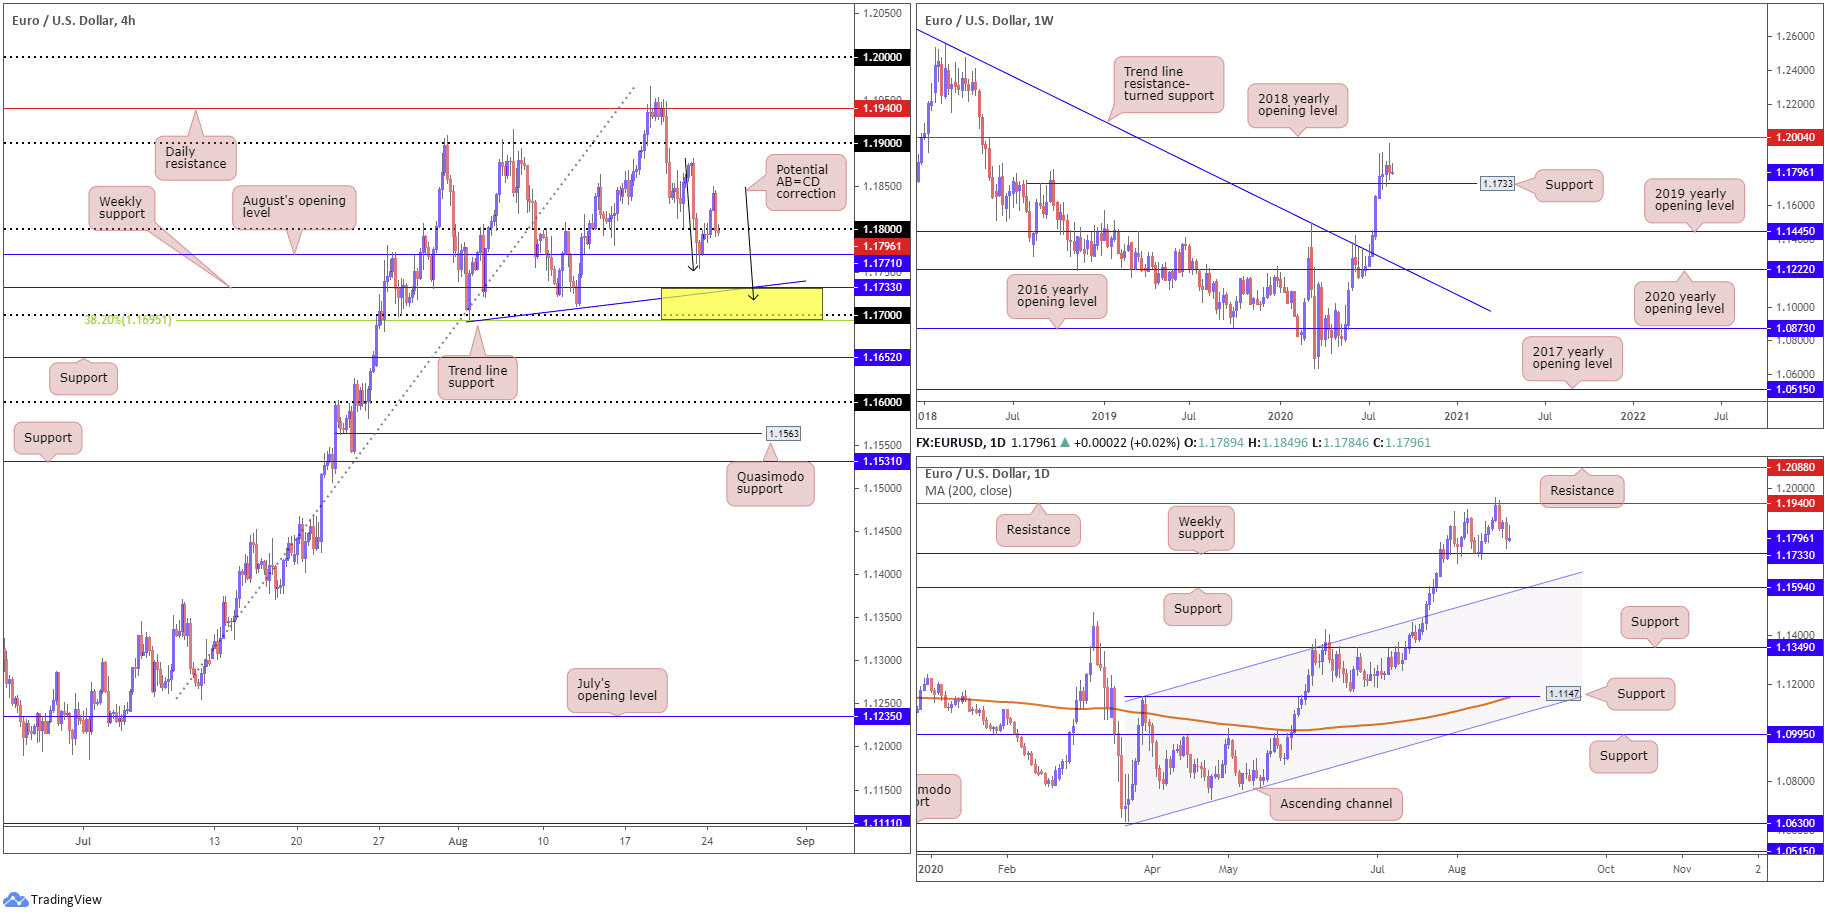
Having the US dollar index mildly snap an eight-week bearish phase, EUR/USD curled south of the 2018 yearly opening level at 1.2004 last week, also modestly snapping an eight-week bullish phase.
Support at 1.1733, a prior Quasimodo resistance level, therefore, is now back on the radar, which may be of interest to buyers, considering the recent break of trendline resistance (July 13), extended from the high 1.2555. A 1.1733 breach, on the other hand, unlocks a possible bearish theme towards the 2019 yearly opening level at 1.1445.
Although Monday wrapped up off best levels, leaving behind a notable selling wick, technical structure also remains unchanged:
Resistance at 1.1940 was brought to attention during mid-week trade last week, putting an end to a six-day bullish phase. Deprived of notable support, in spite of a brief pause Thursday, Friday headed lower and concluded the week within striking distance of weekly support mentioned above at 1.1733. Breaking 1.1733 on the daily timeframe may witness sellers strengthen their grip and approach support coming in at 1.1594, a level fusing with channel resistance-turned support, taken from the high 1.1147.
Across the page on the H4 timeframe, August’s opening level at 1.1771 clearly contained adequate oomph to take the currency pair above 1.18 to session peaks at 1.1849 on Monday. Things turned sour heading into US hours, nonetheless, as the DXY began to make its way from session lows. Assuming we reconnect with 1.1771, dipping to weekly support at 1.1733 may be in the offing. Based on the H4 timeframe, there are a number of technical elements that support the current weekly level, such as trend line support, extended from the low 1.1695, a possible AB=CD correction (black arrows) at 1.1716, the round number 1.17 and a 38.2% Fibonacci retracement ratio plotted at 1.1695.
Areas of consideration:
While August’s opening level at 1.1771 or even the 1.18 band may contain downside today, the more prominent area of support, as underscored in Monday’s technical briefing, rests between the 1.1695/1.1733 region (yellow). Not only does the zone gift appealing H4/weekly confluence (see above), the current trend in this market points north.
GBP/USD:
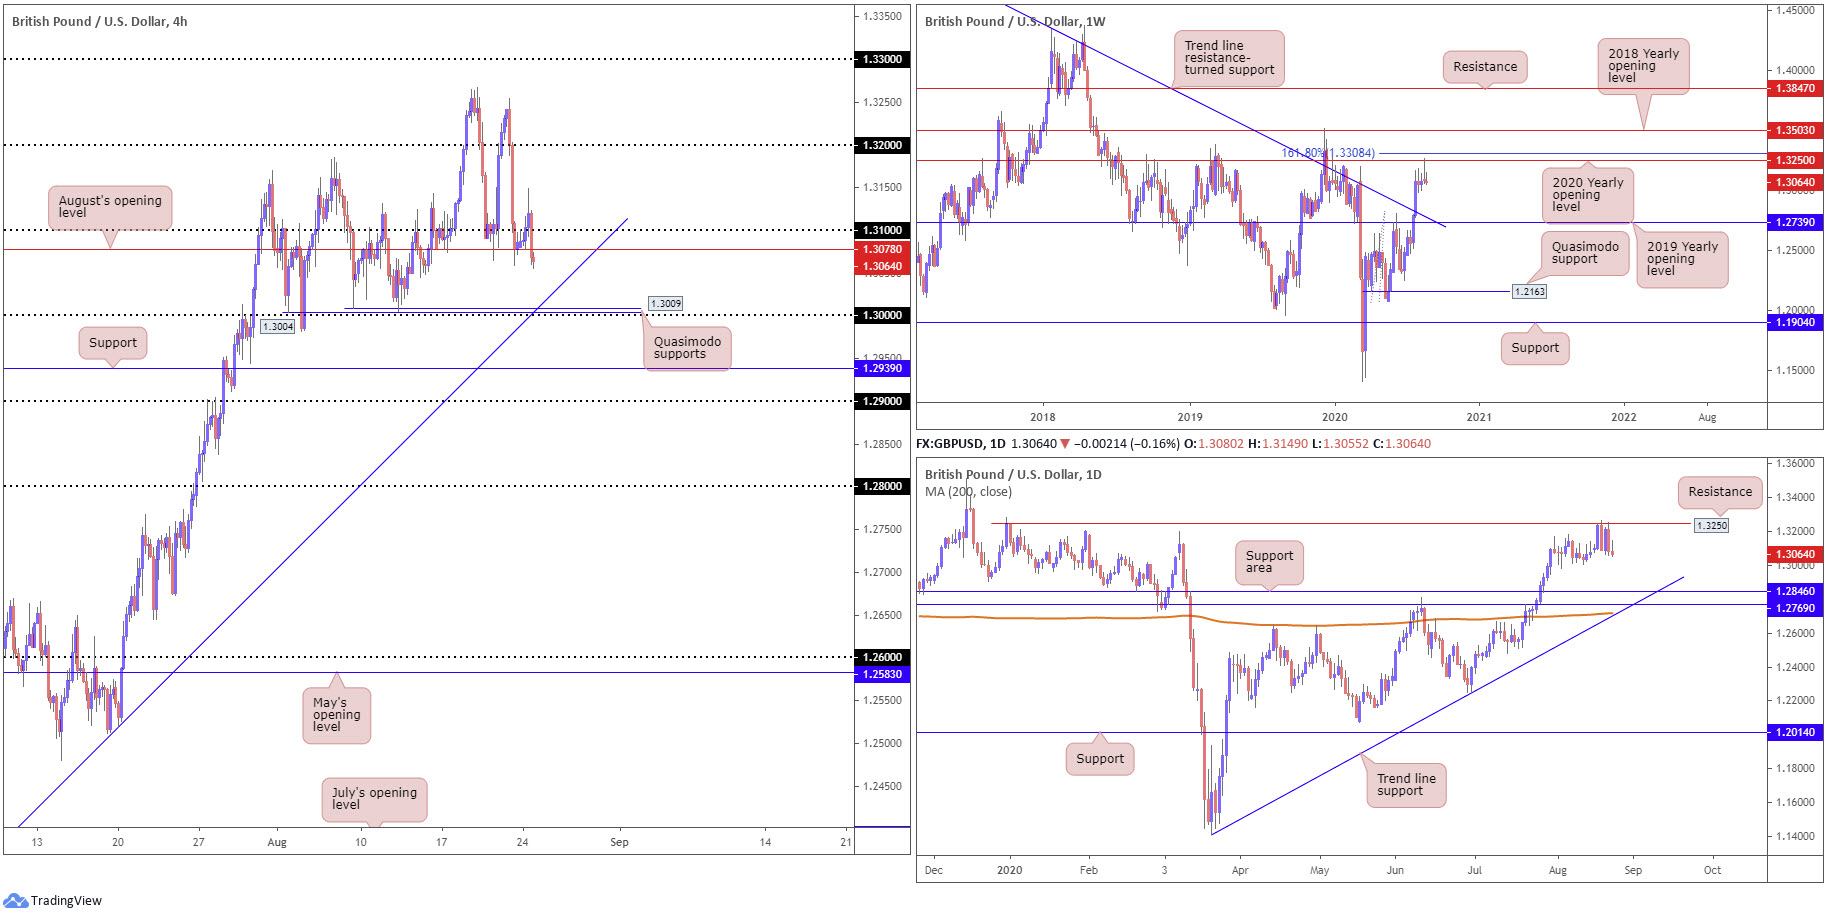
Recovery gains off August’s opening level at 1.3078 on the H4 failed to sustain moves past 1.3149 Monday amid downbeat Brexit vibes, spinning the pair back underneath 1.31 and, in recent hours, through 1.3078. Sidestepping August’s level has brought light to the key figure 1.30, reinforced by two Quasimodo supports at 1.3004 and 1.3009, as well as trend line support, taken from the low 1.2251.
Technically, the moves lower make sense. Buyers, as can be seen from the weekly timeframe, lost their flavour last week after shaking hands with the 2020 yearly opening level at 1.3250, a level sited just under a 161.8% Fibonacci extension point at 1.3308. This follows a July 27 trend line resistance (1.5930) break. Candlestick enthusiasts will also note the week ended in the shape of a gravestone doji candlestick formation, considered a bearish signal at peaks. Retreating further this week hands over the 2019 yearly opening level at 1.2739 as a possible downside target, which happens to fuse closely with the recently penetrated trendline resistance.
In addition to the above, daily price crossed swords with resistance at 1.3250, a barrier sharing the same space with resistance on the weekly timeframe, the 2020 yearly opening level. Should sellers continue defending current resistance, this week’s spotlight shines towards a daily support area between 1.2769/1.2846, closely shadowed by trend line support, taken from the low 1.1409, and a 200-day SMA (orange – 1.2718).
Areas of consideration:
For traders who read Monday’s technical briefing you may recall the following (italics):
According to the weekly timeframe, bearish scenarios sub 1.3078 on the H4 may be an avenue traders explore this week, based on weekly price fading the 2020 yearly opening level at 1.3250, shaped by way of a bearish candlestick signal.
Although weekly and daily price show room to stretch beyond 1.30 this week, the psychological level could also invite at least a recovery bid, in view of its local confluence.
As a result of current chart studies, sellers might look to gain strength south of 1.3078 today, targeting the 1.30 space. Conservative players may already be short this market based on the recent H1 1.3078 retest.
AUD/USD:
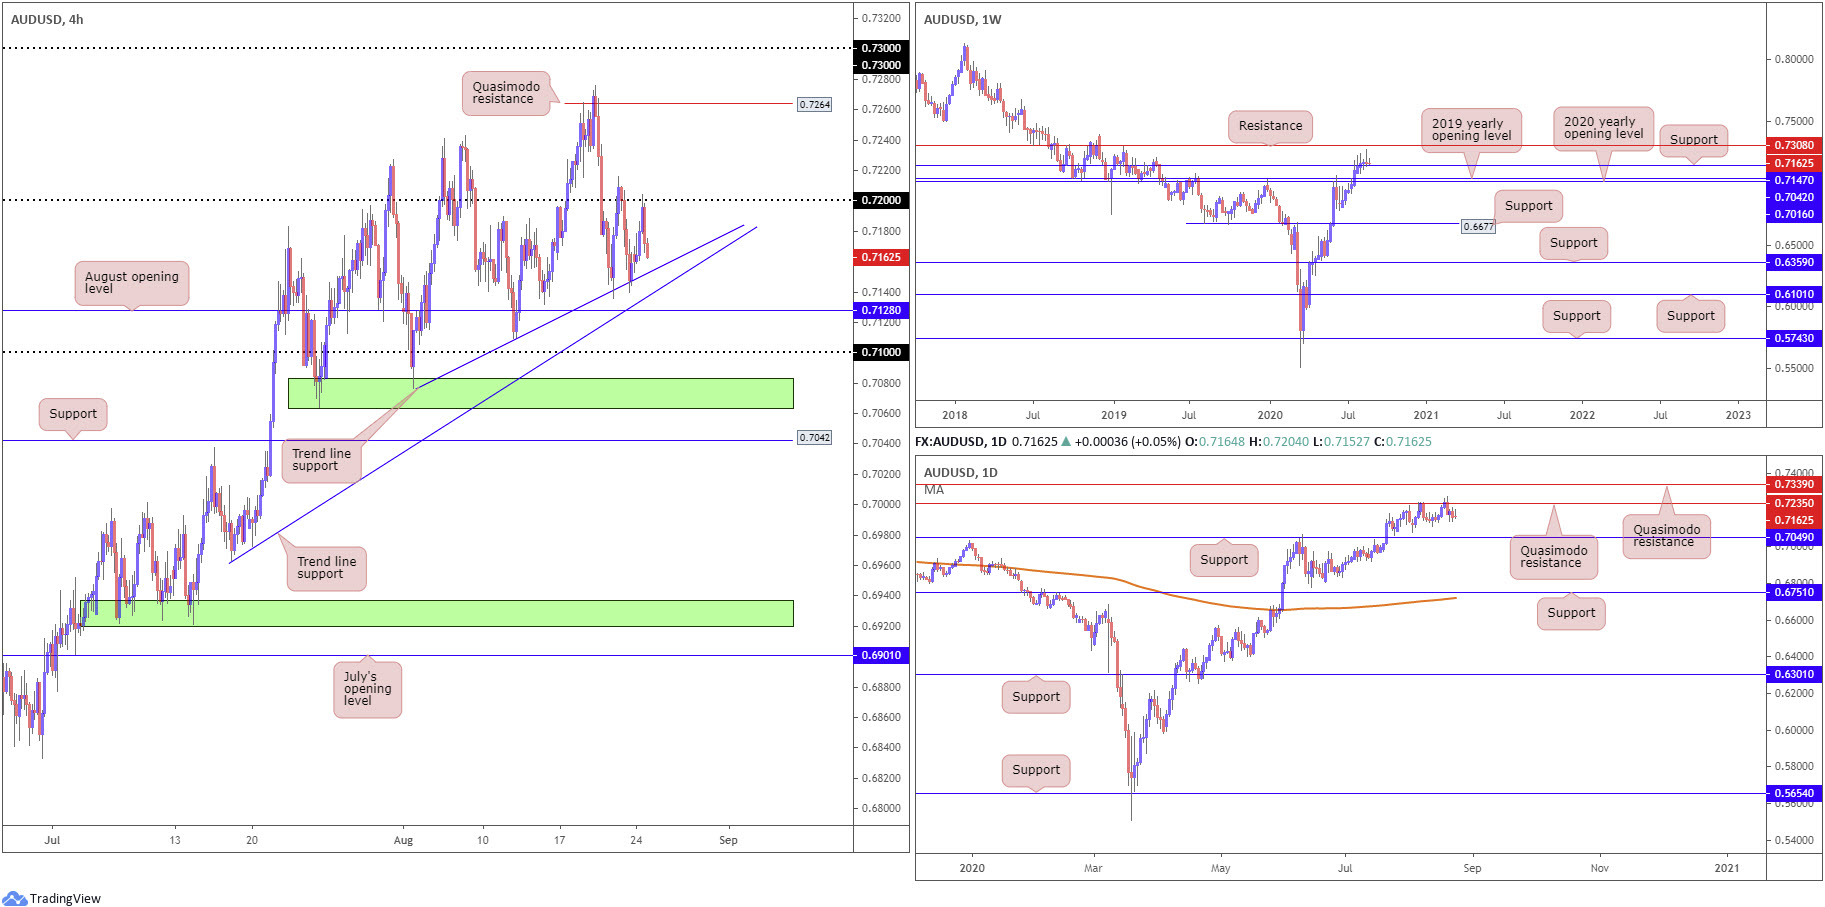
After clenching 0.72 psychological resistance on the H4 timeframe, buyers took a step back Monday. This had price action pare a large portion of daily gains, in spite of upbeat risk sentiment. Trend line support, taken from the low 0.7076, coupled with additional trend line support, from the low 0.6963, alongside August’s opening level at 0.7128, is seen to the downside, followed by the 0.71 handle.
Support, on the weekly timeframe, at 0.7147 remains in play, despite last week’s noticeable dip. Swallowing the latter will draw attention back to the 2020 and 2019 yearly opening levels at 0.7016 and 0.7042, respectively.
Although sentiment clearly remains to the upside in this market right now, daily Quasimodo resistance at 0.7235 has proven a tough nut to crack since August, with support not expected to make an appearance until 0.7049. Through the simple lens of a technical trader, though, we can see that each time price rebounds from the Quasimodo formation, sellers have been unable to register fresh lows. This indicates buyers could have the upper hand here, eventually forcing a possible 0.7235 break.
Areas of consideration:
Outlook unchanged, given the current ranging motion occurring on the H4 timeframe.
Weekly support at 0.7147 is likely on the watchlist, a level converging with H4 trend line supports and nearby support, in the shape of August’s opening level at 0.7128. Therefore, both 0.7128 and 0.7147 might entice bullish themes today, further supported by daily price suggesting a 0.7235 breach.
Irrespective of whether a bullish signal is spotted off either 0.7128 or 0.7147, the 0.72 handle is well positioned as an initial upside target.
USD/JPY:
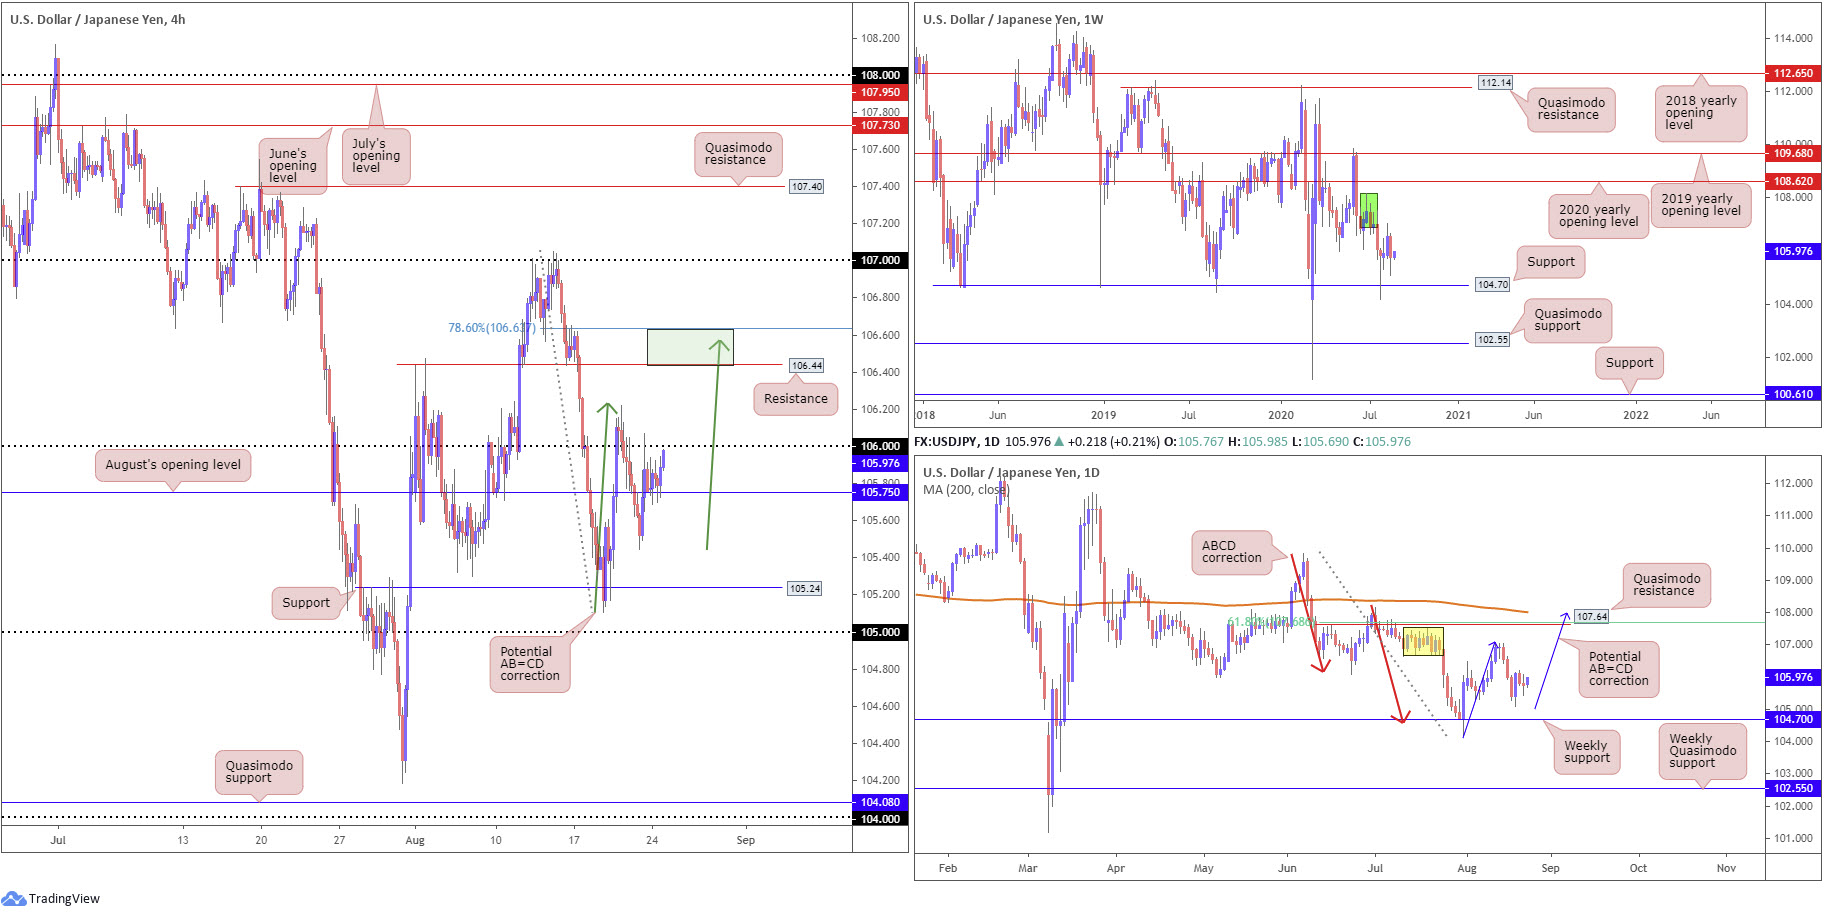
USD/JPY spent the majority of Monday’s session mixed, bolstered by support in the form of August’s opening level at 105.75 on the H4 timeframe. In recent hours, however, sponsored by a modest uptick in US Treasury yields and a DXY bid, the H4 candles are seen closing in on the 106 resistance. Gaining a foothold above 106 throws resistance at 106.44 in the mix, a base fusing closely with a possible AB=CD configuration (green arrows) at 106.57 and a 78.6% Fibonacci retracement ratio at 106.64.
From the weekly timeframe, structure remains unchanged, therefore here’s a reminder of where we left things in Monday’s weekly technical briefing (italics):
Supply at 108.16-106.88 (green) has so far proven a difficult hurdle to overcome, generating a sizeable downside move last week to lows at 105.10. Neighbouring structures to keep a tab on fall in at support drawn from 104.70, the 2020 yearly opening level at 108.62 and, at a push, the 2019 yearly opening level at 109.68.
Similarly, here’s where we left the daily timeframe (italics):
Last Wednesday’s rebound could be the beginnings of a D-leg to a possible AB=CD bearish correction (blue arrows) at 108.00, while a dip may draw in weekly support mentioned above at 104.70. Serving nearby the AB=CD structure, traders will also find Quasimodo resistance positioned nearby at 107.64, along with a 61.8% Fibonacci retracement ratio at 107.68 and the 200-day SMA (orange – 108.01).
Areas of consideration:
Outlook unchanged, owing to Monday’s lacklustre activity.
Holding north of August’s opening level at 105.75 and breaking 106 not only ignites intraday breakout strategies, it directs attention to the resistance area on the H4 between 106.64/106.44 (green). This area represents an upside target for longs north of 106 and may also contain enough energy to swerve things back to 106.
Longer term, traders are still likely watching for more bullish momentum to form, perhaps enough to eventually complete the AB=CD configuration on the daily timeframe.
USD/CAD:
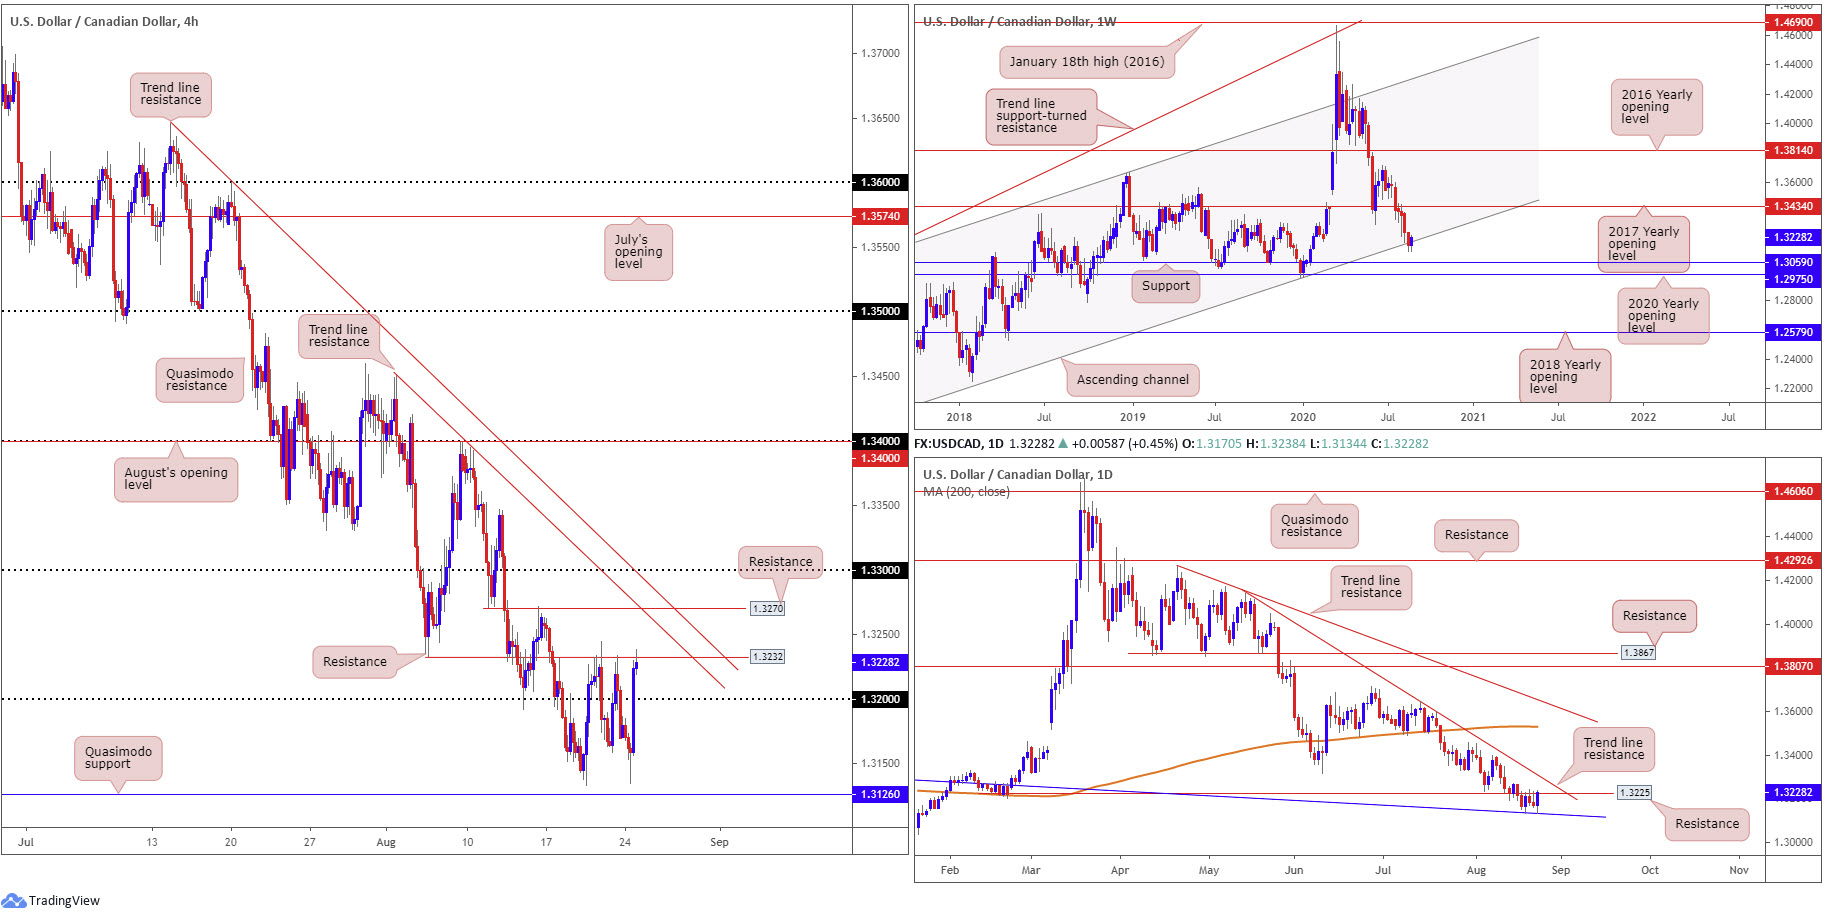
Despite an animated push to 1.3134 early Monday, USD/CAD reversed direction as traders entered US hours. US Treasury yields catching a fresh bid, along with the DXY trading positive and WTI fading session peaks ($42.86 a barrel), pulled USD/CAD above 1.32 to familiar H4 resistance at 1.3232. Breaking this level possibly clears the runway north to another layer of resistance at 1.3270, joined closely with two trend line resistances, taken from highs 1.3451 and 1.3646.
Further out on the weekly timeframe, we can see last week’s action recorded a sixth consecutive weekly loss, drawing price marginally beneath long-term channel support, taken from the low 1.2061. As you can see, though, Monday found grip around the channel region, yet additional selling could still be in the offing which may eventually bring on support at 1.3059.
A closer reading of price action on the daily timeframe shows the unit remains sandwiched between trend line resistance-turned support, extended from the high 1.3382, and resistance at 1.3225, a prior Quasimodo support level. Retaking 1.3225 resistance points to a rebound off the weekly channel support, though do bear in mind daily action must also contend with nearby trend line resistance, taken from the high 1.4140. The current daily trend line support giving up ground, nonetheless, signals weakness off weekly channel support and a possible push for weekly support at 1.3059.
Areas of consideration:
- Buyers and sellers are battling for position around weekly channel support.
- Daily price trades between resistance at 1.3225 and a nearby trend line support.
- H4 is seen kissing the underside of resistance at 1.3232.
On account of the above, a H4 break of 1.3232 could initiate intraday bullish strategies to resistance at 1.3270 and possibly to 1.33, owing to where we’re coming from on the weekly timeframe. Any further than this is likely to meet with opposition: the daily trend line resistance.
USD/CHF:
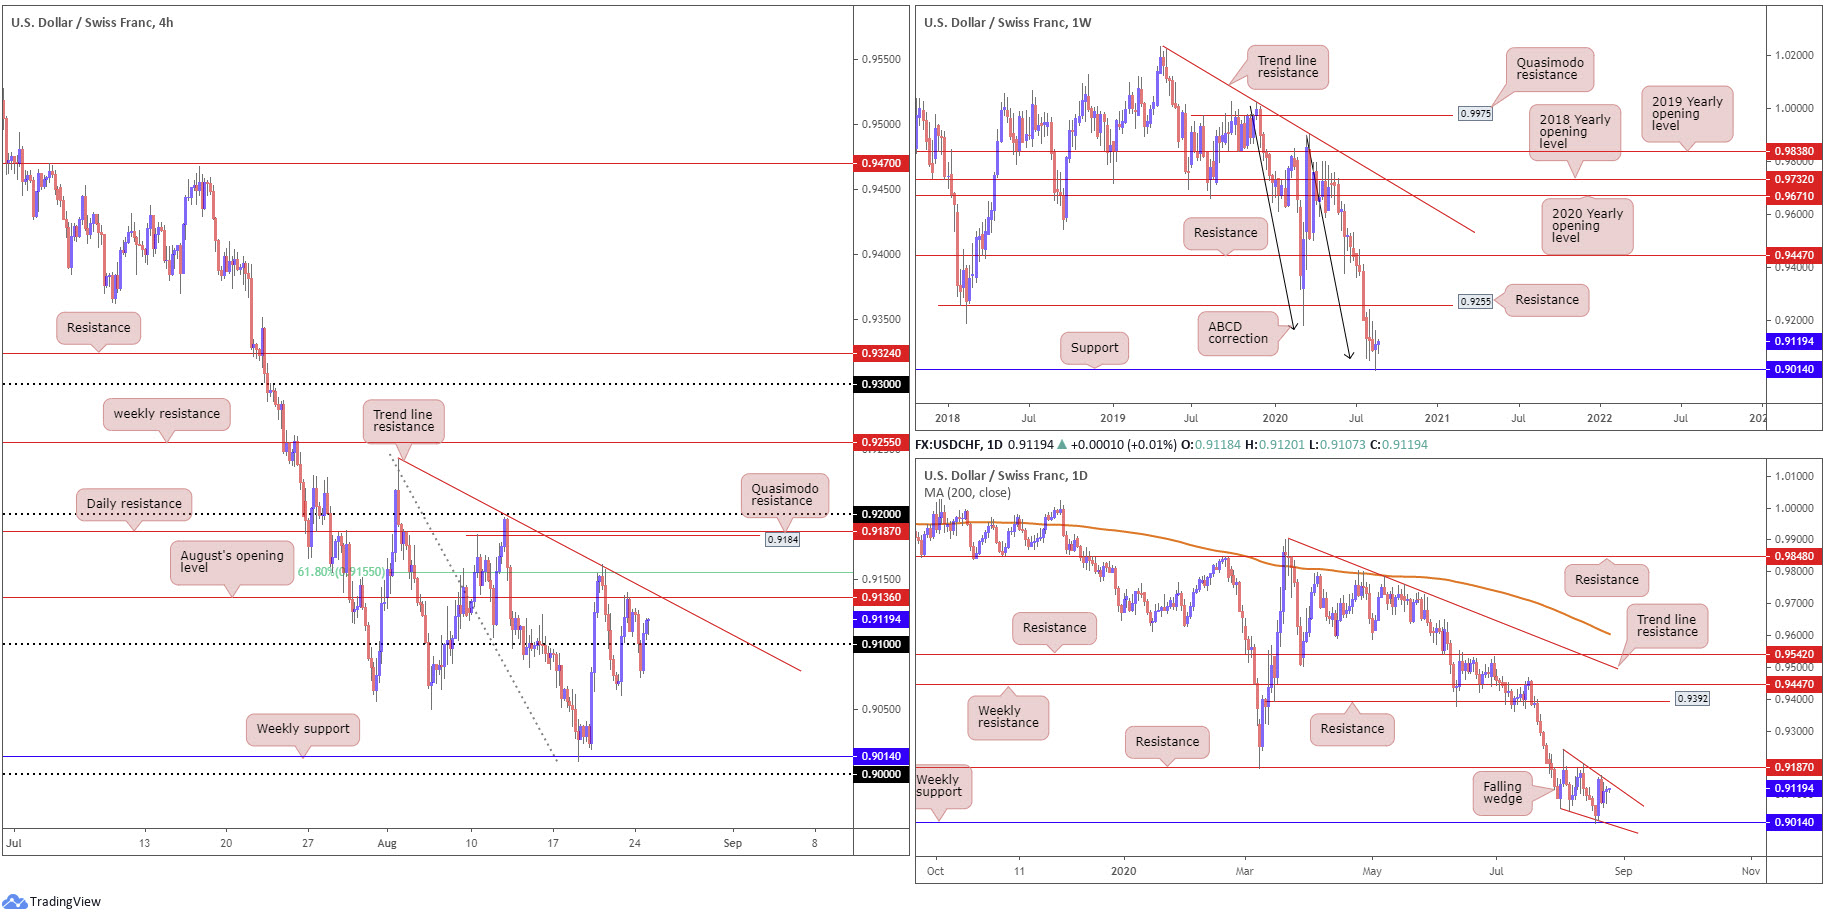
Working from the top this morning, recent analysis discovered support on the weekly timeframe at 0.9014, a level garnering additional impetus from ABCD support at 0.9051 (black arrows). This shines the spotlight on resistance at 0.9255, a prior Quasimodo support level. Beyond current support, the next layer of support is not visible until reaching 0.8792.
Out of the daily timeframe, we can see price action presenting a falling wedge pattern, pencilled in from the high 0.9241 and a low of 0.9056. Penetrating this pattern to the upside, preferably also taking out resistance at 0.9187, might be enough to persuade a reversal and attempt an approach to at least weekly resistance mentioned above at 0.9255, followed by the falling wedge take-profit target (can be measured once a breakout occurs).
Monday, as you can see, finished modestly higher, significantly off session lows at 0.9074. Above 0.91 on the H4 timeframe, price action trades within striking distance of August’s opening level at 0.9136. Considerable resistance lies nearby, however, including trend line resistance, taken from the high 0.9241, a 61.8% Fibonacci retracement ratio at 0.9155, followed by Quasimodo resistance at 0.9184, a level buffered by daily resistance underscored above at 0.9187.
Areas of consideration:
The rebound from weekly support at 0.9014 is significant in this market, particularly as it’s joined with a falling wedge pattern on the daily timeframe. To take advantage of higher timeframe structure, based on the H4 timeframe, a H4 close above 0.92 is needed, targeting weekly resistance at 0.9255.
Although prospective buyers may be watching for a break above 0.92, the area made up between 0.92, the H4 Quasimodo resistance at 0.9184 and daily resistance at 0.9187, could attract intraday sellers, should we continue to climb higher today.
A dip, assuming price is unable to maintain a position above 0.91, could also form back to weekly support at 0.9014, yet this time also taking the key figure 0.90 on the H4 to accumulate fresh buyers.
Dow Jones Industrial Average:
Major US stock indexes concluded Monday higher amid optimism surrounding COVID-19 medical advances. The Dow Jones Industrial Average rallied 378.13 points, or 1.35%; the S&P 500 advanced 34.12 points, or 1.00% and the tech-heavy Nasdaq 100 traded higher by 71.01 points, or 0.61%.
Monday cemented a strong bullish position, extending end-of-week recovery gains. For those who read Monday’s technical briefing you may recall the following (italics):
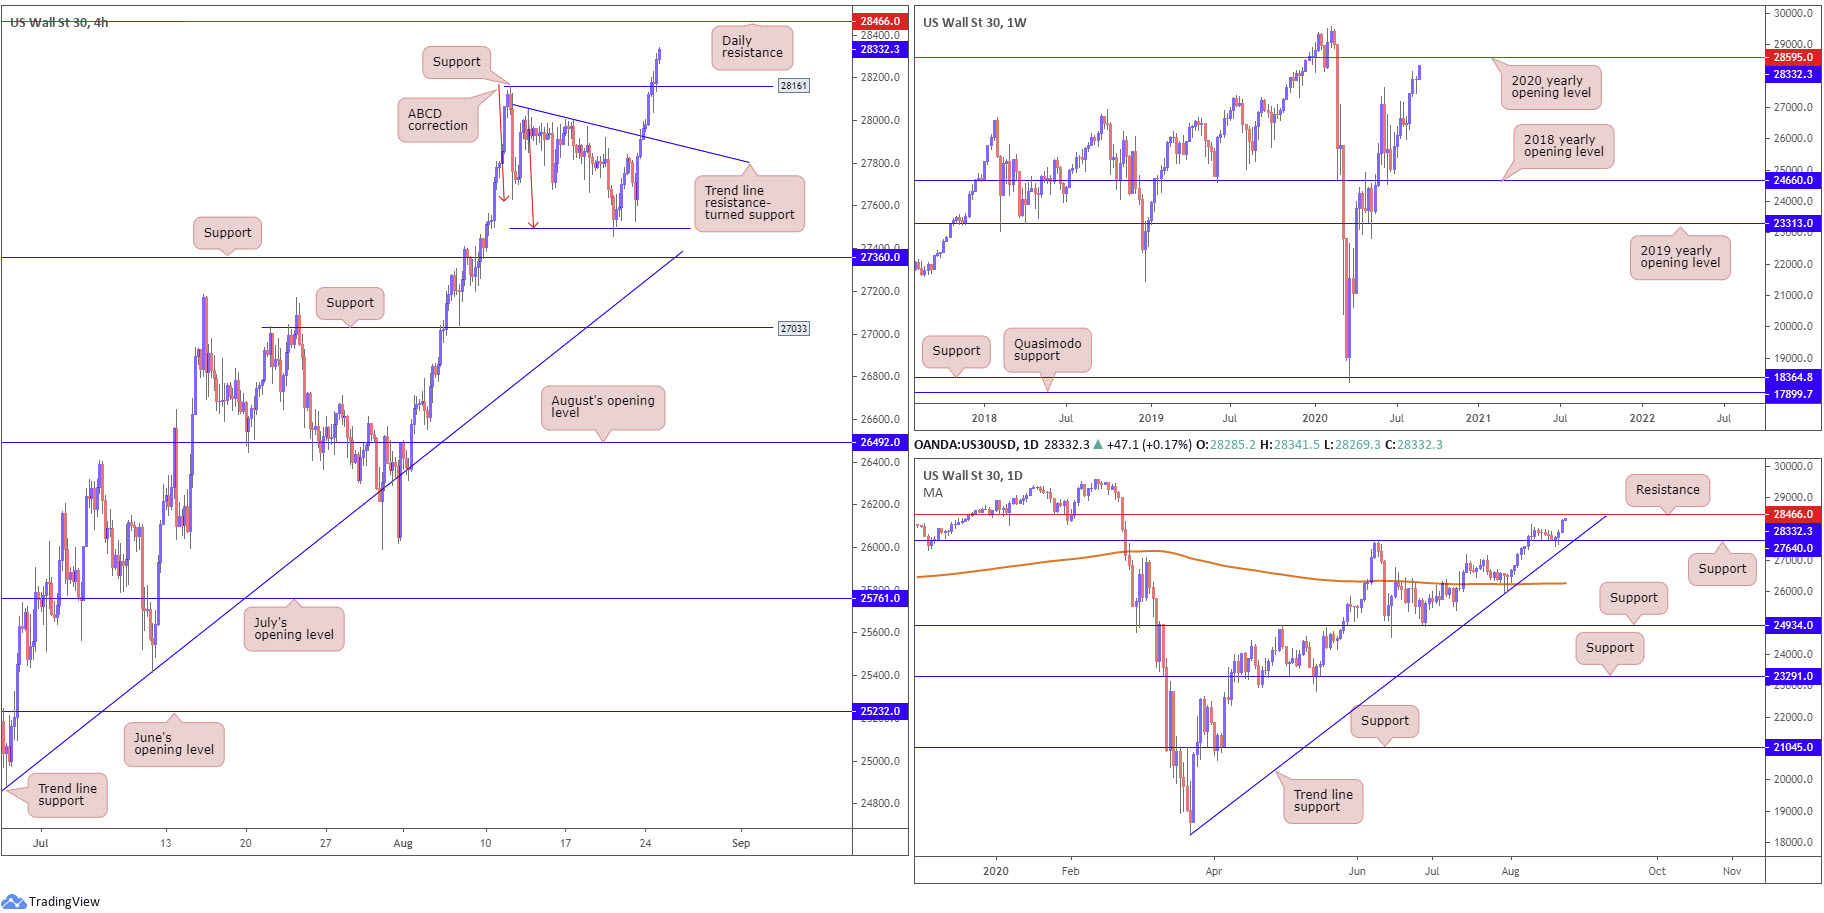
With daily support at 27640 firmly in the frame, along with a H4 ABCD correction (27495) recently forming and weekly price exhibiting scope to approach the 2020 yearly opening level at 28595, a violation of current H4 trend line resistance could be seen early in the week.
The recent test of H4 trend line resistance may also have buyers from the ABCD structure reduce risk to breakeven and bank partial profits.
As evident from the charts this morning, we pushed through H4 trend line resistance and, as of current writing, are making our way towards daily resistance at 28466, a prior Quasimodo support level, closely shadowed by weekly resistance in the shape of the 2020 yearly opening level at 28595.
Areas of consideration:
H4 retreating to 28161 support might stir dip-buying strategies today, targeting daily resistance marked above at 28466 as an initial port of call. Should 28161 see H4 action print a bullish candlestick signal, this may also encourage conservative buyers into the fight.
Failure to pullback today, however, the area between 28595/28466 (weekly/daily resistances) are likely to inspire countertrend strategies.
XAU/USD (GOLD):
Spot gold ended Monday marginally lower, weighed by US Treasury yields and the DXY advancing north.
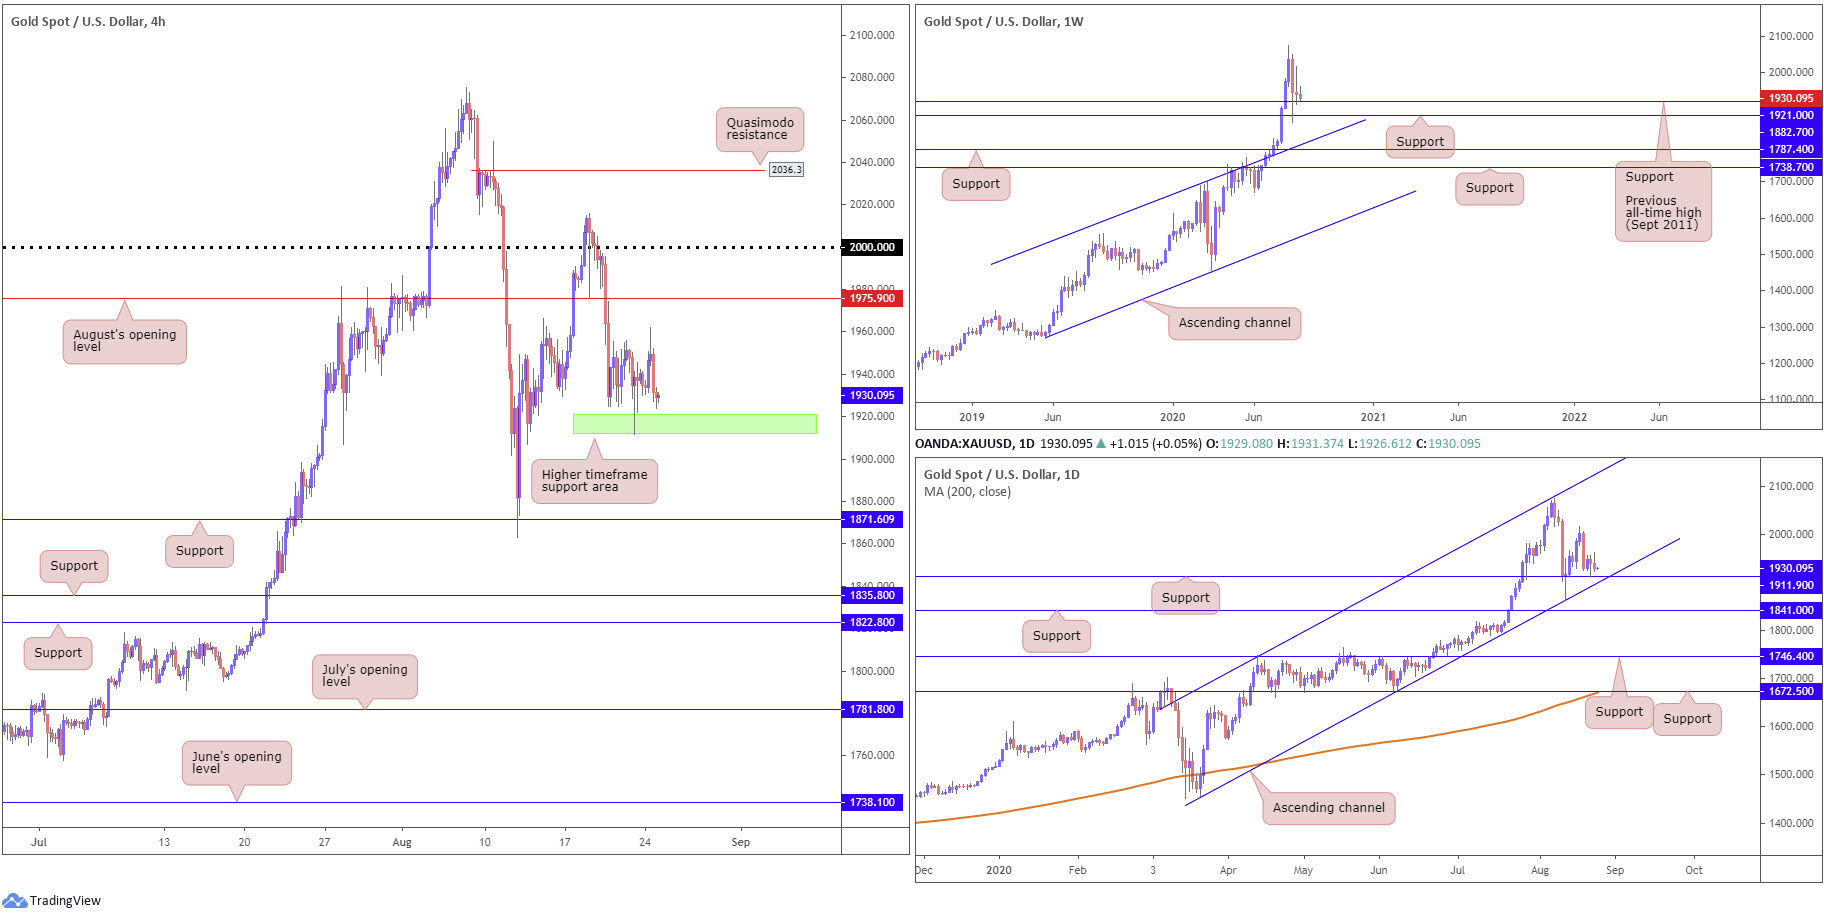
$1,921.00, the previous major all-time high (September 2011), along with support at $1,882.70, remain bulky support on the weekly timeframe, following the recent correction from all-time peaks at $2,075.28. Failure to hold, we could see channel resistance-turned support, etched from the high $1,703.28, enter play.
Since mid-March, daily flow has been trading within the walls of an ascending channel configuration, taken from $1,455.32 and $1,747.72. Over the past couple of weeks, we have seen price action reconnect with channel support, together with support at $1,911.90. Aside from the $2,015.72 August 18 high, limited resistance is in view.
Between August’s opening level from $1,975.90 and support at $1,871.60 on the H4 timeframe, traders will acknowledge the yellow metal has been chalking up an indecisive tone between $1,955.03/$1,925.78 since Wednesday last week. Besides the current range, technical studies display limited levels until reaching either $1,975.90 or $1,871.60.
Areas of consideration:
The higher timeframe support area at $1,911.90-$1,921.00 (daily and weekly supports – shown on the H4 timeframe in green) is likely to remain on the watchlists going forward. Should this area welcome price once more, H4 traders may watch for signs of bullish activity to attempt an approach towards August’s opening level from $1,975.90 on the H4, and, quite possibly, the $2,000.00 mark.
The accuracy, completeness and timeliness of the information contained on this site cannot be guaranteed. IC Markets does not warranty, guarantee or make any representations, or assume any liability regarding financial results based on the use of the information in the site.
News, views, opinions, recommendations and other information obtained from sources outside of www.icmarkets.com.au, used in this site are believed to be reliable, but we cannot guarantee their accuracy or completeness. All such information is subject to change at any time without notice. IC Markets assumes no responsibility for the content of any linked site.
The fact that such links may exist does not indicate approval or endorsement of any material contained on any linked site. IC Markets is not liable for any harm caused by the transmission, through accessing the services or information on this site, of a computer virus, or other computer code or programming device that might be used to access, delete, damage, disable, disrupt or otherwise impede in any manner, the operation of the site or of any user’s software, hardware, data or property.


