
Key risk events today:
US CB Consumer Confidence; RBNZ Financial Stability Report.
(Previous analysis as well as outside sources – italics).
EUR/USD:
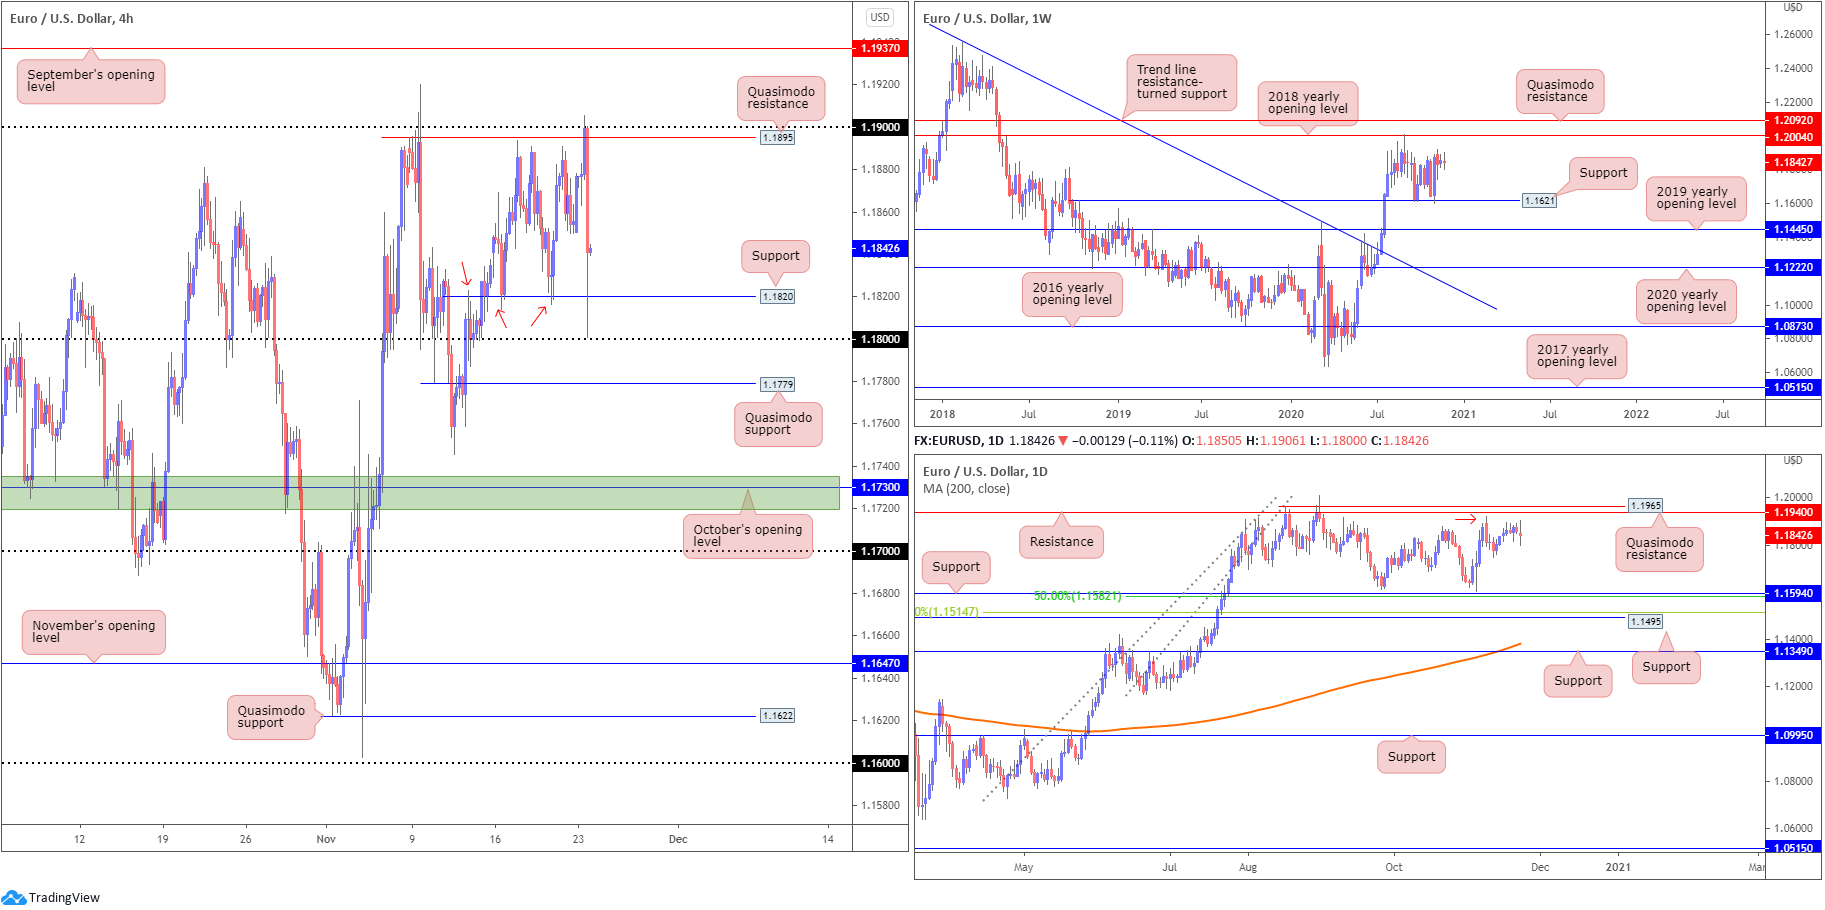
1.19 and H4 Quasimodo resistance at 1.1895 came forward Monday and guided EUR/USD sharply lower, spiking through H4 support at 1.1820 and testing the 1.18 handle. H4 Quasimodo support priced in at 1.1779 is in line should 1.18 give way. Landscape north of 1.19, on the other hand, shifts light towards September’s opening value at 1.1937.
From the weekly timeframe, Monday’s technical briefing aired the following (italics):
Despite healthy interest off support at 1.1621 early November, recent weeks exhibited an uninspiring tone.
Should buyers regain consciousness, the 2018 yearly opening value at 1.2004, closely shadowed by Quasimodo resistance priced at 1.2092, are on show.
Traders may also want to acknowledge July’s trend line resistance break, taken from the high 1.2555, on top of the break of the 1.1495 March 9 swing high, consequently placing long-term buyers in a reasonably healthy position.
Aside from the daily timeframe finishing Monday in the shape of a long-legged doji pattern, structure remains unchanged from Monday’s technical briefing (italics):
November 9 witnessed fresh highs form (red arrow), following a spike to lows ahead of support at 1.1594 and a 50.0% retracement ratio from 1.1582. For some, this may be understood as bullish confirmation. In terms of resistance, however, 1.1940, followed by Quasimodo resistance from 1.1965, is seen nearby.
Traders may also recognise that just beyond the aforementioned resistances, weekly resistance at 1.2004 is seen (2018 yearly opening value).
Areas of consideration:
- 18 is likely watched in this market. Sell-stop liquidity resting south of this round number (protective stop-loss orders and breakout sellers’ orders) may also tempt a fakeout lower to draw in fresh buyers from H4 Quasimodo support at 1.1779.
- 19 and H4 Quasimodo resistance at 1.1895 also remains watched resistance, following yesterday’s sizeable retracement.
- Possible breakout buying north of 1.19 on the H4, targeting September’s opening value at 1.1937.
- September’s opening value on the H4 and daily resistance at 1.1940 marks healthy confluence to work with if a breach of 1.19 occurs.
GBP/USD:
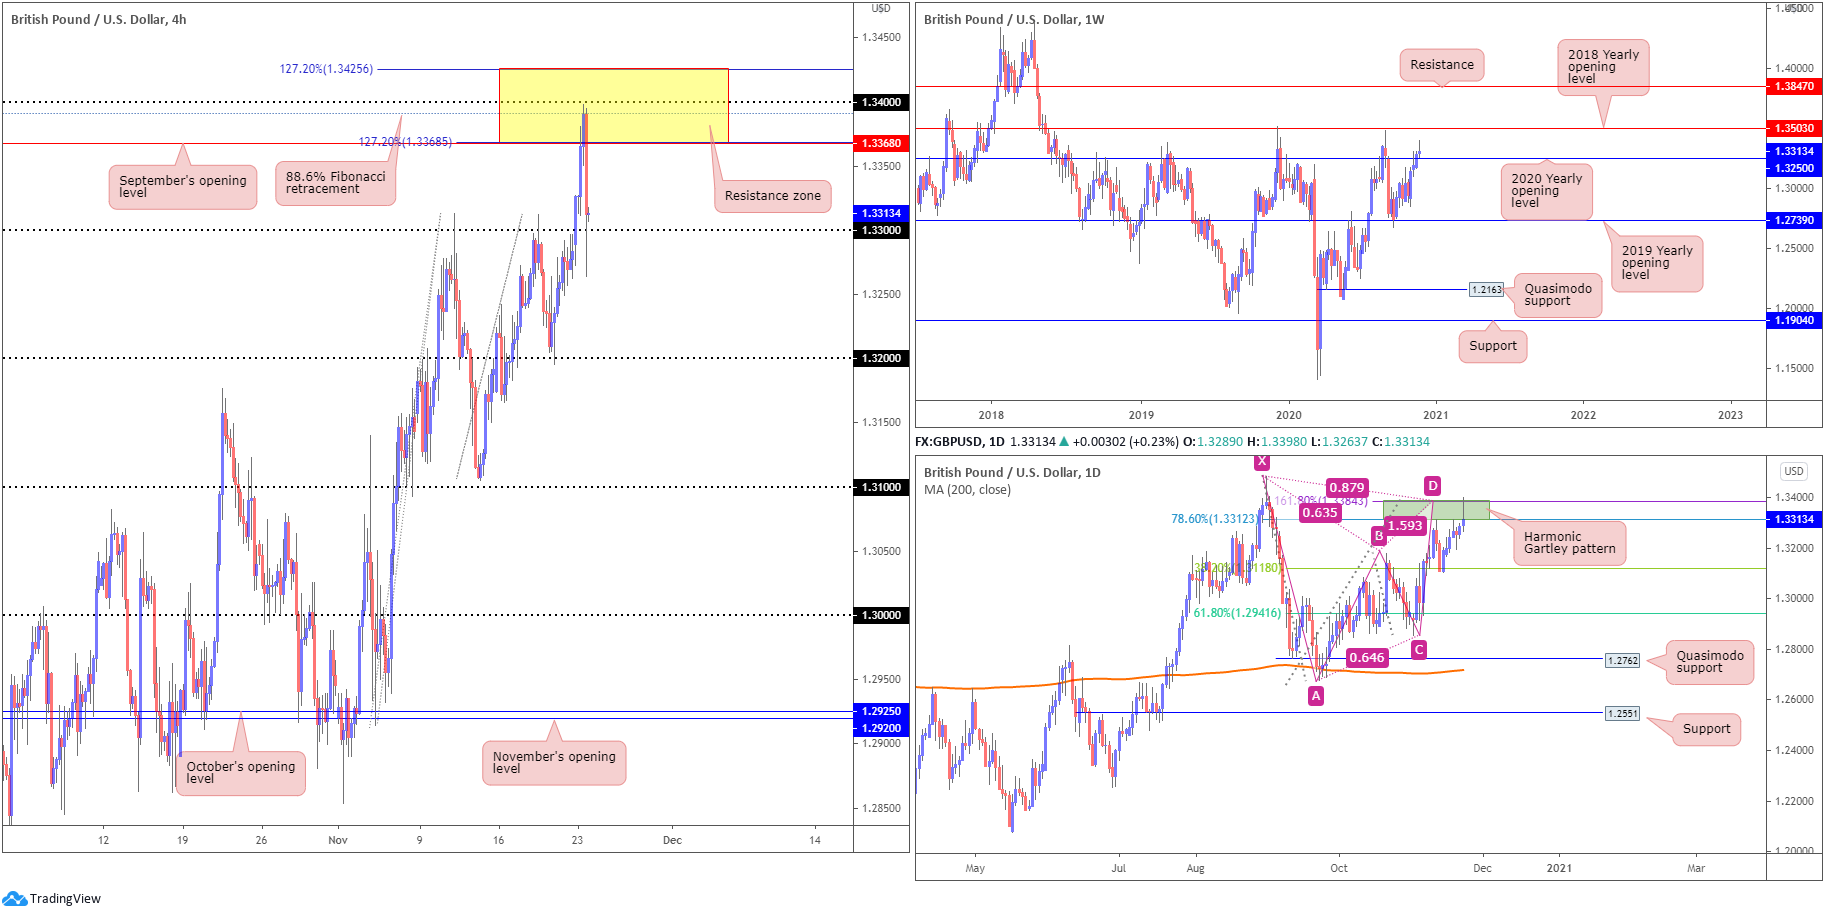
Following a jump to highs at 1.3397, testing a H4 resistance zone between 1.3425/1.3368 (made up of two 127.2% Fibonacci projection points at 1.3425/1.3368, the round number 1.34, an 88.6% Fibonacci retracement ratio at 1.3390 and September’s opening value at 1.3368), GBP/USD made a sharp U-turn amid USD strength on healthy PMI figures.
Monday’s move lower bumped H4 candles into limit orders at 1.33, with many sell-stops likely triggered on the whipsaw to lows at 1.3263.
From the weekly timeframe, after rejecting the 2019 yearly opening value from 1.2739 in September, buyers eventually mustered enough strength to take on the 2020 yearly opening value at 1.3250 last week and record a third consecutive weekly gain. Additional strength could have the unit knock on the door of the 2018 yearly opening value from 1.3503. Technically, however, the immediate trend has remained lower since topping in 2014.
The technical picture from the daily timeframe shows price tipped marginally over the upper edge of the bearish harmonic Gartley pattern’s PRZ at 1.3384/1.3312 on Monday. A show from sellers here could lead to the 38.2% Fibonacci support at 1.3118 being tested, commonly read as an initial take-profit target (arranged from legs A-D of the Gartley [tested earlier this month]). Overthrowing the aforementioned PRZ could be viewed as an early cue we’re headed for the 2018 yearly opening value at 1.3503 on the weekly scale.
Areas of consideration:
- With price movement probing south of 1.33 to lows at 1.3263 potentially tripping stops, and daily price rejecting the bearish harmonic Gartley pattern’s PRZ at 1.3384/1.3312, sellers may continue lower to test weekly support at 1.3250 today, with a break targeting the 1.32 handle.
AUD/USD:
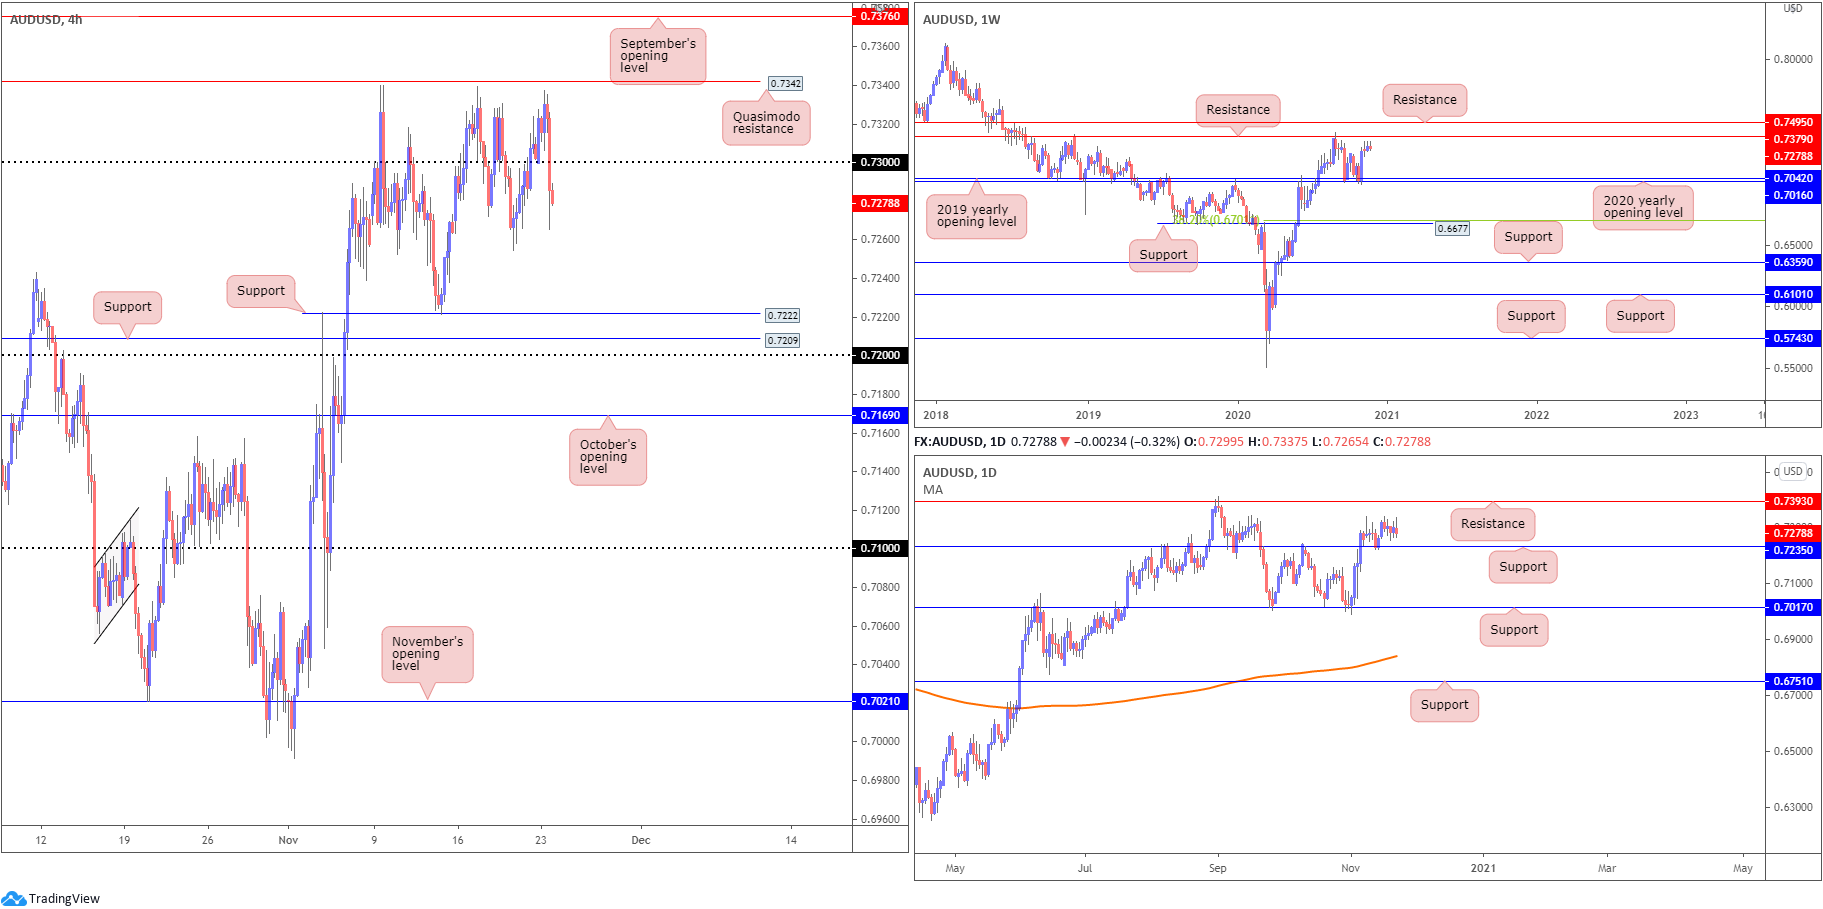
Monday had the Australian dollar retreat sub 0.73 against the US dollar, leaving H4 Quasimodo resistance at 0.7342 unchallenged. Aside from last Thursday’s low at 0.7254, H4 sellers could be watching 0.72, 0.7209 and 0.7222.
The weekly timeframe’s technical structure remains unchanged:
A substantial 3% showing off the 2020 (0.7016) and 2019 (0.7042) yearly opening values (supports) early November has positioned the unit within striking distance of resistance at 0.7379.
In view of this market trending higher since early 2020, buyers may also be eyeballing resistance parked at 0.7495.
The daily timeframe’s structure also unchanged as of Monday’s close:
The November 13 retest of support at 0.7235, despite a somewhat lacklustre performance last week, adds weight to increased interest to the upside.
This may also sweet-talk buyers to attempt to take a run at resistance at 0.7393 (positioned above weekly resistance).
Areas of consideration:
- 73 may be a level sellers watch for resistance today, having seen room to move lower on the higher timeframes. Beyond last Thursday’s low at 0.7254, daily support is present at 0.7235, followed by H4 supports at 0.72, 0.7209 and 0.7222.
USD/JPY:
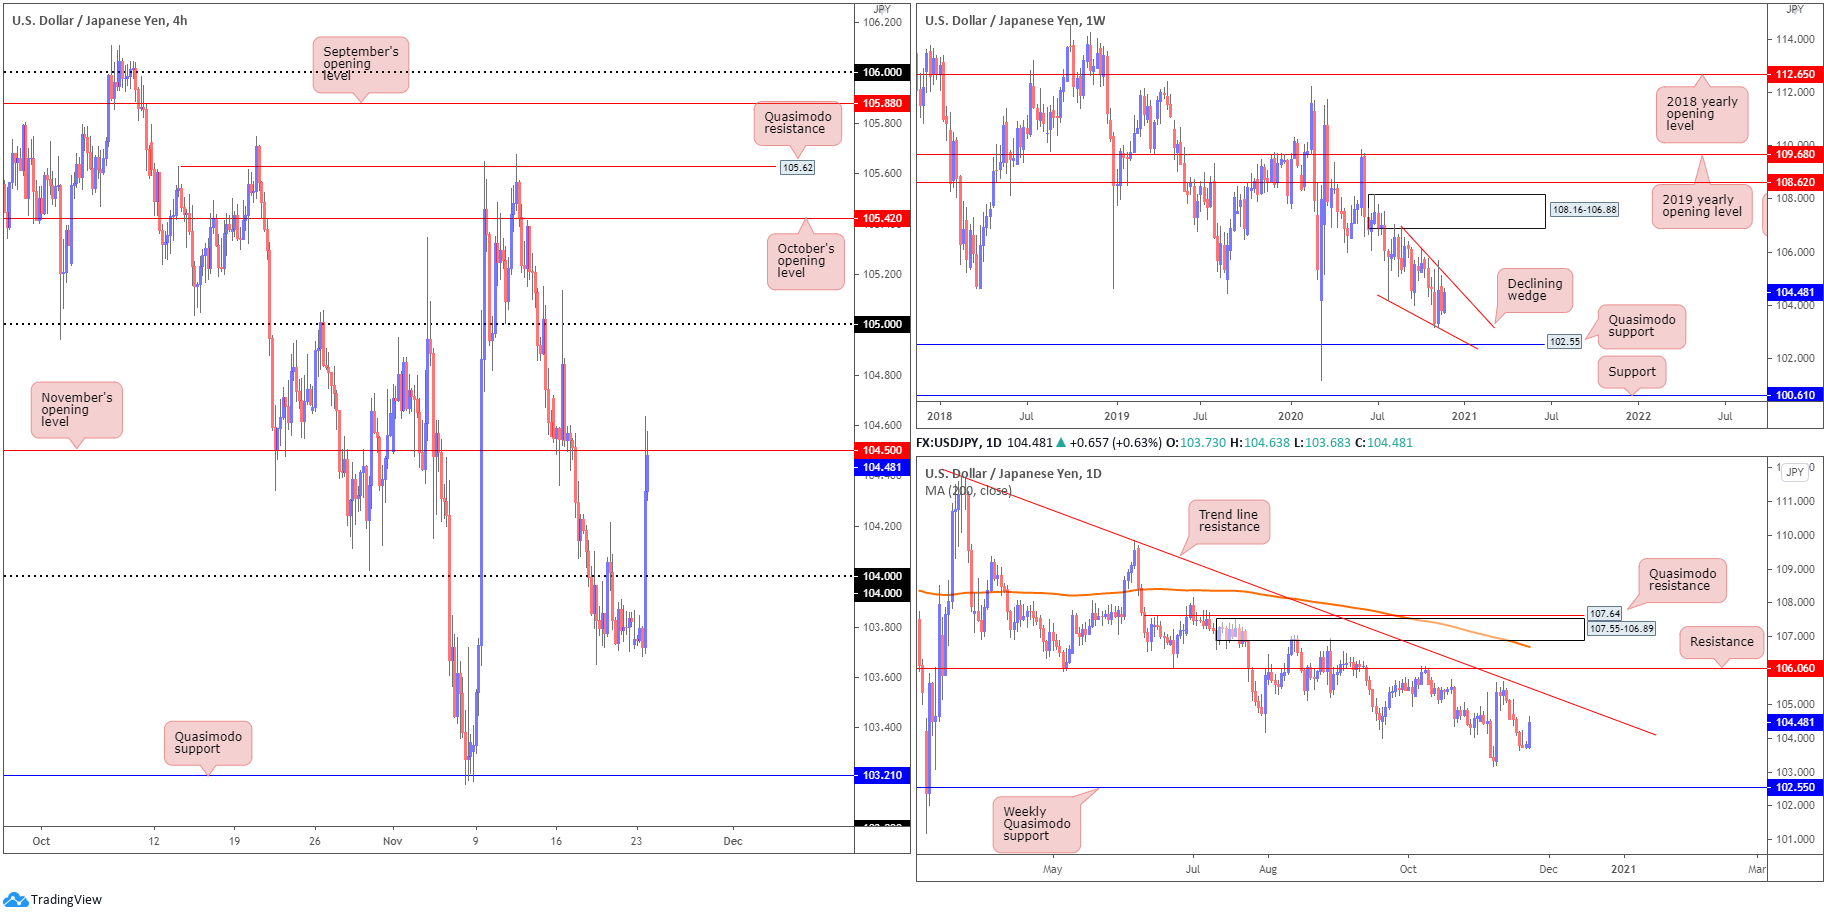
Sellers, as evident from the H4, failed to find acceptance beneath the 104 handle on Monday amidst stronger-than-anticipated US PMI figures. This led to price forcefully moving into November’s opening value at 104.50, piercing the level to register session peaks at 104.63. Conquering the latter today perhaps clears the river north toward 105, swinging the pendulum in favour of breakout buying strategies.
Against the backdrop of the H4 timeframe, weekly price, since connecting with the underside of supply at 108.16-106.88 in August, price has gradually shifted lower and developed a declining wedge (106.94/104.18). Quasimodo support at 102.55 is in the picture, with a break exposing support plotted at 100.61. A strong bounce from 102.55 may provide enough impetus for buyers to attempt a breakout above the current declining wedge.
The technical landscape from the daily timeframe, however, reveals scope to close in on trend line resistance, extended from the high 111.71, with a break to perhaps take a run at resistance from 106.06. Nevertheless, sellers taking over could lead price to the 103.17 November 6 low, followed by weekly Quasimodo support at 102.55.
Areas of consideration:
- Price action responding from November’s opening value at 104.50 on the H4 scale may invite sellers, yet given room to attack higher space on the higher timeframes could have buyers make an appearance to approach the 105 region.
USD/CAD:
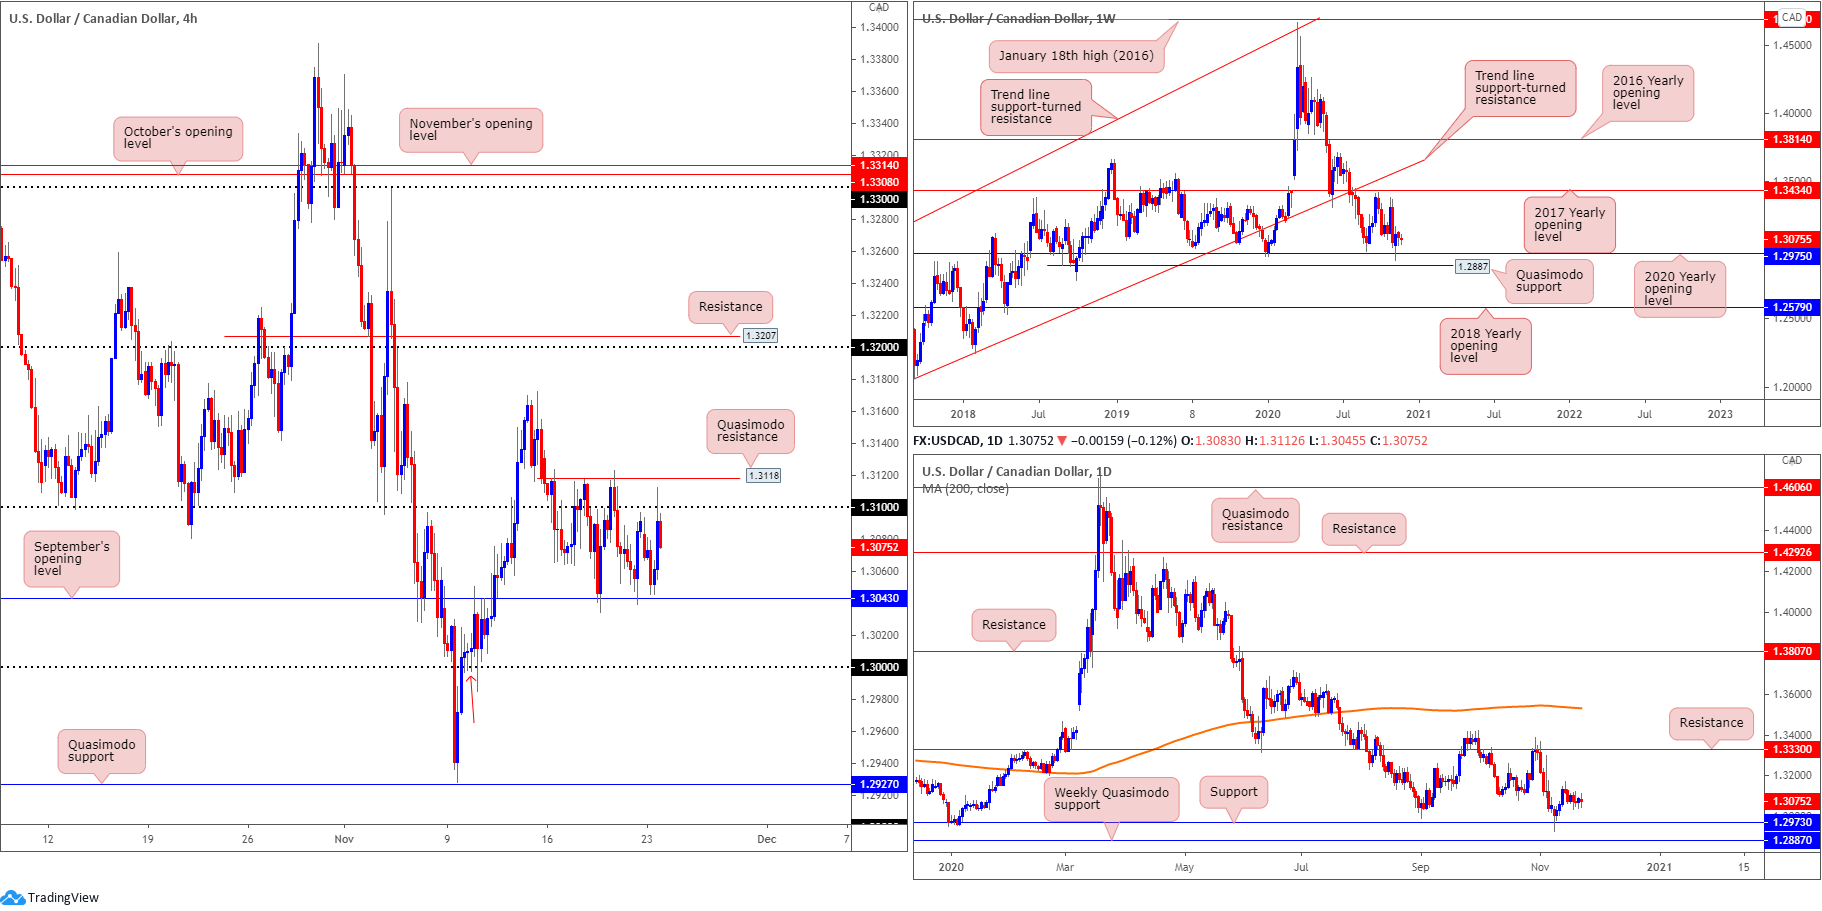
Since the beginning of last week, H4 candles constructed a well-defined range between micro Quasimodo resistance at 1.3118 (located just above the 1.31 handle) and September’s opening value at 1.3043. Monday, as you can see, remained confined within the aforementioned range.
Areas of interest outside of this newly formed consolidation are the key figure 1.30 (a widely watched level in this market that’s joined by a Quasimodo support [red arrow] around 1.2997) and the 1.3172 November 13 high, followed by the 1.32 base.
In terms of the higher timeframes, limited changed has been seen:
Weekly perspective:
The 2020 yearly opening value at 1.2975, arranged north of Quasimodo support priced in at 1.2887, recently triggered a wave of buying, though lacked follow-through last week. Increased interest to the upside, nevertheless, could eventually fuel a test of the 2017 yearly opening value at 1.3434, sheltered under trend line support-turned resistance, taken from the low 1.2061.
Given this market has traded lower since topping at 1.4667 in early 2020, though, breaking the aforementioned supports remains an option, consequently swinging the pendulum in favour of further weakness towards the 2018 yearly opening value at 1.2579.
Daily perspective:
With weekly price rebounding from support at 1.2975 as well as daily price also recently coming off support at 1.2973 (essentially marking the same area), flow on the daily chart, despite the tame movement of late, reveals room to rally as far north as 1.3330.
Areas of consideration:
- Range traders may be drawn to the H4 scale, monitoring range limits for bullish/bearish scenarios.
- A H4 close north of 1.3118/1.31 may nudge breakout buyers. Reinforced on the back of higher timeframe supports recently entering the fray, buyers may attempt to lift the pair towards the 1.3172 November 13 high and 1.32 region. Conservative traders may seek a 1.31 retest before committing.
- 30, with the level sited 25 pips above weekly support at 1.2975 (2020 yearly opening level), is also an area to be aware of.
USD/CHF:
For those who read Monday’s technical briefing, you may recall the piece underlined the following (italics):
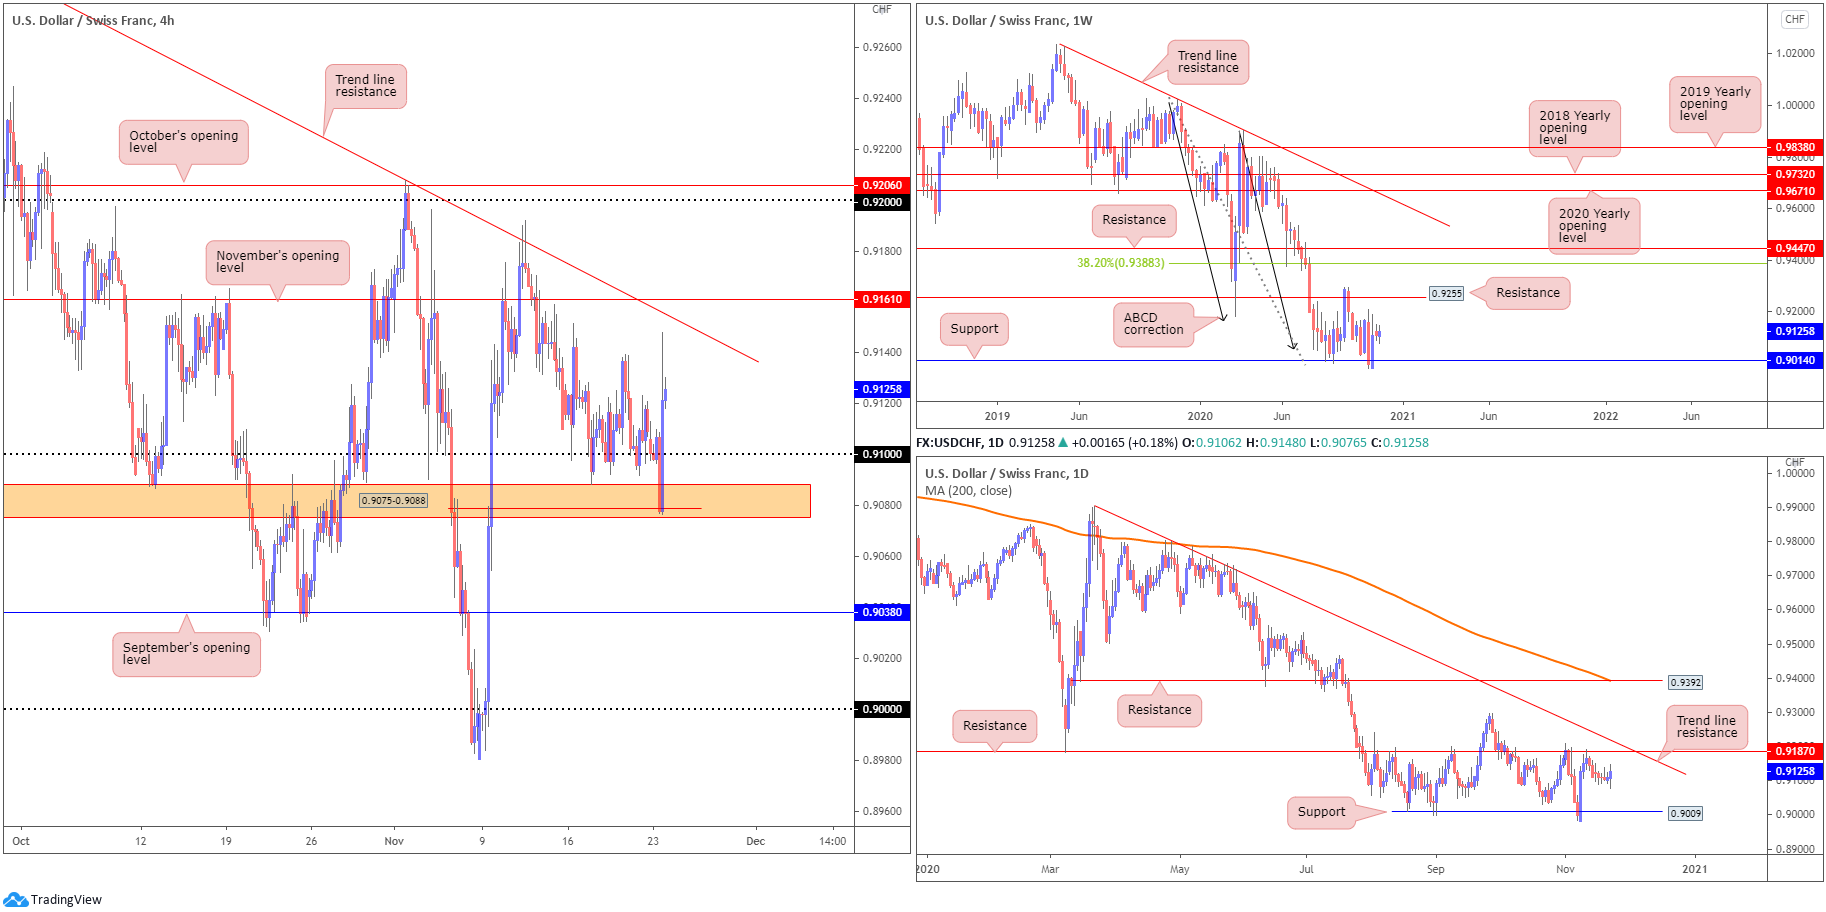
0.91/H4 support at 0.9075-0.9088 is an area buyers may continue to watch for bullish themes this week.
As can be seen from the H4 scale, price responded strongly from the 0.9075-0.9088 area on Monday, bolstered on robust US data (if you visit the H1 chart, the red line at 0.9079 marks a Quasimodo resistance-turned support). Trend line resistance, extended from the high 0.9295, and November’s opening value at 0.9161, are on show as possible resistance levels.
Action on the higher timeframes is pretty much unmoved, therefore here’s a reminder of where we left things ahead of Monday’s session:
Weekly timeframe:
The prior week witnessed buyers strongly rebound from support at 0.9014, a level dovetailing closely with ABCD support at 0.9051 (black arrows). Bid/offers, however, were even last week, finishing unmoved.
0.9255 resistance (a prior Quasimodo support) is next in the firing range should buyers support this market, with a 38.2% Fibonacci retracement ratio forged at 0.9388 to target should further buying emerge (an initial take-profit zone associated with the ABCD support mentioned above).
It should also be noted this market has been trending lower since April 2019.
Daily timeframe:
From the daily timeframe, price remains languishing south of resistance at 0.9187. While Quasimodo support at 0.9009 represents a possible downside objective on this chart, it’s worth acknowledging trend line resistance also resides close by, taken from the high 0.9901.
Areas of consideration:
- Room to discover higher levels on the bigger picture suggests H4 buyers out of 0.9075-0.9088 could see H4 trend line resistance and November’s opening value at 0.9161 enter play today/tomorrow.
- A retest at 0.91 on the H4, however, may play out prior to pushing higher, which could be interpreted as an area to either initiate fresh long positions or even pyramid current positions.
Dow Jones Industrial Average:
US equity benchmarks received a late lift Monday on news President-elect Joe Biden is to nominate Janet Yellen as Treasury secretary. The Dow Jones Industrial Average added 327.79 points, or 1.12%; the S&P 500 traded higher by 20.05 points, or 0.56%, and the Nasdaq ended higher by 25.66 points, or 0.22%.
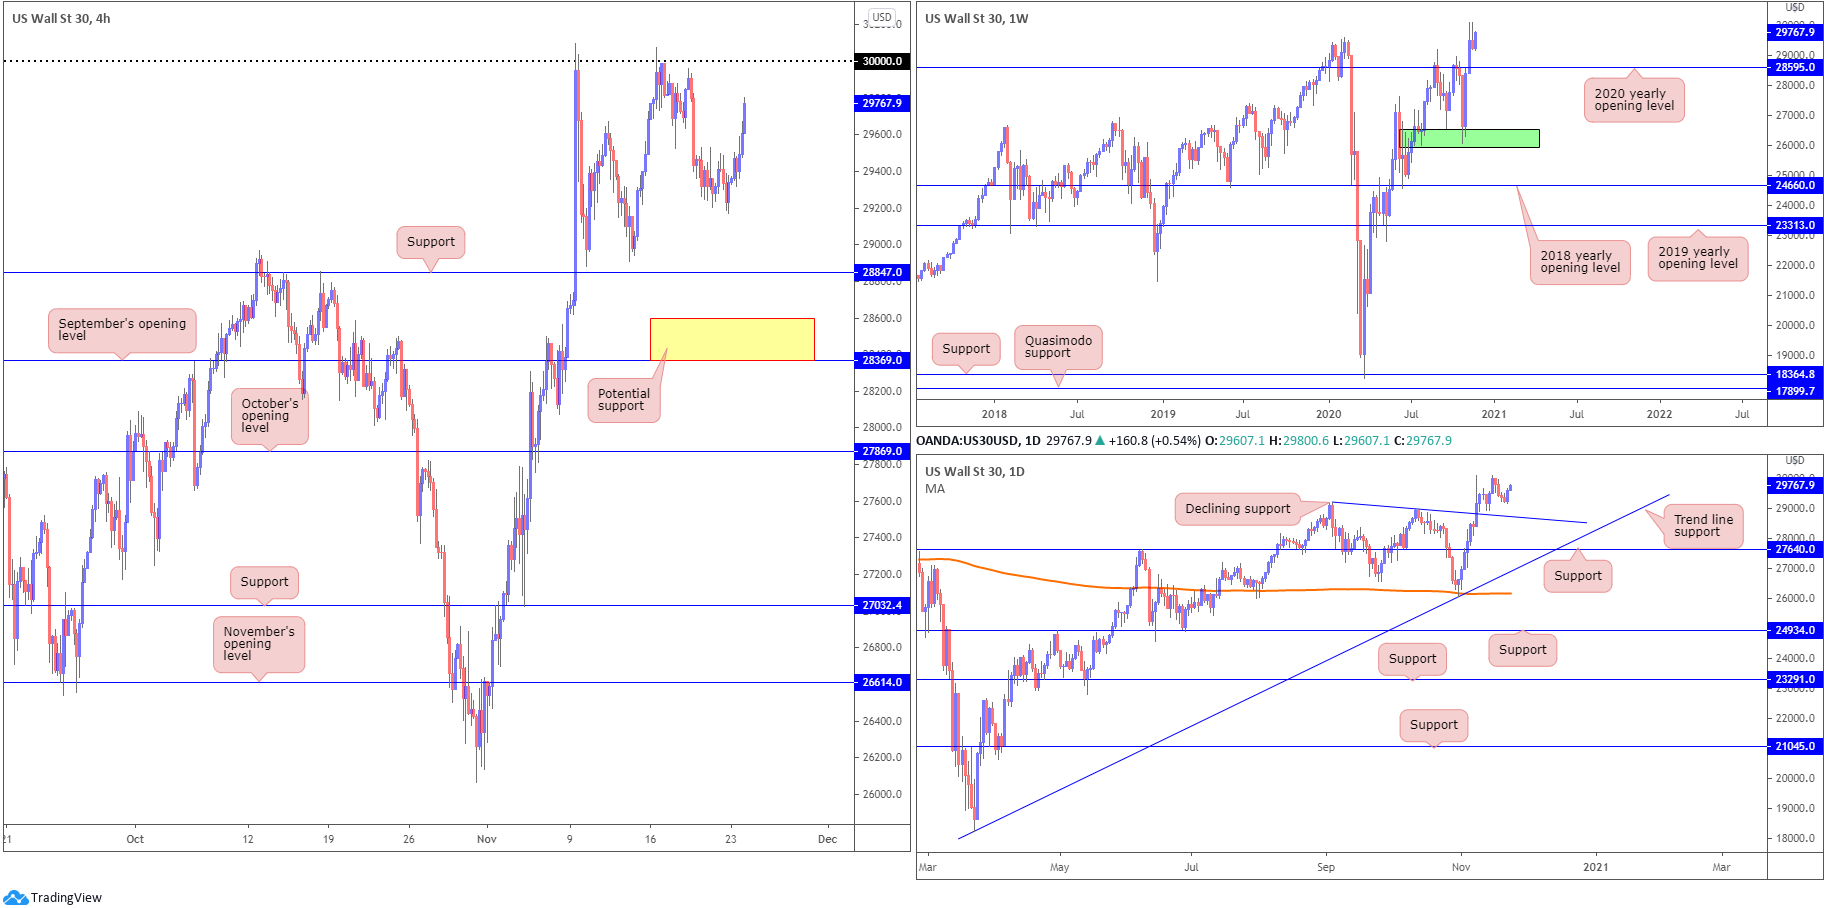
Technically on the H4 scale, the 30000 level represents resistance while swing lows at 29171 and 28908, along with the 28847 level, signifies support. A break lower also exposes September’s opening value at 28369.
The all-time peak at 30097 is a marked target on the weekly timeframe, as the Dow kicked off the week in fine form and is overlooking last week’s shooting star formation. A closer assessment of price action on the daily timeframe reveals the unit could confront declining support, taken from the high 29193, should sellers show a hand.
Areas of consideration:
- Breaking above 30000 will likely excite breakout buyers on the H4 scale. Conservative traders, however, may seek a retest at 30000 before committing.
- H4 support at 28847 is likely a watched level, as is September’s opening value at 28369 (alongside the 2020 yearly opening value from 28595 [weekly] and daily declining support at 29193 – yellow area on H4).
XAU/USD (GOLD):
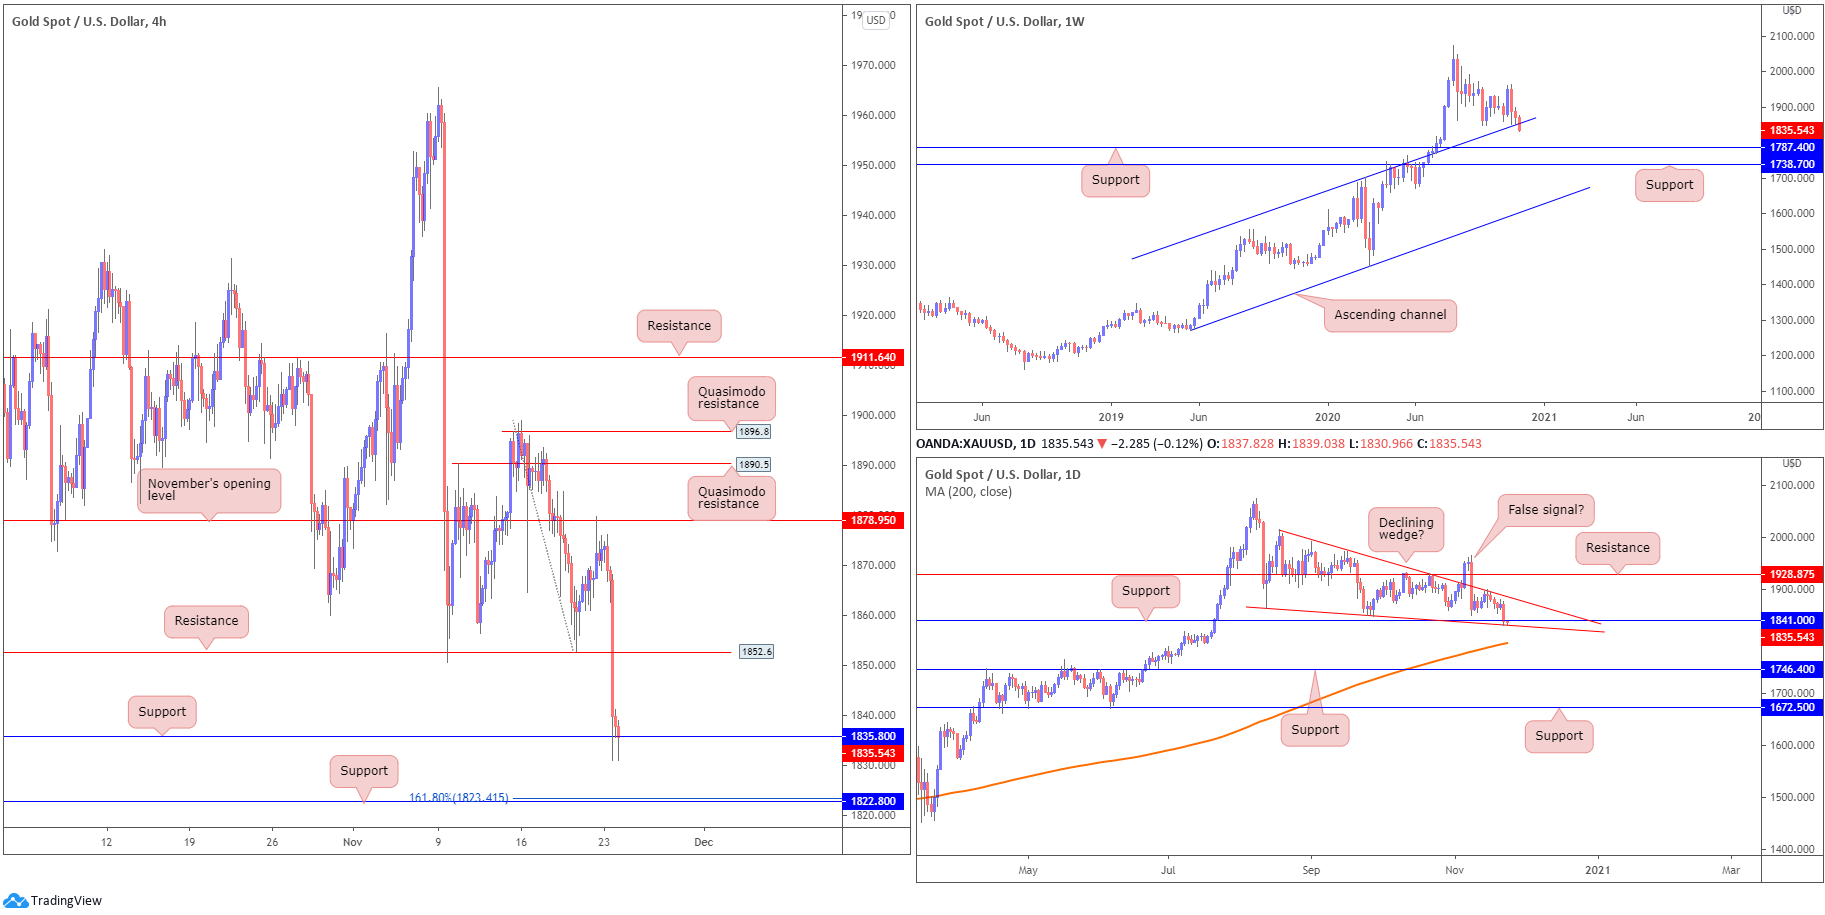
H4 support at $1,835 is under pressure in early Asia today, following Monday’s precipitous decline. This may lead to sellers dropping to deeper water and challenging H4 support at $1,822, which happens to converge with a 161.8% Fibonacci projection point at $1,823.
Further afield, the weekly timeframe reveals price dropped through channel resistance-turned support, taken from the high $1,703, and is perhaps on course to eventually shake hands with support at $1,787. Traders, however, may want to bear in mind the price of gold remains in a decisive uptrend.
A closer examination of price action on the daily timeframe also shows the yellow metal testing support at $1,841, which merges with the lower edge of a declining falling wedge pattern between $2,015/$1,862. Another prominent level worth noting on the daily chart is the 200-day SMA (orange – $1,796).
Areas of consideration:
- H4 support priced in at $1,835 is a level to be aware of, having seen the line merge closely with daily support at $1,841.
- H4 support at $1,822 and the 161.8% Fibonacci projection point at $1,823 offers moderate confluence.
The accuracy, completeness and timeliness of the information contained on this site cannot be guaranteed. IC Markets does not warranty, guarantee or make any representations, or assume any liability regarding financial results based on the use of the information in the site.
News, views, opinions, recommendations and other information obtained from sources outside of www.icmarkets.com.au, used in this site are believed to be reliable, but we cannot guarantee their accuracy or completeness. All such information is subject to change at any time without notice. IC Markets assumes no responsibility for the content of any linked site.
The fact that such links may exist does not indicate approval or endorsement of any material contained on any linked site. IC Markets is not liable for any harm caused by the transmission, through accessing the services or information on this site, of a computer virus, or other computer code or programming device that might be used to access, delete, damage, disable, disrupt or otherwise impede in any manner, the operation of the site or of any user’s software, hardware, data or property


