
EUR/USD:
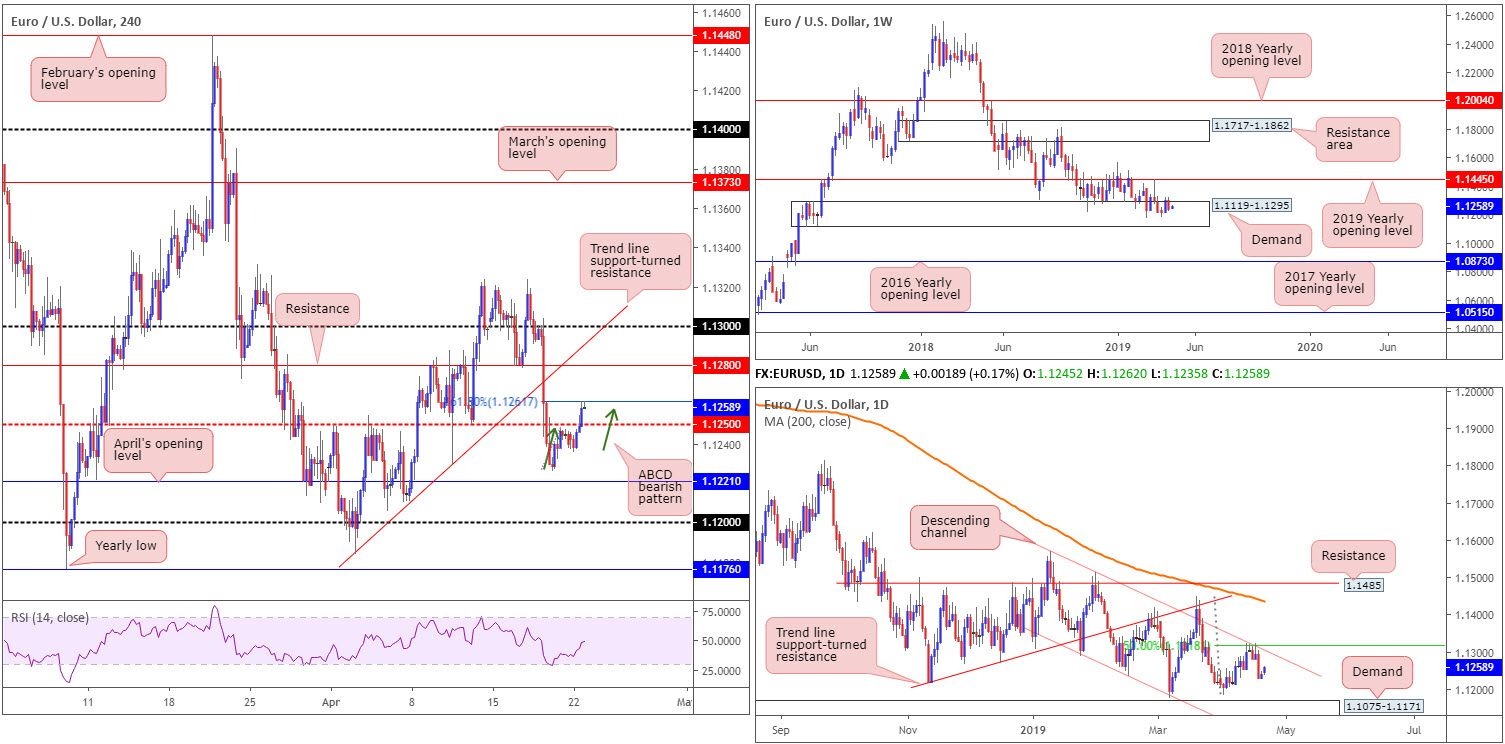
Among the top performers, the euro climbed higher vs. its US counterpart Tuesday amid holiday-thinned conditions. Up 0.17%, the euro-to-dollar pair, as evident from the H4 timeframe, dethroned the 1.1250 resistance and crossed swords with an ABCD (green arrows) 161.8% Fibonacci ext. point at 1.1261. As the markets creep into Asia, 1.1261 is holding ground and could force a retest of 1.1250 as support today. Continued buying, on the other hand, has resistance at 1.1280 to target, closely shadowed by 1.13 and a converging trend line support-turned resistance (extended from the low 1.1183).
On a broader perspective, buyers and sellers remain warring for position within the walls of a reasonably long-standing weekly demand area at 1.1119-1.1295. A break of the area to the downside has the 2016 yearly opening level at 1.0873 to target, whereas a recovery higher may call for a retest of the 2019 yearly opening level at 1.1445.
Counter to weekly demand, price action on the daily timeframe shook hands with channel resistance (extended from the high 1.1569) and a merging 50.0% resistance value at 1.1318 last week. Although the market could, theoretically, observe another retest of this channel resistance, the next downside points to have eyes on fall in around the 1.1183 Apr 2 low, shaded closely by demand at 1.1075-1.1171 (glued to the underside of the current weekly demand area).
Areas of consideration:
Short-term selling is likely in store from 1.1260ish on the H4 timeframe, at least until we reach 1.1250. Should the market push beyond this barrier, the next port of call, aside from last Thursday’s low at 1.1226, is April’s opening level at 1.1221. Trade this with caution, traders.
Higher-timeframe structure unfortunately provides little in terms of meaningful direction. Despite last week’s losses, weekly price still may recover out of its demand zone. This, nevertheless, is opposed by daily action displaying the possibility of further selling within its current descending channel.
Today’s data points: Limited.
GBP/USD:
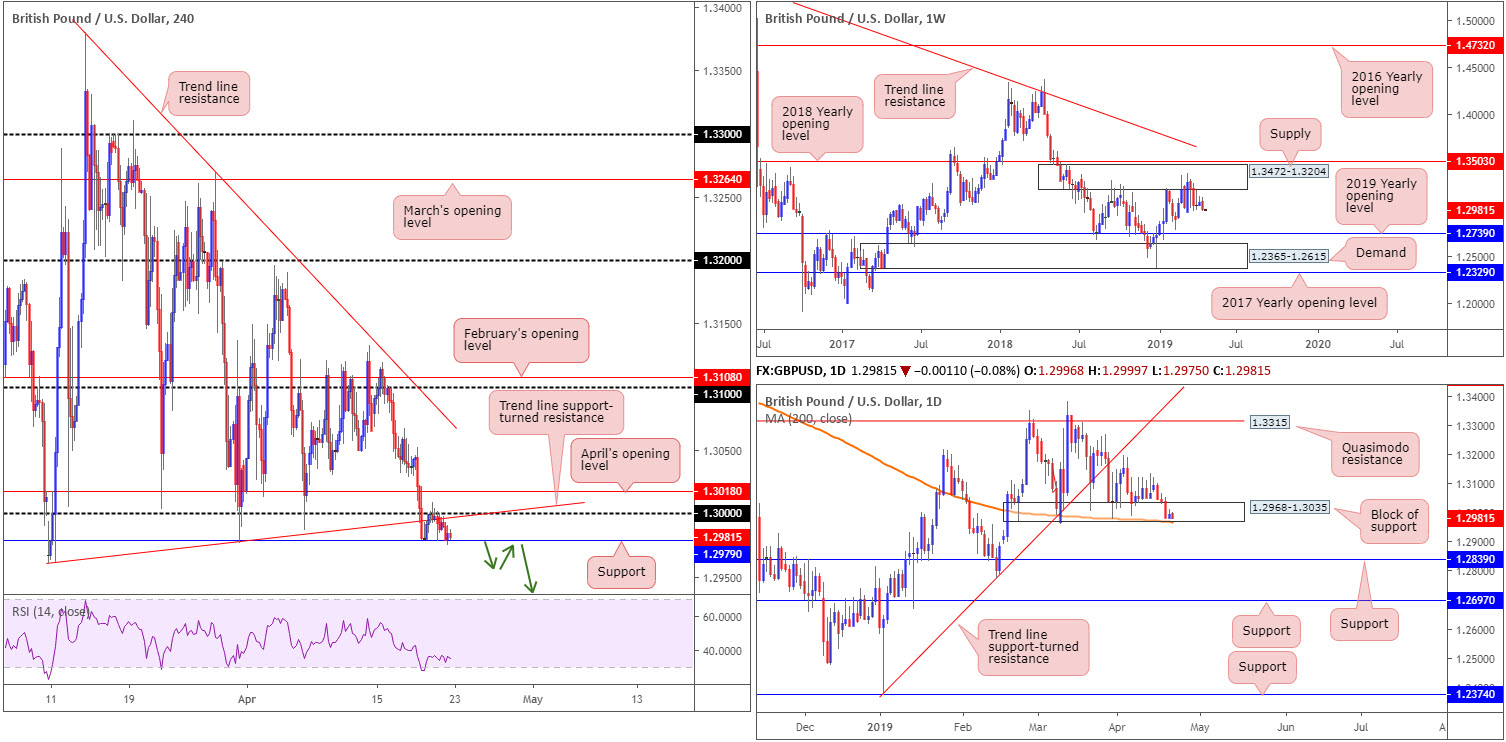
Outlook unchanged due to lacklustre movement.
With many European banks closed in observance of Easter Monday, GBP/USD movement was limited. With this being the case, much of today’s briefing will emulate Monday’s outlook.
Tuesday’s action traded almost lifeless on the H4 timeframe between support priced in at 1.2979 and key figure resistance 1.30 (along with merging trend line support-turned resistance [extended from the low 1.2960]). The odds of the H4 candles respecting the current support are low, according to our technical studies. Should we eventually press beneath 1.2979, the next downside target falls in at demand drawn from 1.2891-1.2926, which happens to house 1.29 within (not seen on the screen).
Higher-timeframe flows has weekly movement threatening lower prices, after spending nearly two months consolidating around the underside of supply at 1.3472-1.3204, situated a few points south of the 2018 yearly opening level at 1.3503. With the next obvious downside target not realised on this timeframe until the 2019 yearly opening level at 1.2739, followed by demand coming in at 1.2365-1.2615, sellers still have plenty of room to manoeuvre if they press lower.
Against the backdrop of weekly flow, daily activity remains teasing a block of support at 1.2968-1.3035, which, as you can see, also fuses with the 200-day SMA (orange). Buying from here, nevertheless, has dwindled over the past month, emphasising weakness each time the area has been tested (failed to print higher highs). In the event the current support zone fails, as weekly structure suggests, support coming in at 1.2839 is in sight, alongside another layer of support at 1.2697 (at this point we’ll be trading below the 2019 yearly opening level on the weekly timeframe).
Areas of consideration:
On account of the above, sellers still appear to have the upper hand. Should the analysis turn out correct and H4 action closes beneath its current support at 1.2979, a retest to the underside of this level as resistance (green arrows) could serve as an ideal platform for shorts today/early week, targeting the H4 demand highlighted above at 1.2891-1.2926.
Traders looking to add a little more confirmation to the mix from 1.2979 might look for a H4 bearish candlestick to form on the retest. Not only will this help confirm seller intent from this angle, it’d provide entry/risk levels to work with.
Today’s data points: Limited.
AUD/USD:
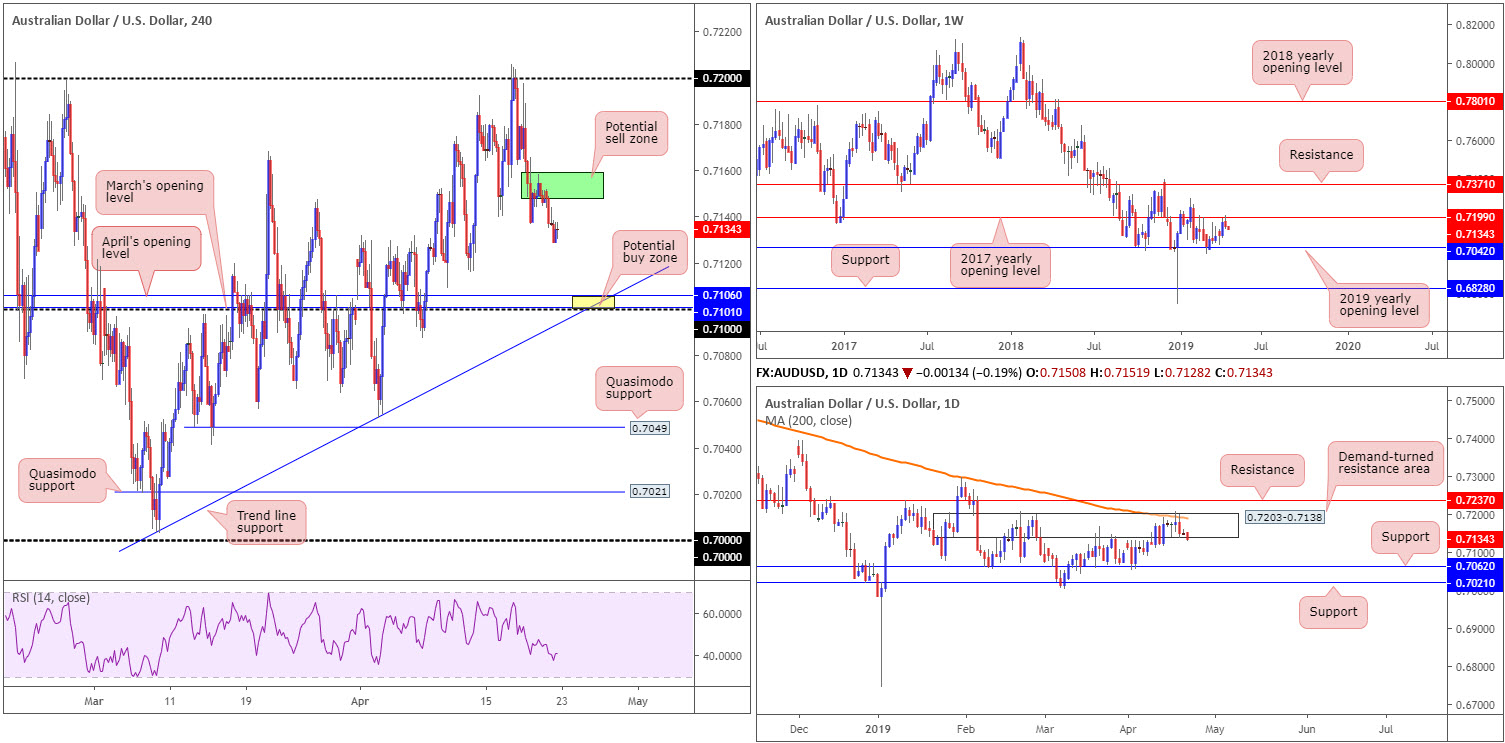
The Australian dollar kicked off the week on a negative footing, down 0.20% against the US dollar. Despite Easter Monday’s thin conditions and an absence of tier 1 data, some analysts state the recent slide was the result of a waning US equity market.
The key observation on the H4 timeframe is the 0.71 handle. Note this psychological number is closely associated with April and March’s opening levels at 0.7106/0.7101 and a trend line support (taken from the low 0.7003).
Things over on the weekly timeframe, nonetheless, show the candles have been carving out a consolidation between the 2017/2019 yearly opening levels at 0.7199/0.7042. As you can see, last week’s movement concluded fading the upper limit of this range, therefore the outlook on this scale potentially bodes well for sellers this week.
In conjunction with weekly flow, a daily demand-turned resistance zone at 0.7203-0.7138 is in motion, which happens to coincide with the 200-day SMA (orange), potentially setting the stage for a run in the direction of support priced in at 0.7062 this week, trailed closely by another film of support at 0.7021.
Areas of consideration:
A H4 bullish candlestick signal printed from 0.71 (entry/risk levels can be determined according to this structure) is, according to local confluence highlighted above (yellow), a high-probability support level. Waiting for additional candlestick confirmation is recommended owing to 0.71 housing limited higher-timeframe convergence. In fact, both the weekly and daily timeframes suggest a move beneath 0.71 could be on the cards.
As for selling, traders’ crosshairs may be fixed on the green area of local supply around 0.7158/0.7148. By and of itself, this supply zone is little to shout about, though combined with both weekly and daily activity portending a move lower, the supply could be an ideal platform for shorts, targeting 0.71 as an initial take-profit area.
Today’s data points: Limited.
USD/JPY:
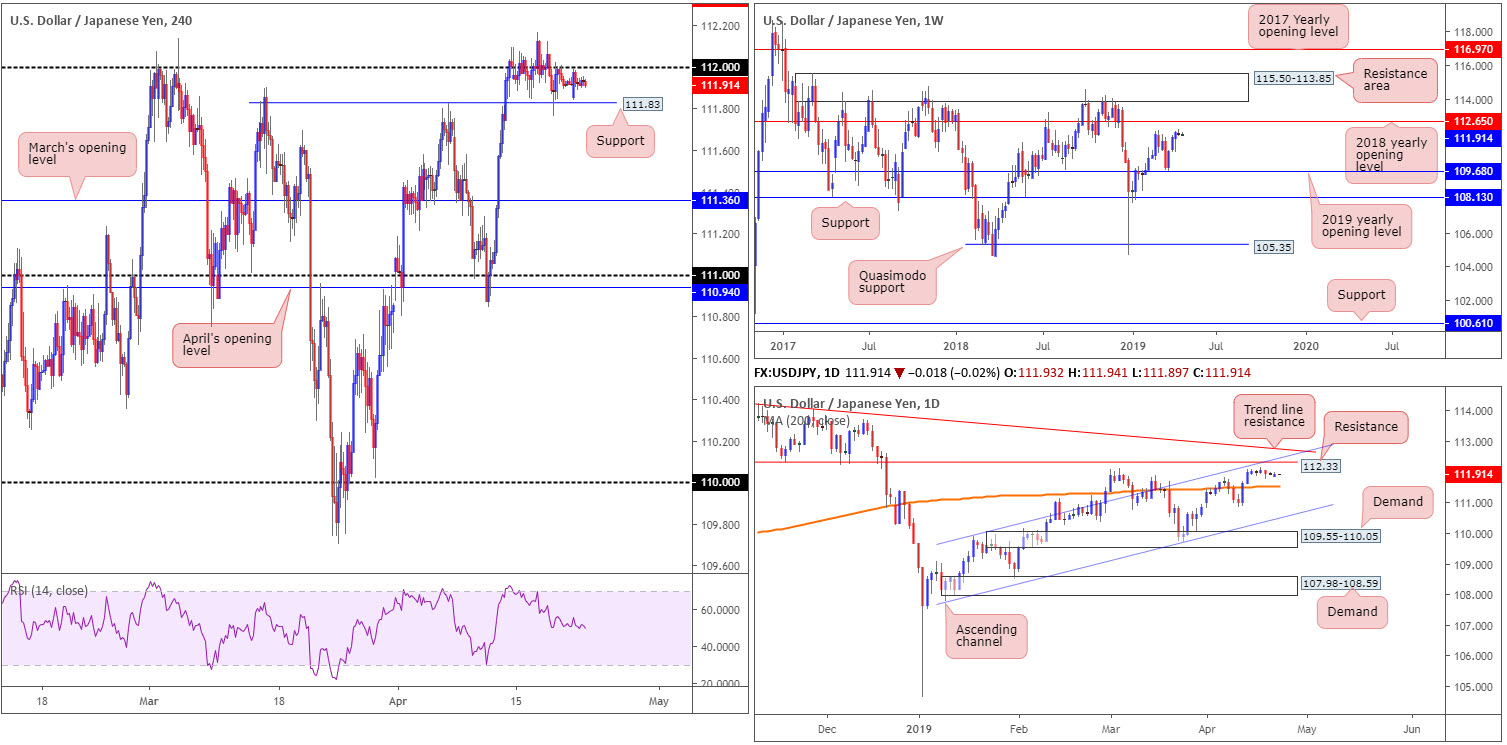
Outlook unchanged due to lacklustre movement.
USD/JPY was motionless amid Easter Monday trading, eking out a 16-point range on the day. In light of this, much of the following report will echo similar thoughts put forward in yesterday’s briefing.
According to H4 flow, price action spent Good Friday and Easter Monday narrowly flipping between gains/losses in the middle of 112 and support nearby at 111.83: a Quasimodo resistance-turned support. Above 112, traders’ crosshairs are likely fixed on daily resistance coming in at 112.33 (not visible on the H4 timeframe), whereas beneath 111.83, there’s little stopping the unit from reaching March’s opening level at 111.36.
Price action on the weekly timeframe has the candles facing the March 4 high at 112.13, shadowed closely by the 2018 yearly opening level priced in at 112.65. Crossing over to daily structure, the research team notes the 112.33 resistance level, which happens to fuse with a channel resistance (drawn from the high 109.88), and a nearby trend line resistance (etched from the high 114.54). To the downside, the 200-day SMA (orange) is in sight.
Areas of consideration:
Daily resistance at 112.33 appears a prime location for shorts in this market, according to our technical reading, with stop-loss orders plotted beyond the daily trend line resistance highlighted above. The only caveat to this, aside from a reasonably strong trending market at the moment (clearly visible on the daily timeframe above the 200-day MA), is weekly price threatening to press as far north as 112.65. For that reason, before pulling the trigger on a sell from 112.33, traders are recommended to wait for additional confirmation. This could be anything from a moving average crossover, a H4 bearish candlestick signal or even drilling down to the lower timeframes and trading local structure.
Today’s data points: Limited.
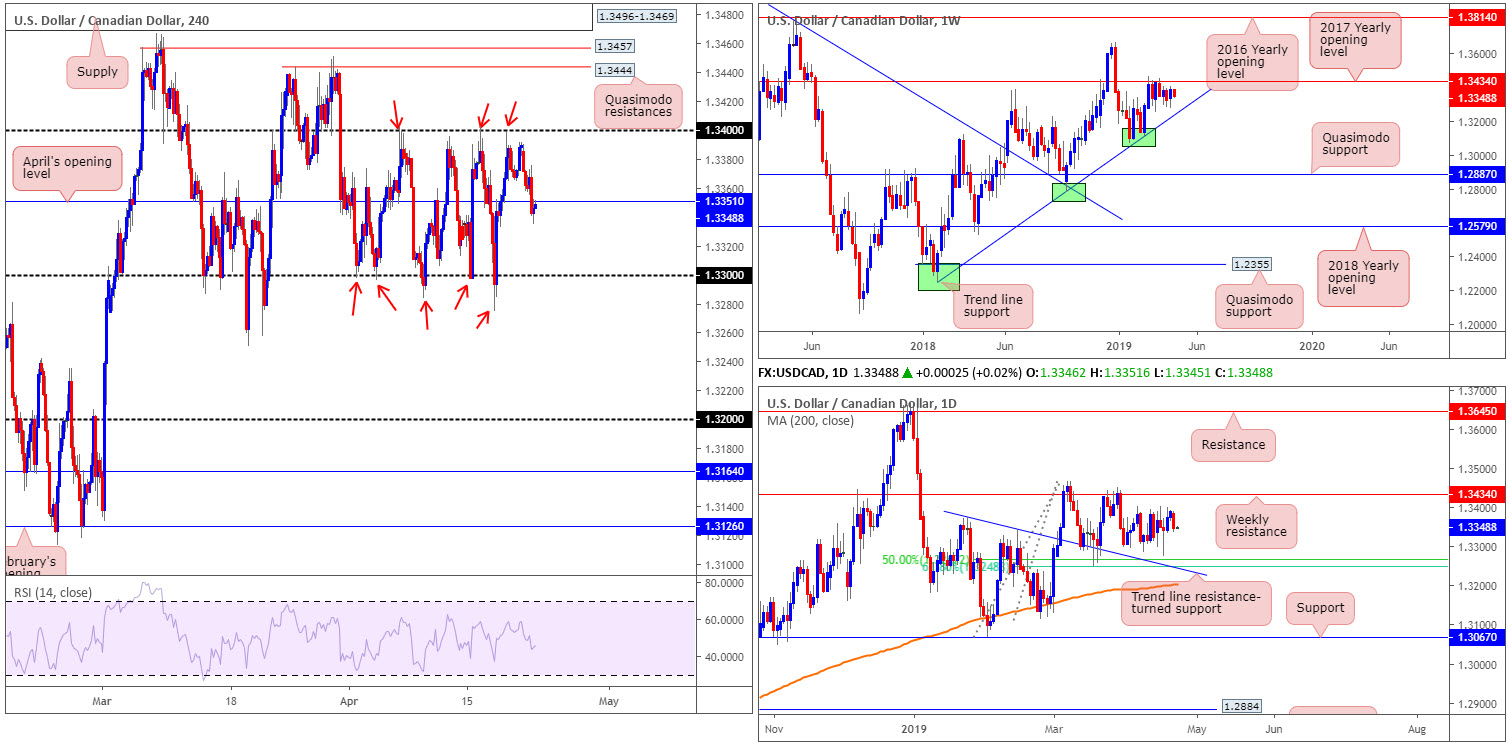
USD/CAD:
WTI traded at fresh year-to-date highs as the US announced it will not renew waivers that allowed eight countries (China, Greece, India, Italy, Japan, South Korea, Taiwan and Turkey) to continue buying Iranian crude without incurring sanctions. Demand for the Canadian dollar increased as a result of this, subsequently weighing on the USD/CAD pair, down 0.32% on the day.
Technically speaking, however, the market remains unchanged. The H4 candles remain entrenched within a 100-point range between 1.34 and 1.33 (red arrows), though it is worth pointing out April’s opening level at 1.3351 is plotted within the walls of the said consolidation.
Against the backdrop of medium-term flows, daily action’s focus is between weekly resistance at 1.3434: the 2017 yearly opening level, and a 50.0% support seen at 1.3267. Note this barrier also happens to merge closely with a 61.8% Fibonacci support at 1.3248 and a trend line resistance-turned support (extended from the high 1.3375). It might also be worth noting a weekly trend line support (etched from the low 1.2247) merges with the aforementioned daily supports.
Areas of consideration:
Trading the outer limits of the H4 range and targeting the opposing edge remains an option going forward. The problem with range trading, though, is the threat of price action printing a fakeout beyond range extremes, in this case, to either weekly resistance at 1.3434 or 1.3267: the daily 50.0% support. Therefore, it might be worth waiting and seeing if H4 action chalks up a notable candlestick signal before pulling the trigger. Not only will this help avoid being taken out on a fakeout, it’d provide strict entry and risk levels.
Today’s data points: Limited.
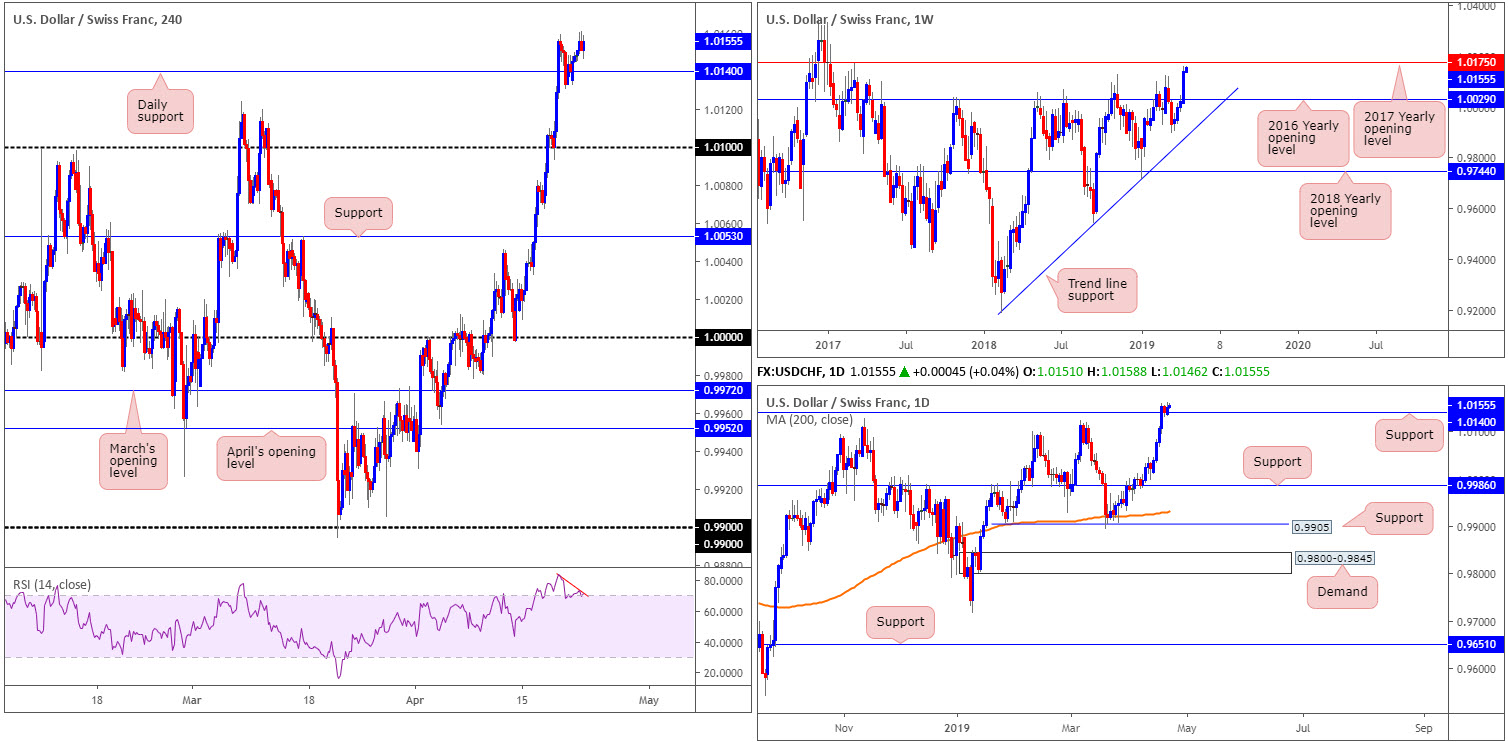
USD/CHF:
Easter Monday saw the USD/CHF gain traction, recording a 0.11% gain and reaching fresh 2019 yearly highs of 1.0160. Despite recent buying, the research team notes hefty weekly resistance resting around the 1.0175 neighbourhood: the 2017 yearly opening level. As you can see, this level helped cap upside in early March of 2017, therefore history may repeat itself here.
The trend, according to the 200-day SMA (orange) on the daily timeframe, remains northbound. In conjunction with this, price action retested a resistance-turned support at 1.0140 (a previous Quasimodo resistance) and is currently holding firm. Although this is considered a strong bullish market, overlooking the 1.0175 resistance on the weekly timeframe may be a mistake.
A closer reading of price action on the H4 timeframe shows the RSI indicator is currently displaying a negative divergence reading out of overbought territory (red line). The daily support mentioned above at 1.0140 is also prime support on the H4 timeframe. The next upside target on the H4, nevertheless, falls in around a Quasimodo resistance drawn from early Jan 2017 at 1.0197.
Areas of consideration:
Aside from the H4 RSI suggesting the current uptrend may be fading, price action on all three timeframes indicate further buying is in store, at least until reaching the weekly resistance highlighted above at 1.0175. An ideal scenario, therefore, would be for the H4 candles to retest the current daily support in the shape of a bullish candlestick signal – think Hammer/Pin-bar formation or Engulfing pattern (entry and risk parameters can be determined according to this formation).
Today’s data points: Limited.
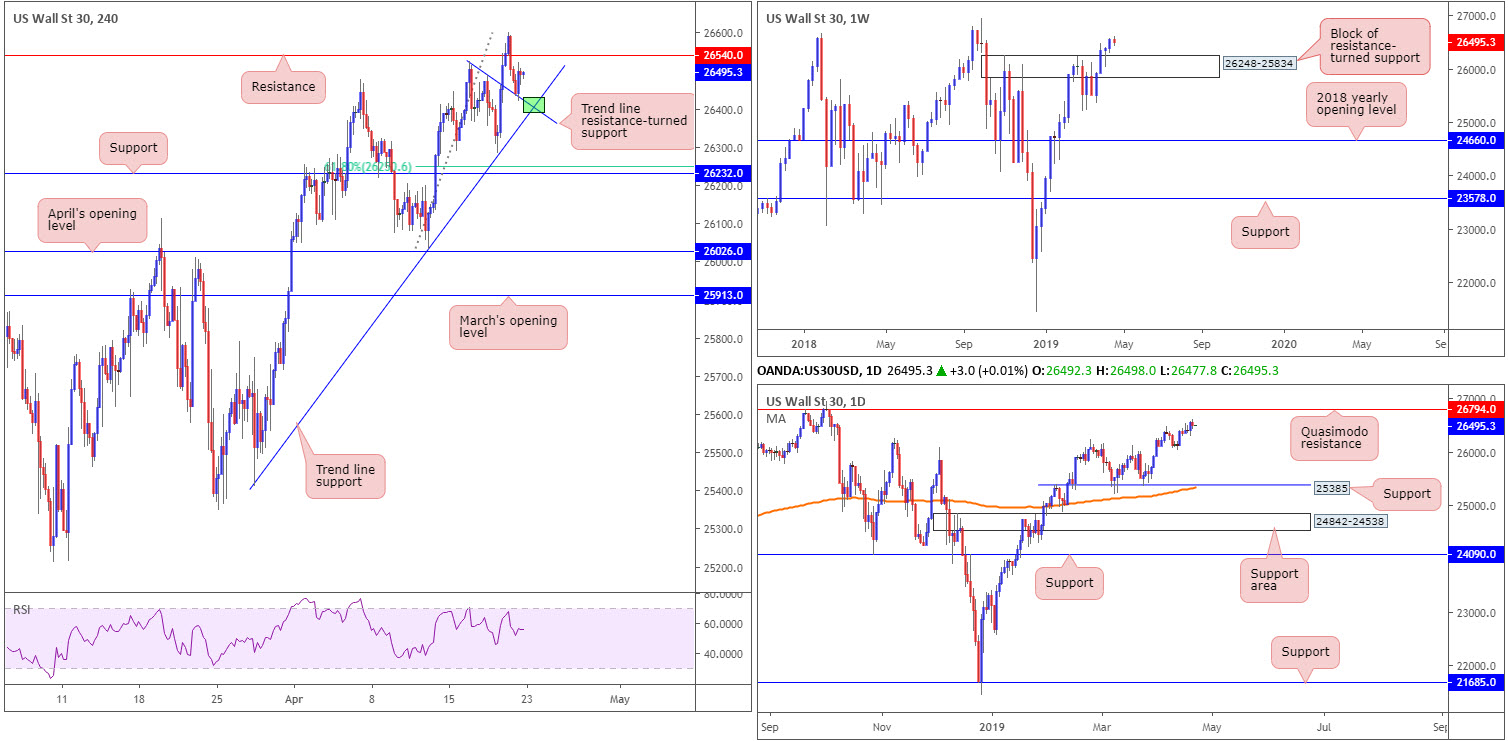
Dow Jones Industrial Average:
US stocks, according to the Dow Jones Industrial Average, traded lower in light volume Monday as investors prepared for a deluge of earnings news. The S&P 500 and Nasdaq 100, nevertheless, ended the day in positive territory, up 0.10% and 0.31%, respectively.
This, according to weekly structure respecting 26248-25834 (a block of resistance-turned support), has the 2018 high at 26939 in sight. Meanwhile, daily flow is poised to test a nearby Quasimodo resistance at 26974. Note the index is firmly positioned above its 200-day SMA (orange).
A closer reading of the H4 timeframe demonstrates the candles, in early Asia Monday, retreated and reclaimed support at 26540 to the downside, which is now an acting resistance level once more. Another key thing to note on the H4 scale is the retest of a local trend line resistance-turned support (taken from the high 26525), and nearby trend line support (etched from the low 25410).
Areas of consideration:
The green area on the H4 chart – the point the two said trend line supports merge – is, given the room to move higher on the bigger picture, a nice-looking buy zone to consider today. Entry from this angle has an initial target set at H4 resistance 26540. A break above here and we’re likely running towards Quasimodo resistance mentioned above on the daily timeframe at 26794.
Aggressive traders may opt to simply set a buy limit at around 26400 with an adequate stop to cover volatility. Conservative traders, nevertheless, might wait for H4 candlestick confirmation and enter based off the pattern’s structure.
Today’s data points: Limited.
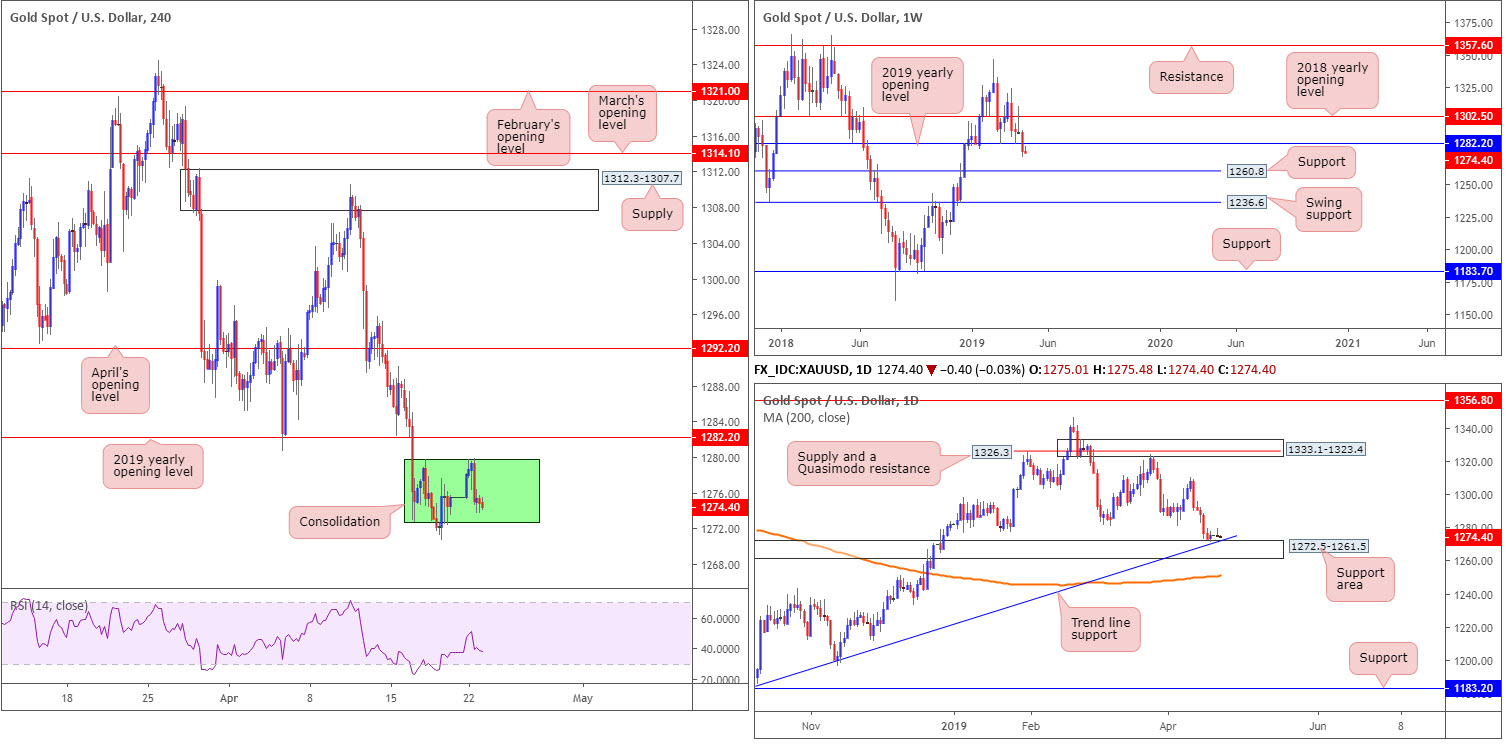
XAU/USD (GOLD):
Bullion was all but unchanged amid holiday-thinned volume Monday, down 0.06%. Since April 16, the H4 candles have been carving out a consolidation (green) between 1279.8/1272.6. Overhead, traders may want to acknowledge the 2019 yearly opening level at 1282.2, whereas lower down support at 1264.0, along with a Quasimodo resistance-turned support at 1260.8, is seen (not visible on the screen).
Interestingly, though, higher-timeframe flows have weekly candles trading sub 1282.2: the 2019 yearly opening level mentioned above, potentially setting the stage for a run towards support plotted at 1260.8. While weekly flow supports further selling, daily structure shows a support area in sight at 1272.5-1261.5, which happens to merge with a trend line support (etched from the low 1160.3). Given its confluence, this base is likely to hold active buyers within.
Areas of consideration:
The current H4 range (green) could, owing to weekly and daily charts offering conflicting views, breakout either way. According to the research team, it might be prudent to wait and see which way the H4 range breaks before taking action. This could signal potential direction, and possibly open up the option of a trade.
The accuracy, completeness and timeliness of the information contained on this site cannot be guaranteed. IC Markets does not warranty, guarantee or make any representations, or assume any liability with regard to financial results based on the use of the information in the site.
News, views, opinions, recommendations and other information obtained from sources outside of www.icmarkets.com.au, used in this site are believed to be reliable, but we cannot guarantee their accuracy or completeness. All such information is subject to change at any time without notice. IC Markets assumes no responsibility for the content of any linked site. The fact that such links may exist does not indicate approval or endorsement of any material contained on any linked site.
IC Markets is not liable for any harm caused by the transmission, through accessing the services or information on this site, of a computer virus, or other computer code or programming device that might be used to access, delete, damage, disable, disrupt or otherwise impede in any manner, the operation of the site or of any user’s software, hardware, data or property.


