
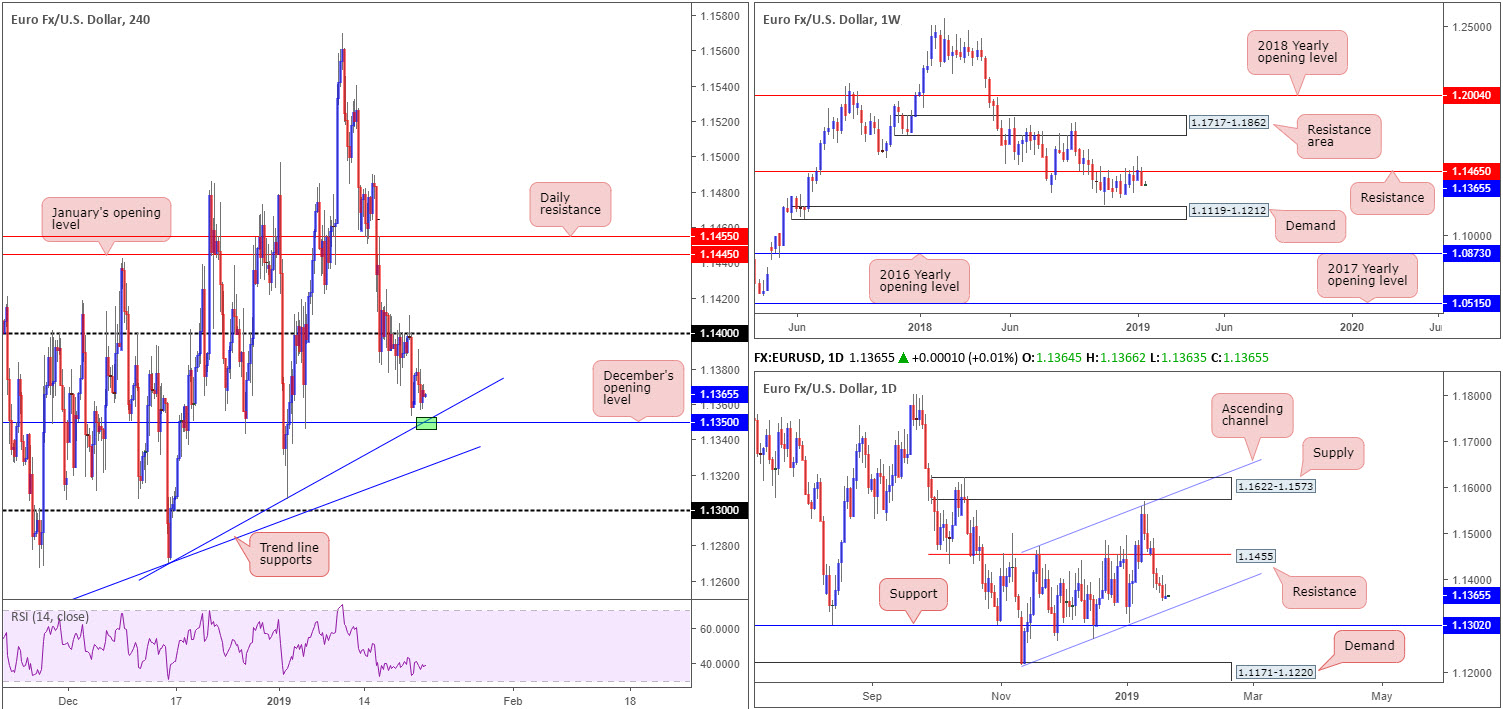
EUR/USD:
The lack of macroeconomic data coupled with US banks closing in observance of Martin Luther King Day kept trading volume light Monday.
The H4 candles entered into a phase of recovery in the earlier stages of the day just north of December’s opening level at 1.1350 (which happens to merge nicely with a trend line support extended from the low 1.1269), though failed to sustain gains past 1.1390ish before subsiding to the day’s opening levels.
On a wider perspective, weekly resistance at 1.1465 remains defensive, therefore opening up the possibility of further selling towards weekly demand at 1.1119-1.1212. In conjunction with weekly flow, daily action displays room to press south towards a nearby ascending channel support (etched from the low 1.1216), followed closely by support plotted at 1.1302.
Areas of consideration:
Although there is a healthy chance the H4 candles will likely respond from December’s opening level at 1.1350 today, particularly at the point marked in green where the aforementioned H4 trend line support merges, the research team are wary due to the bigger picture suggesting lower prices could be in store.
The current daily ascending channel support will, should the pair continue exploring lower prices today, likely enter the fold around 1.1338ish. For traders considering longs off 1.1350 today, the possibility of a fakeout through this level to 1.1338, therefore, is strong before buyers make an appearance.
Today’s data points: German ZEW Economic Sentiment.
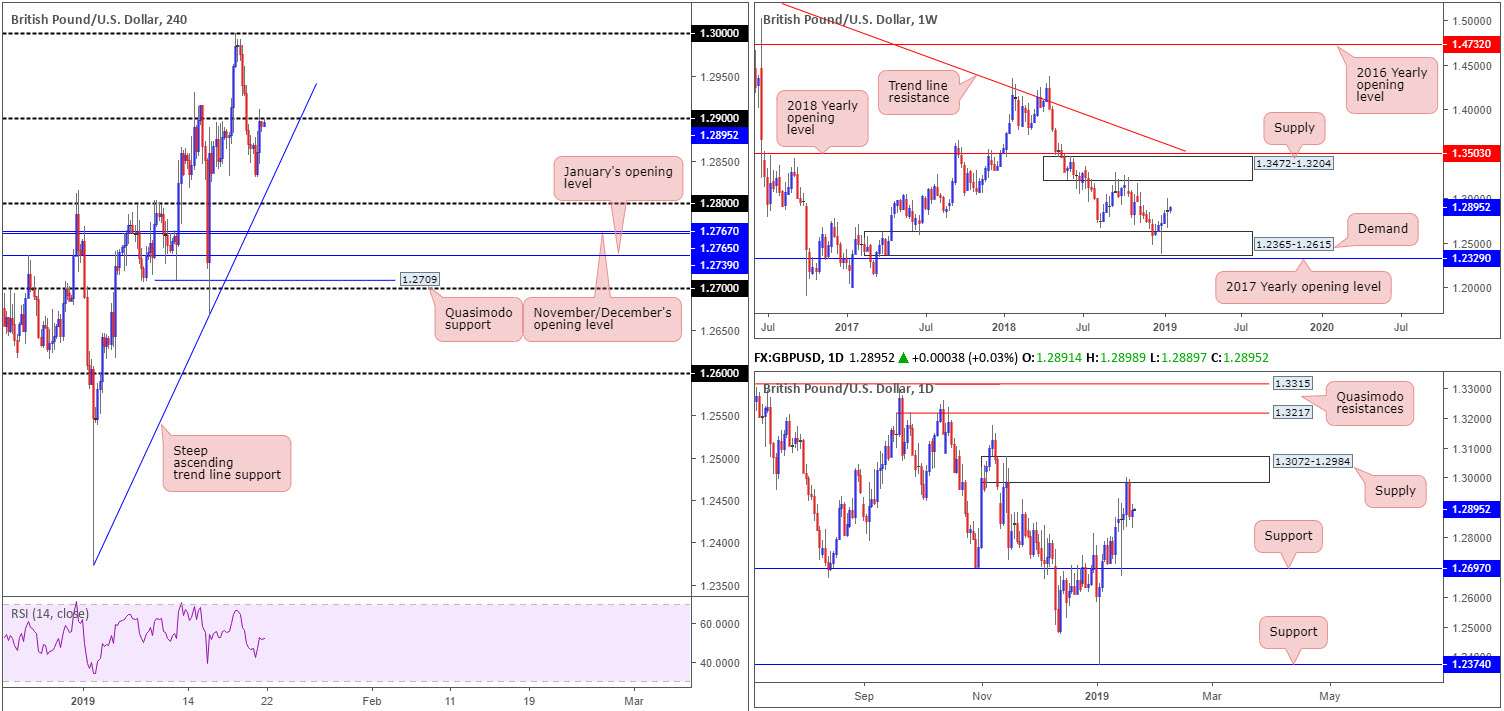
GBP/USD:
Cable remained within an intraday range of 1.2830-2910 Monday as PM May’s statement failed to provide anything substantially new in addressing The House of Commons. Sterling displayed initial weakness following the PM announcing the EU is unlikely to extend Article 50 without the UK having a plan settled. Despite this, the pound pushed towards the top end of its range at the closing stages of the day, around 1.29, after PM May stressed the only way to rule out a no deal is to find an agreement.
Technically, 1.29 is visibly holding ground as resistance at the time of writing. Continued rejection from this number will likely draw in sellers towards yesterday’s low, shadowed closely by a steep ascending trend line support (taken from the low 1.2373). A push through orders at 1.29, however, may call for a move north towards the key figure 1.30.
Higher up on the curve, nevertheless, we have weekly players trading reasonably firm north of demand at 1.2365-1.2615, with a run towards supply at 1.3472-1.3204 still in the mix as a possibility. A closer reading on the daily timeframe witnessed daily movement recently recede lower from supply at 1.3072-1.2984. From this timeframe, the research team sees little in terms of support until shaking hands with 1.2697.
Areas of consideration:
Technical signals on the bigger picture, as you can probably see, are mixed. Weekly flow portends further buying may be on the cards, while daily sellers are defending nearby supply.
Should the market observe a firm H4 close north of 1.29 today, however, that is followed up with a retest as support in the shape of a bullish candlestick formation (preferably at the point the steep ascending trend line support merges – entry/stop parameters can be defined according to this pattern), a long could be something to consider, targeting the lower edge of daily supply priced in at 1.2984. Though this would, technically speaking, be going up against daily flow out of its current supply, we do have to take into account weekly activity shows room to extend northbound.
Today’s data points: UK Average Earnings Index 3m/y, Public Sector Net Borrowing and Unemployment Rate.
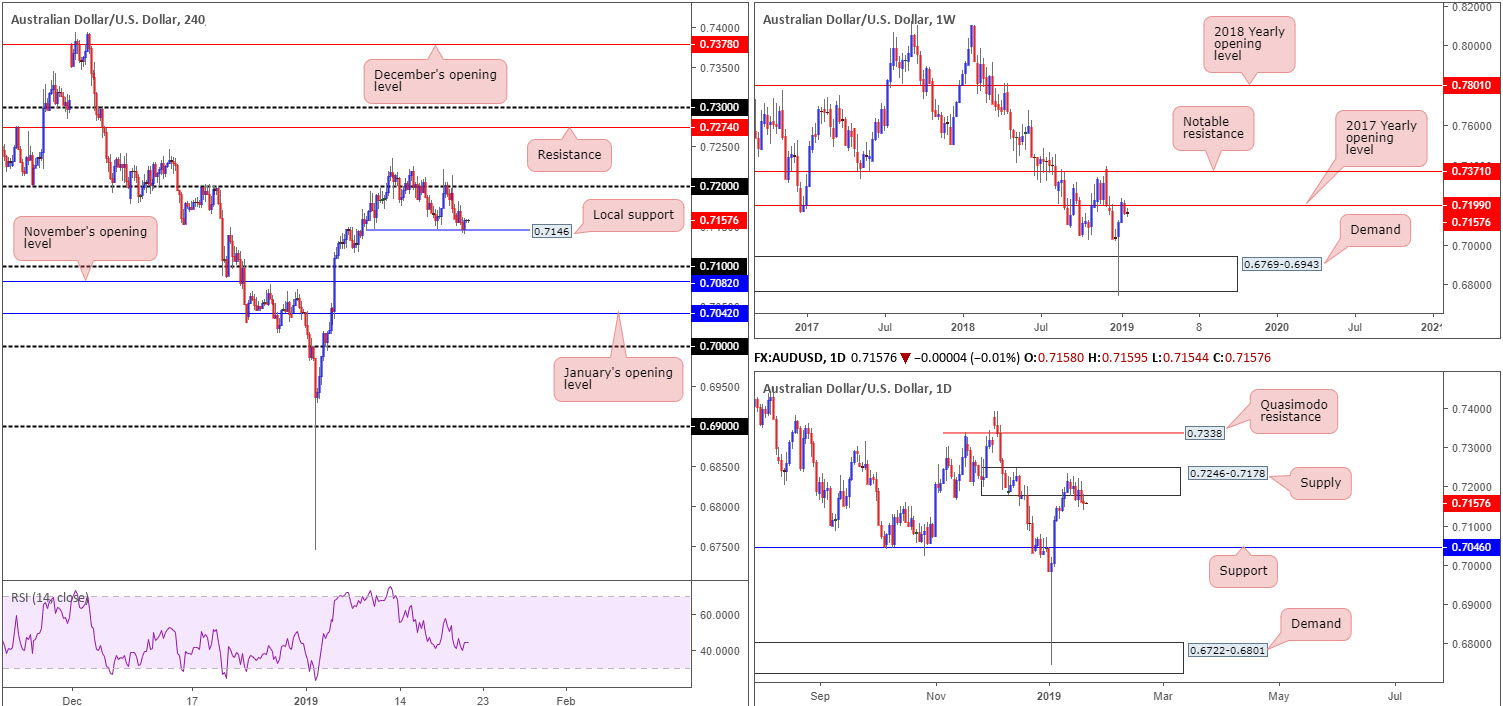
AUD/USD:
Although the commodity-driven Australian dollar pared intraday losses off local H4 support at 0.7146 Monday, the overall picture in this market echoes a bearish stance, according to our technical drawings.
From the top of the pile, we can see weekly flow engaging with its 2017 yearly opening level at 0.7199 after experiencing a marginal breach to the upside a few weeks back. Further selling from here has demand plotted at 0.6769-0.6943 to target. Alongside weekly structure, daily flow is seen shielding supply posted at 0.7246-0.7178. In addition to this, candlestick structure emphasizes more of a bearish presence here at the moment, with the next port of call from this area visible at support drawn from 0.7046.
Areas of consideration:
Overall, we do not expect the local H4 support highlighted above at 0.7146 to hold ground. Overhead resistance lingering on the higher timeframes is likely to be too much for buyers to handle. This leaves 0.71 as viable support on the H4 scale, followed closely by November’s opening level at 0.7082.
Given the above, an intraday sell on the break of 0.7146 is an option today, targeting 0.71/0.7082. The research team also notes possible buying opportunities around January’s opening level at 0.7042 on the H4 scale. This number, as you can probably see, merges nicely with support at 0.7046 on the daily timeframe, though do keep in mind there is the possibility of further selling beyond 0.7045 towards weekly demand at 0.6769-0.6943.
Today’s data points: Limited.
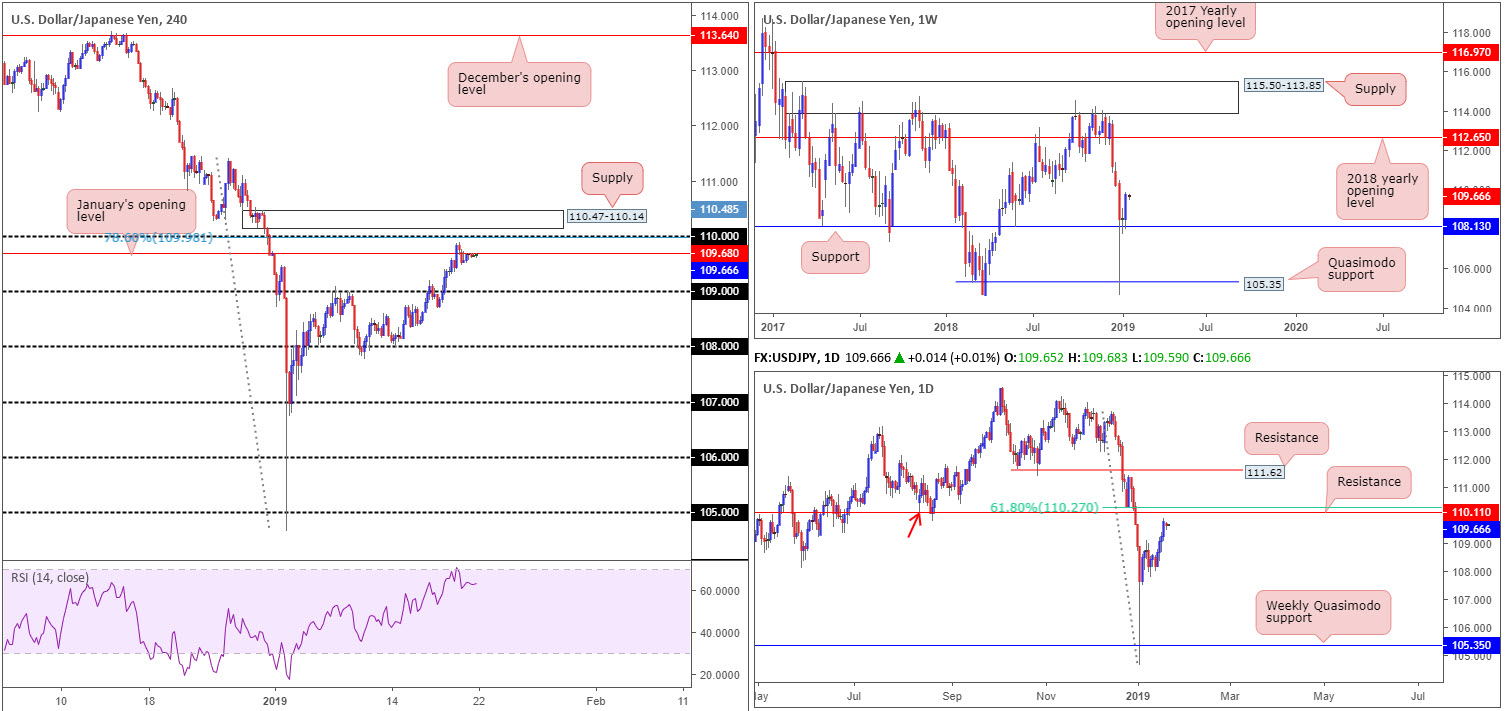
USD/JPY:
Using a top-down approach this morning, the technical picture on the weekly timeframe visibly emphasises a bullish tone. Buyers recently found a floor off support priced in at 108.13, with potential, according to overhead structure, of further buying as far north as the 2018 yearly opening level at 112.65.
Contrary to weekly levels, daily price action is hovering just south of resistance coming in at 110.10 that’s trailed closely by a 61.8% Fibonacci resistance value at 110.27. 110.10 is actually a Quasimodo support-turned resistance. These levels tend to, at the very least, bounce price.
A closer look at price action on the H4 timeframe draws in January’s opening level at 109.68, positioned just ahead of the 110 handle and a 78.6% Fibonacci resistance value at 109.98. Another interesting area to be aware of is supply printed at 110.47-110.14. This area is effectively the ‘decision point’ to wash through orders at 110, and is, therefore, worthy of attention. It might also interest some traders to note the RSI indicator is hovering nearby its overbought value.
Areas of consideration:
While weekly price is eyeing higher levels, a bounce from the H4 supply mentioned above at 110.47-110.14 is highly likely.
Round numbers tend to carry vast amounts of orders, and by extension, stop-loss orders. Stops are usually placed 10-20 pips above/below these psychological boundaries. A push above 110 will not only trip these stop-loss orders, which, when filled, will become buy orders to sell in to, breakout buyers will also likely attempt to join the movement. This, coupled with daily resistance seen plotted at 110.10, is likely enough to draw in attention and bring price action lower.
Traders who feel the need to trade based on candle confirmation, waiting for a bearish formation to materialize from the noted H4 supply will certainly add weight to a possible rotation lower. Traders who believe the H4 supply and daily resistance is enough evidence to draw sellers’ attention will likely enter short at 110.14 with stop-loss orders planted just north of 110.47.
Once, or indeed if, the H4 candles reclaim 109.68 to the downside out of 110.47-110.14, traders can then think about reducing risk to breakeven and taking partial profits off the table.
Today’s data points: Limited.
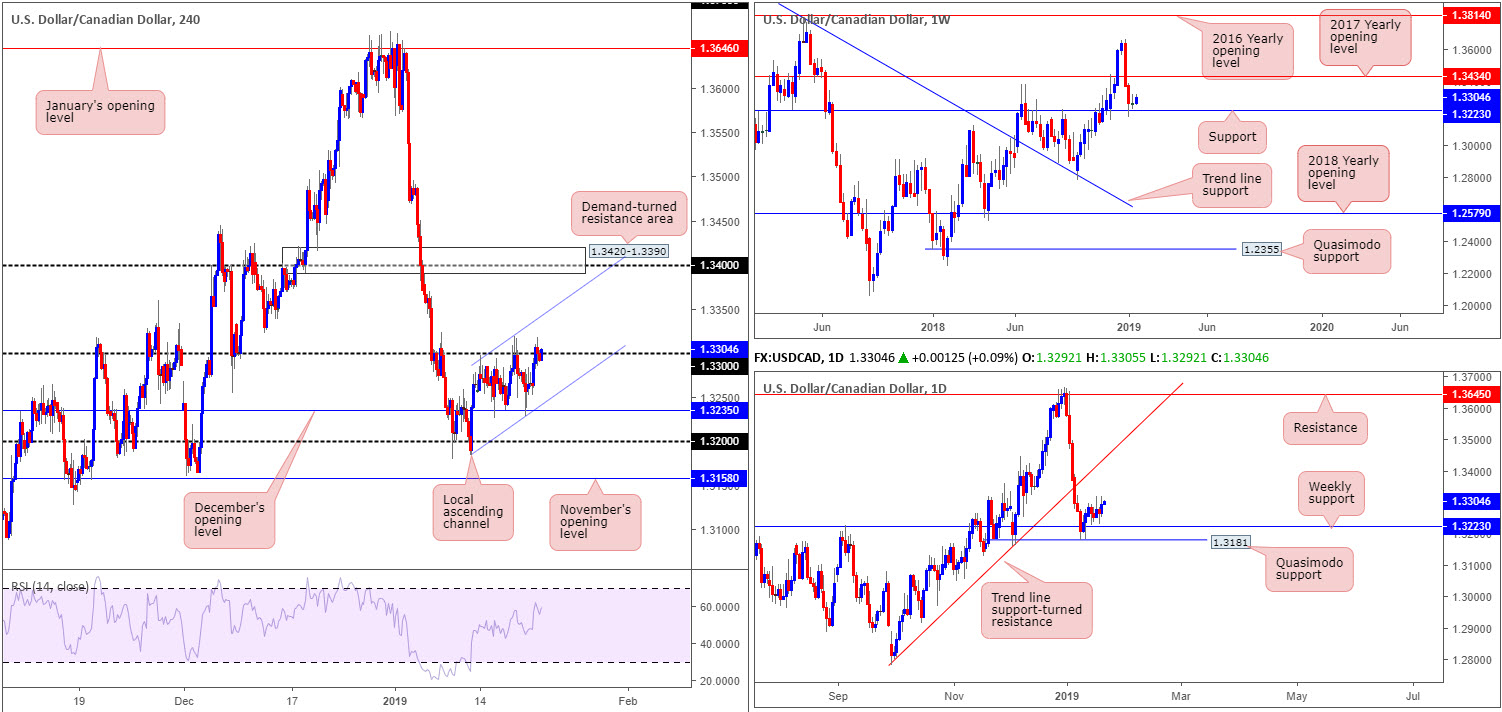
USD/CAD:
Since Jan 11, the H4 candles have been compressing within an ascending channel formation (1.3183/1.3318). What’s also technically noticeable is the 1.33 handle providing resistance on a number of occasions since price action overthrew the level early January, and December’s opening level at 1.3235 offering support.
A decisive violation of 1.33 as resistance today will likely bring the candles towards the noted channel resistance.
1.33, according to our technical studies, is a fragile number.
For weekly traders, support at 1.3223 is currently offering a floor to base potential longs from. The next upside objective from this point falls in at 1.3434: the 2017 yearly opening level. Closer analysis on the daily timeframe reveals the unit shook hands with a daily Quasimodo support at 1.3181 in recent trade. This level, as you can see, is situated just south of the current weekly support level. As long as the buyers continue to defend the said supports, the next port of call to the upside from here falls in around trend line support-turned resistance (extended from the low 1.2782).
Areas of consideration:
Although both weekly and daily structure suggest buyers govern movement at the moment, entering long on the H4 timeframe is difficult beneath 1.33. With this in mind, the research team feels waiting for a H4 close to form above 1.33 could be the way forward for buyers. This, preferably coupled with a retest as support, would not only confirm bullish intent on the bigger picture, it’d also clear upside on the H4 scale towards the noted channel resistance, and eventually maybe even 1.34 which aligns nicely with a demand-turned resistance area plotted at 1.3420-1.3390.
Today’s data points: Canadian Manufacturing Sales m/m.
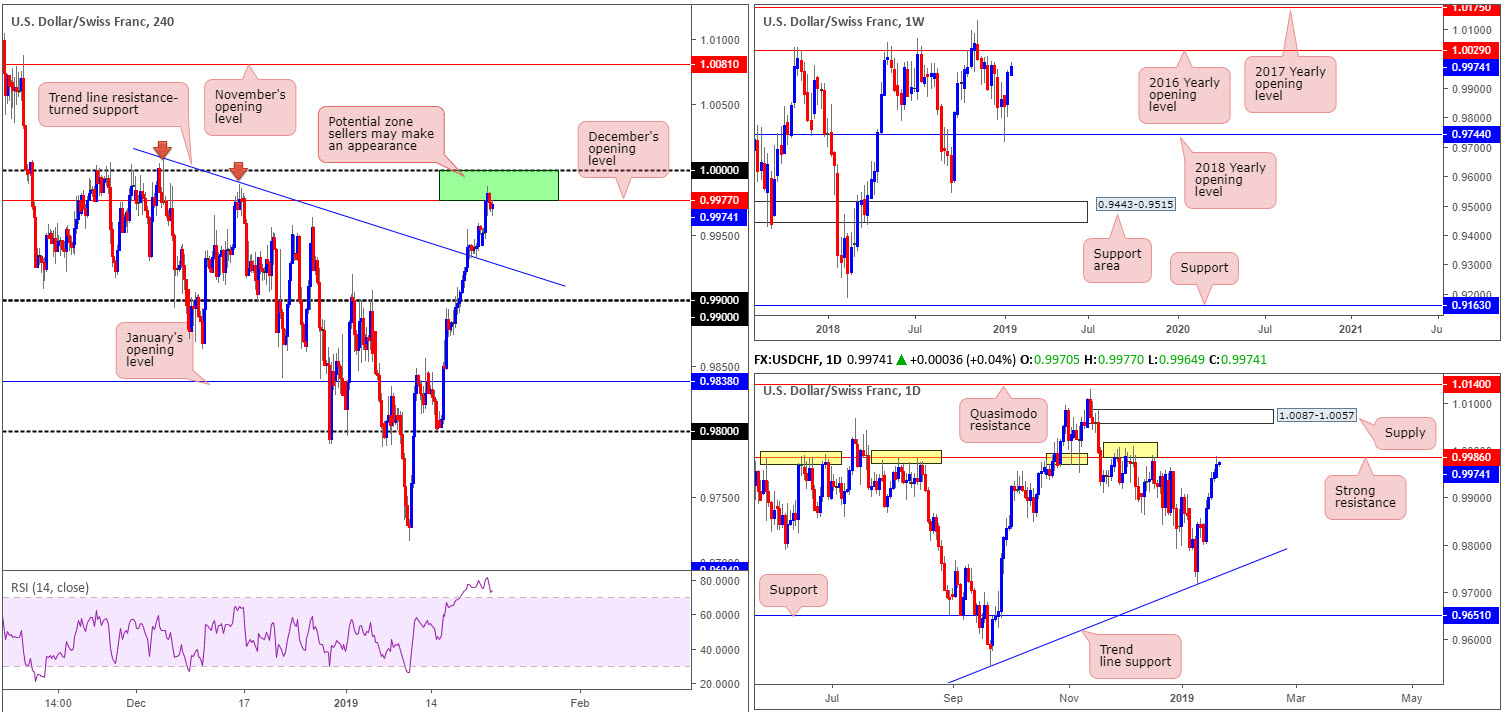
USD/CHF:
The US dollar continued to press higher against its Swiss counterpart Monday, recording its fifth consecutive daily gain. Despite the impressive run of late, upside is likely to experience some resistance.
December’s opening level at 0.9977 on the H4 scale is holding the unit lower as we write. This level is planted just south of parity (1.0000), which is likely a watched number by the majority of the market – even more so considering how strongly it held price action lower late November early December 2018.
What’s also notable in this market from a technical standpoint is daily resistance at 0.9986 which was recently pulled into the mix and the H4 RSI indicator displaying a strong overbought signal. Note 0.9986 boasts strong historical significance (yellow). In the event this level is violated, however, the 2016 yearly opening level on the weekly timeframe at 1.0029 will likely be next in line, followed by daily supply coming in at 1.0087-1.0057.
Areas of consideration:
Between 1.0000 and December’s opening level on the H4 timeframe at 0.9977 (green) is an area potential sellers may reside, given it houses strong daily resistance at 0.9986. The only grumble, of course, is the fact weekly price shows room to press as far north as its 2016 yearly opening level at 1.0029, therefore threatening the sell zone.
To prove sellers reside within 1.0000/0.9977, traders have the option of waiting for a bearish candlestick signal. Not only does this help motion bearish intent, it also provides entry/stop levels to work with. Should we push through 1.0000, however, keep eyes on 1.0029 on the weekly timeframe – just look at the number of times the level held price lower in the past.
Today’s data points: Limited.
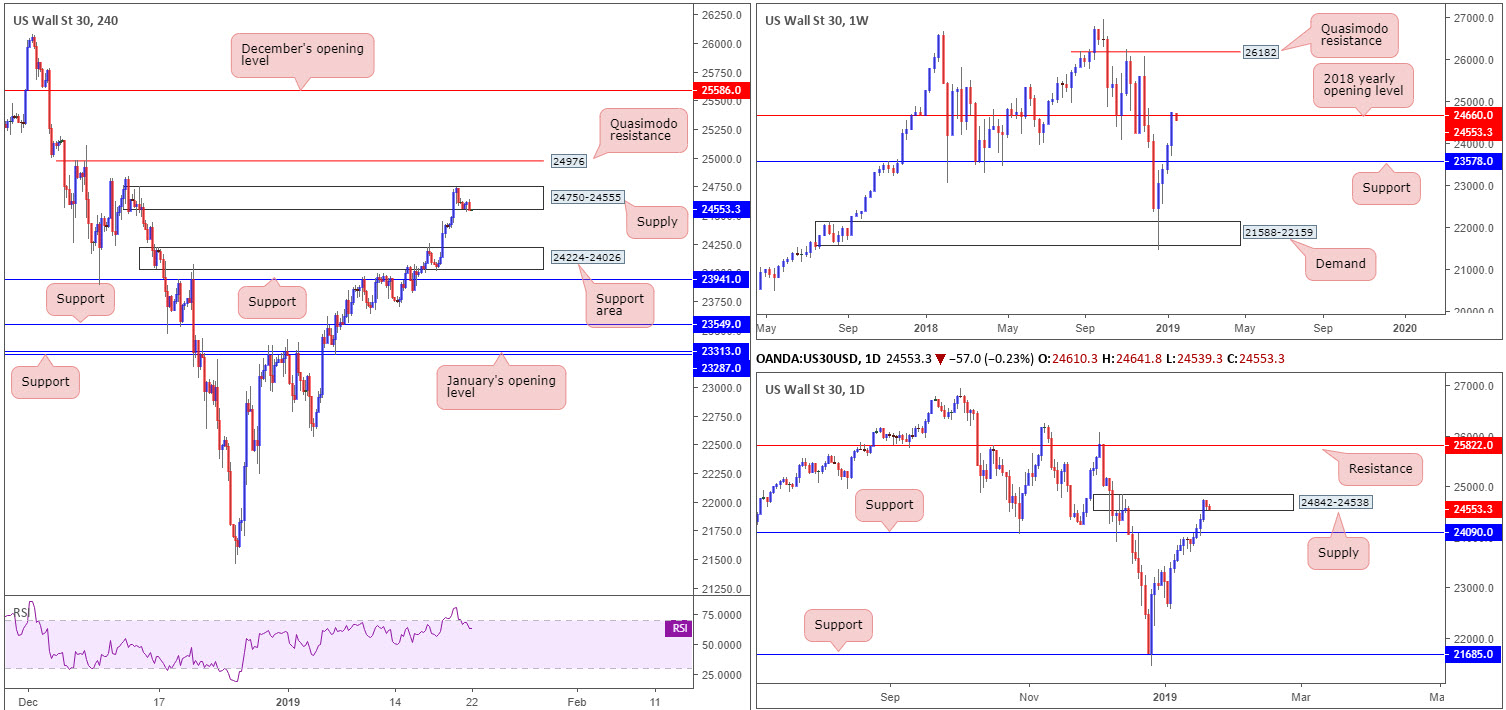
Dow Jones Industrial Average:
With US banks closed in observance of Martin Luther King Day, movement in this market was limited Monday.
H4 supply at 24750-24555, as you can see, remained in the fold, despite having its upper edge challenged. Further selling from this zone has the H4 support area at 24224-24026 to target, shadowed closely by H4 support priced in at 23941. Above the current supply is a nice-looking fresh H4 Quasimodo resistance level planted at 24976. It might also be worth noting the H4 RSI indicator signifies overbought conditions.
In support of further selling in this market, attention is drawn to the weekly timeframe showing price tangling with resistance at 24660: the 2018 yearly opening level (sited within the walls of the current H4 supply). This is further validated on the daily timeframe in the shape of a supply zone seen at 24842-24538. The nearest support level on the higher timeframes is daily support coming in at 24090.
Areas of consideration:
On account of the above, H4 supply at 24750-24555, given its connection with weekly structure, is worthy of attention. An option here would be to enter short at current price and place stop-loss orders either above the supply at around 24752ish or above the daily supply edge at 24842 (dependent on your risk tolerance). The first downside target falls in at 24224: the top edge of the H4 support area that holds within it daily support at mentioned above at 24090.
Today’s data points: Limited.
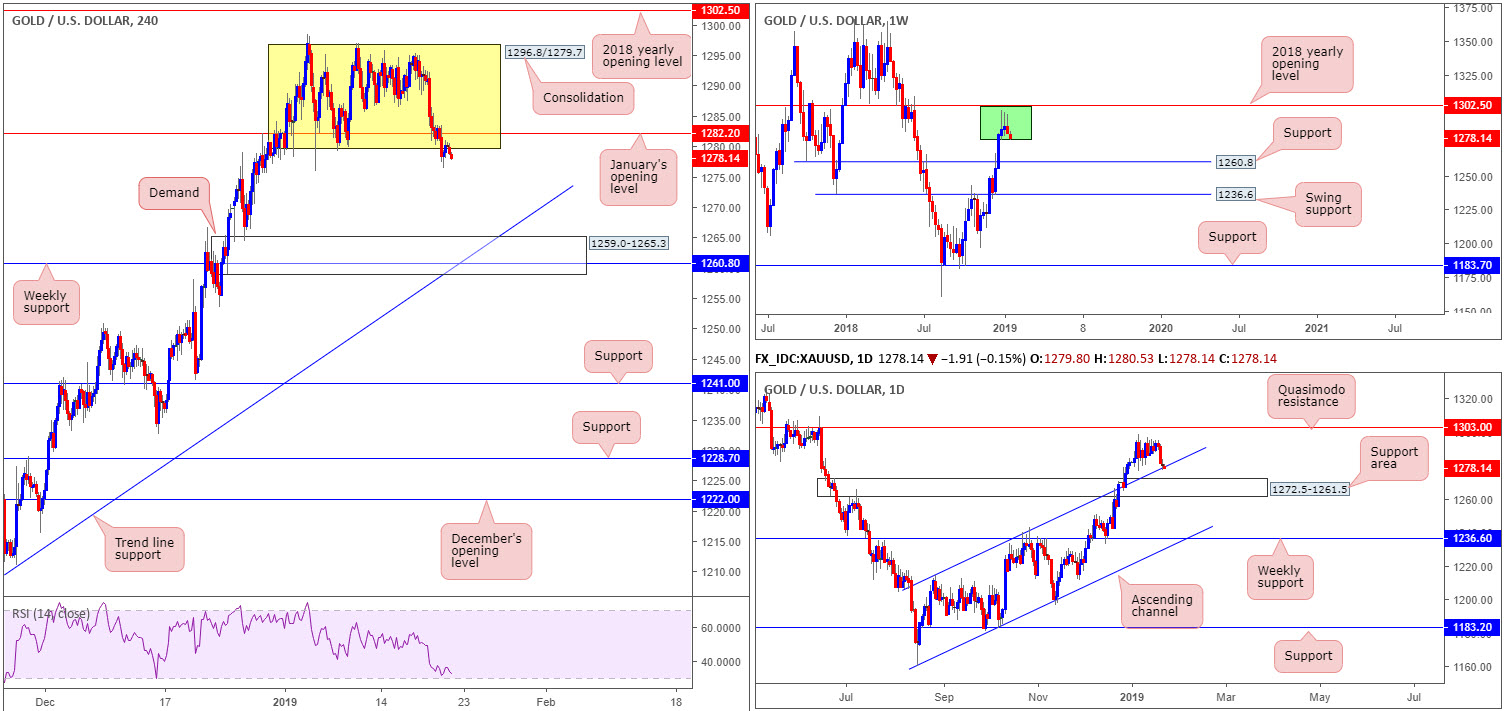
XAU/USD (Gold):
After weekly price printed three consecutive bearish pin-bar formations (green) just south of the 2018 yearly opening level at 1302.5, it appears the unit is pressing for lower ground. Further selling is possible as far south as support coming in at 1260.8 on the weekly scale.
Lower down on the curve, however, we can see daily price crossing swords with channel resistance-turned support (taken from the high 1214.3), which is seen nearby a support area at 1272.5-1261.5.
Traders may also want to acknowledge the landscape on the H4 timeframe, molded in the shape of large consolidation (yellow) seen at 1296.8/1279.7. Note yesterday’s bout of selling brought the candles beyond the lower edge of this zone, potentially setting the stage for a move towards H4 demand plotted at 1259.0-1265.3, which happens to fuse nicely with weekly support at 1260.8 and a H4 trend line support (extended from the low 1196.0). Note this H4 demand is also sited within the lower limits of the daily support area mentioned above at 1272.5-1261.5.
Areas of consideration:
Selling the underside of the current H4 range edge is tricky given daily price testing its channel resistance-turned support.
With that in mind, attention turns towards the H4 demand area highlighted above at 1259.0-1265.3 in view of its connecting confluence (see above in bold). Traders either have the option of entering long on a limit order around 1265.3ish and positioning stop-loss orders below the demand, or wait for additional candlestick confirmation to form and enter long based on this structure. The latter is considered the more conservative route.
The use of the site is agreement that the site is for informational and educational purposes only and does not constitute advice in any form in the furtherance of any trade or trading decisions.
The accuracy, completeness and timeliness of the information contained on this site cannot be guaranteed. IC Markets does not warranty, guarantee or make any representations, or assume any liability with regard to financial results based on the use of the information in the site.
News, views, opinions, recommendations and other information obtained from sources outside of www.icmarkets.com.au, used in this site are believed to be reliable, but we cannot guarantee their accuracy or completeness. All such information is subject to change at any time without notice. IC Markets assumes no responsibility for the content of any linked site. The fact that such links may exist does not indicate approval or endorsement of any material contained on any linked site.
IC Markets is not liable for any harm caused by the transmission, through accessing the services or information on this site, of a computer virus, or other computer code or programming device that might be used to access, delete, damage, disable, disrupt or otherwise impede in any manner, the operation of the site or of any user’s software, hardware, data or property.


