
Condensed analysis due to holiday-thinned trading over Christmas.
IC Markets wish traders a very Merry Christmas and a Happy New Year.
Key risk events today:
US Final GDP q/q.
(Previous analysis as well as outside sources – italics).
EUR/USD:
Areas of consideration:
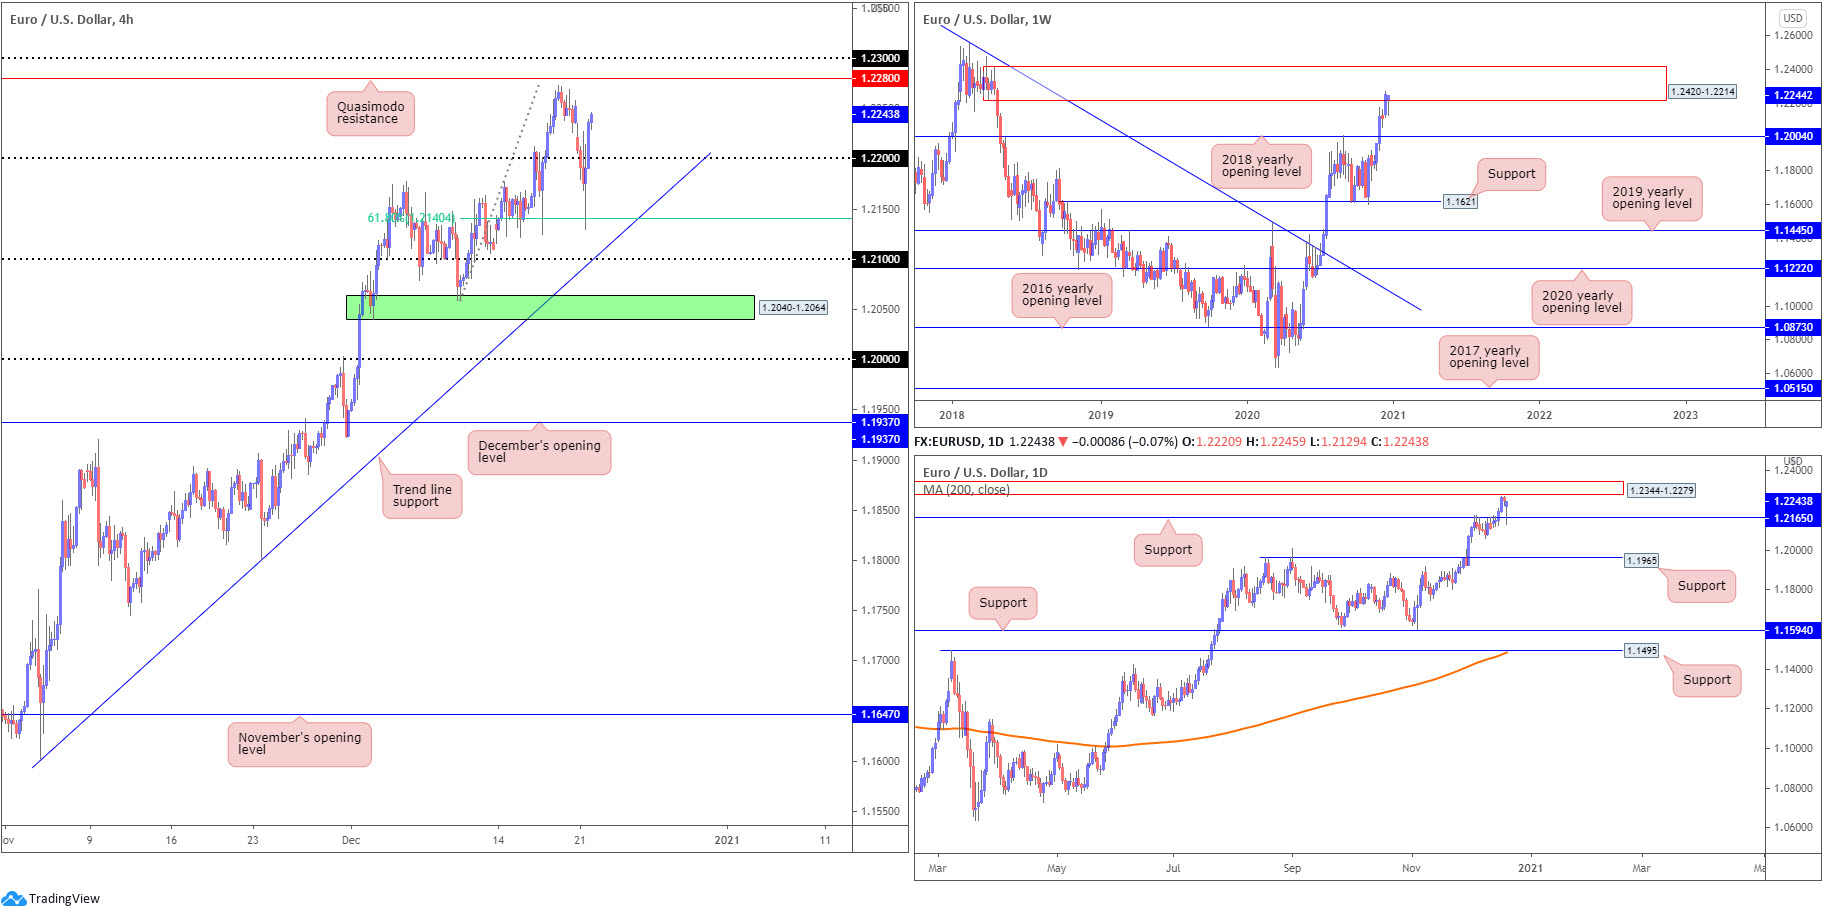
Outlook largely unchanged, despite whipsaw to lows at 1.2129.
- Although the uptrend is clear in this market (since March) and Monday established a daily hammer candlestick pattern off daily support at 1.2165, weekly supply at 2420-1.2214 making an appearance and daily supply nearby at 1.2344-1.2279 (housed within weekly supply) may excite sellers. Countertrend traders are likely to take aim at 1.23, based on the H4 scale, and Quasimodo resistance at 1.2280 (extended from April 2018).
- Any reaction from 1.23/1.2280 turns the spotlight back on the 1.22 figure and 61.8% Fibonacci retracement ratio at 1.2140 (H4). Overthrowing 1.23/1.2280, nonetheless, signals bullish strength and could lift the euro towards 1.24.
GBP/USD:
Areas of consideration:
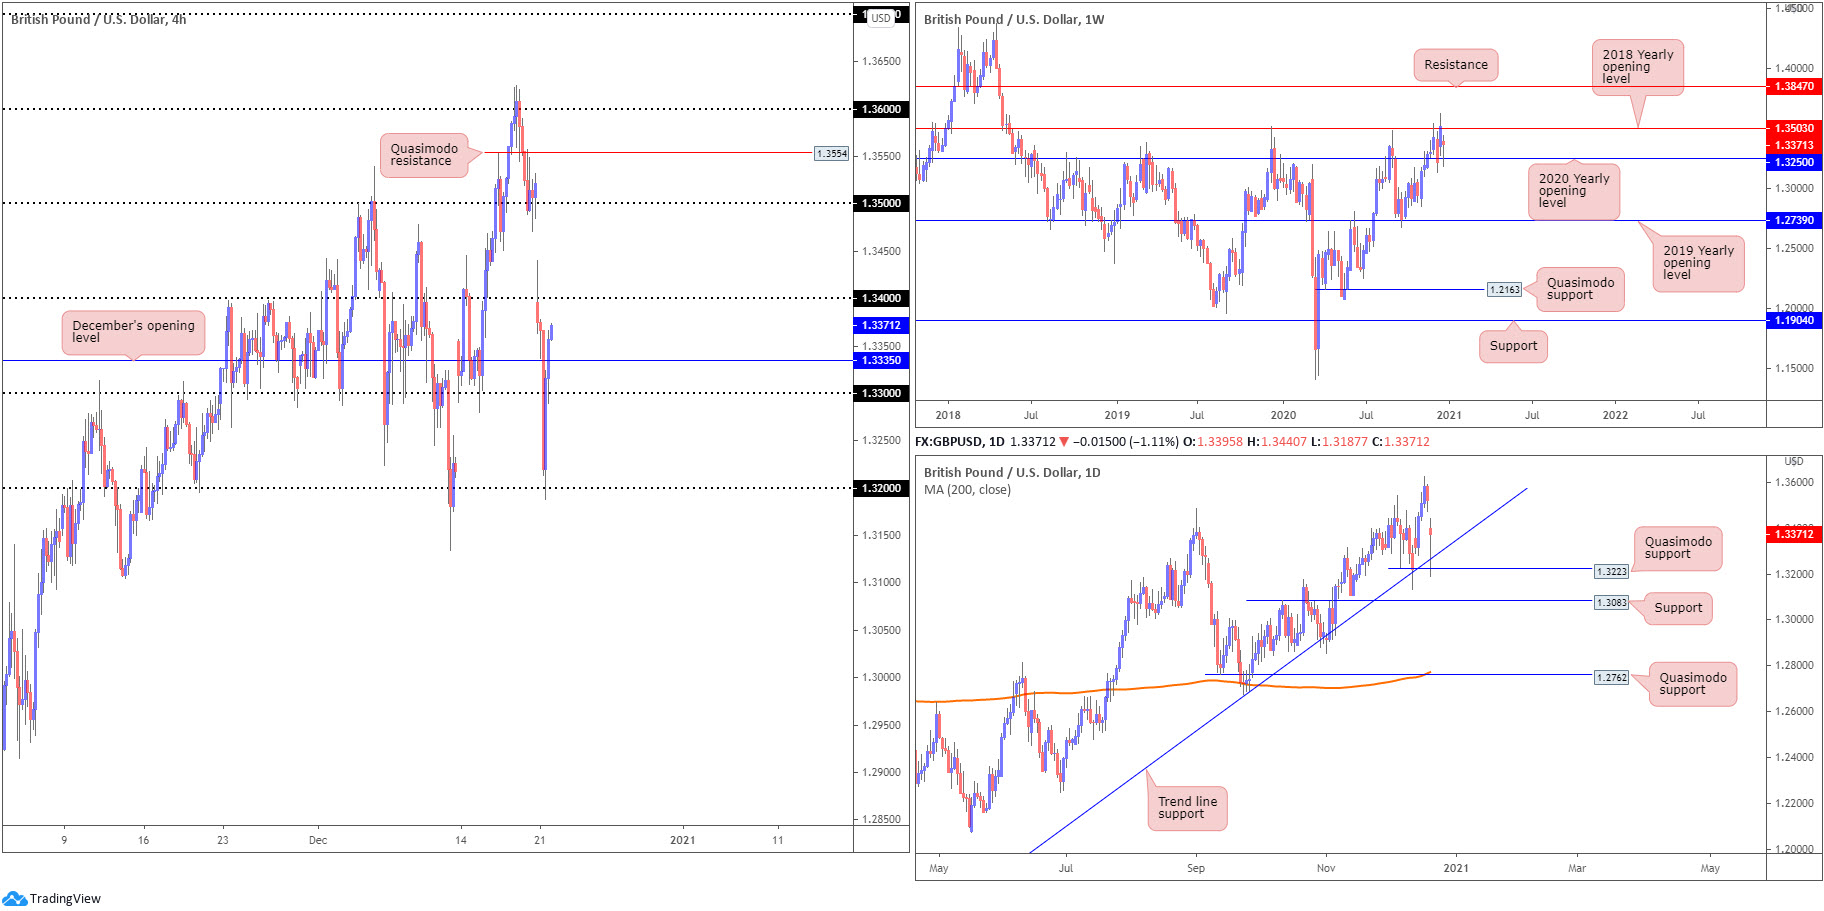
- Weekly resistance at 1.3503 (the 2018 yearly opening value) making a stand over the past couple of weeks may eventually force price action to lower levels. Weekly support at 1.3250 (the 2020 yearly opening value) made an appearance on Monday.
- Yesterday’s reaction off daily Quasimodo support priced in at 1.3223, coupled with trend line support, extended from the low 1.1409, may provide enough fuel to fill this week’s opening gap and test fresh YTD peaks.
- In view of higher timeframe price action, H4 buyers would likely welcome a retest at December’s opening value from 1.3335 today; other traders may prefer to wait and see if a H4 breakout is seen above 1.34 before committing, targeting 1.35.
AUD/USD:
Areas of consideration:
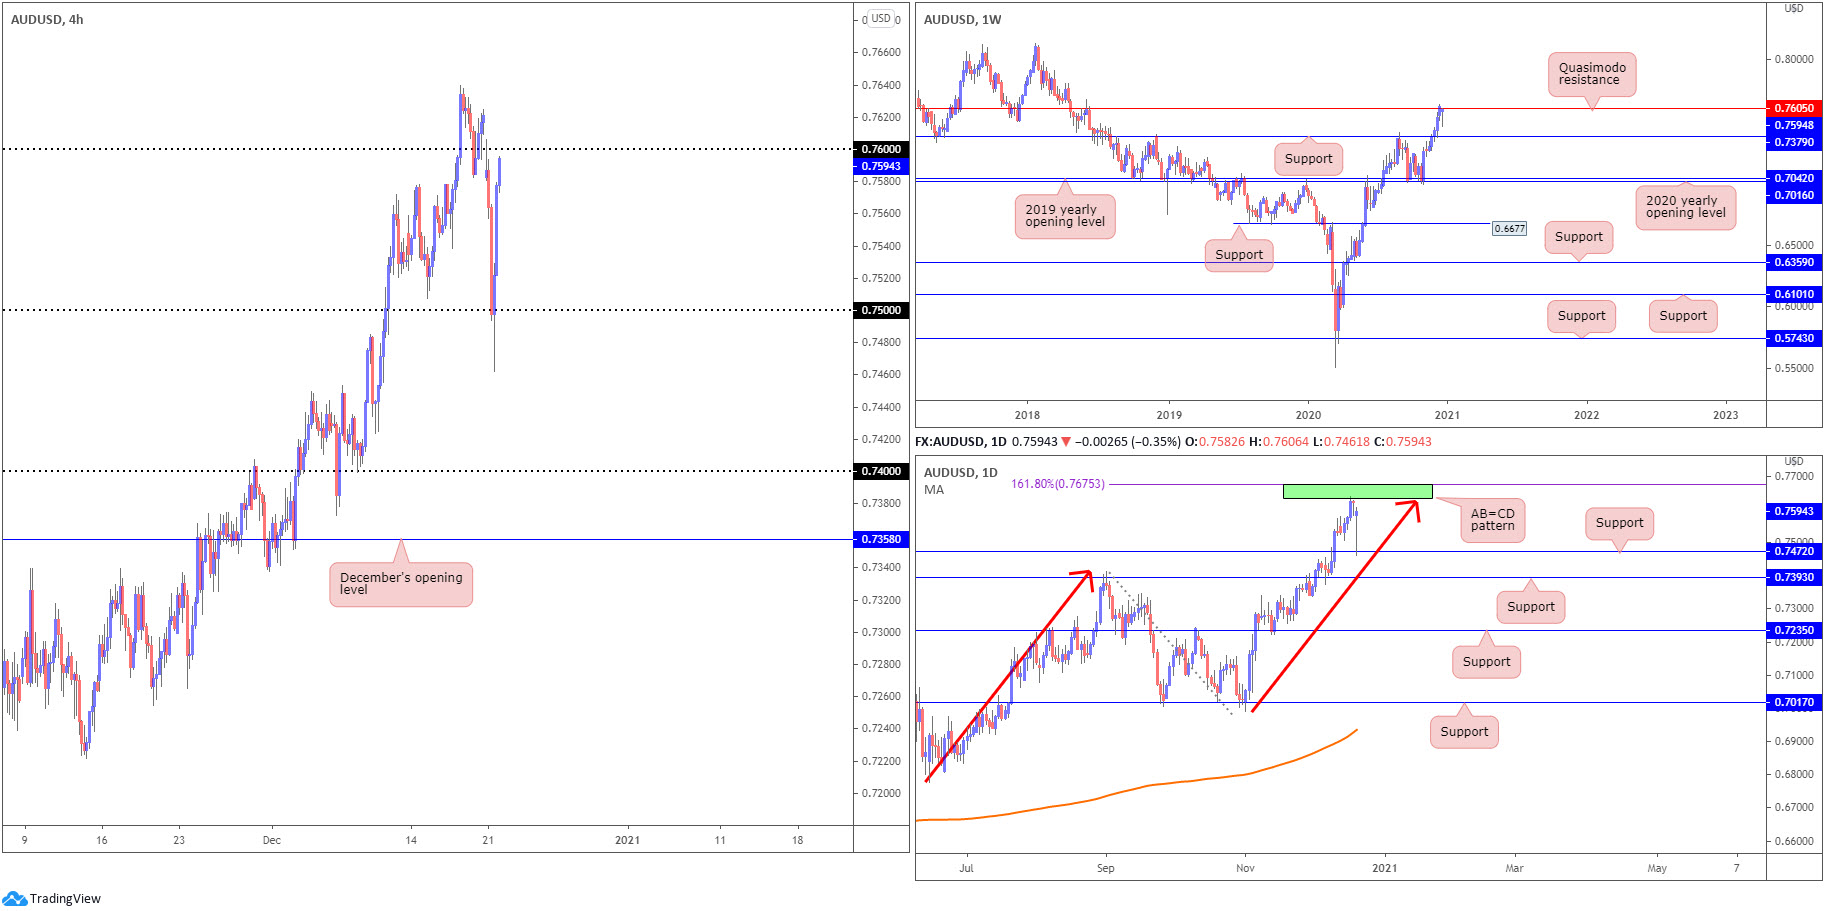
- The combination of weekly Quasimodo resistance at 0.7605, and the daily timeframe’s AB=CD approach (red arrows) between 0.7675/0.7631 (resistance) held Monday, with price visiting 0.7461 lows. Although sellers have clearly shown interest, an uptrend, according to the charts, has been present since March.
- While higher timeframe resistance could discourage buying, it has not deterred dip-buyers off 0.75 (H4), with price now edging towards the underside of 0.76. A H4 close above 0.76 provides a bullish indication price may head for YTD peaks at 0.7639, and possibly higher.
USD/JPY:
Areas of consideration:
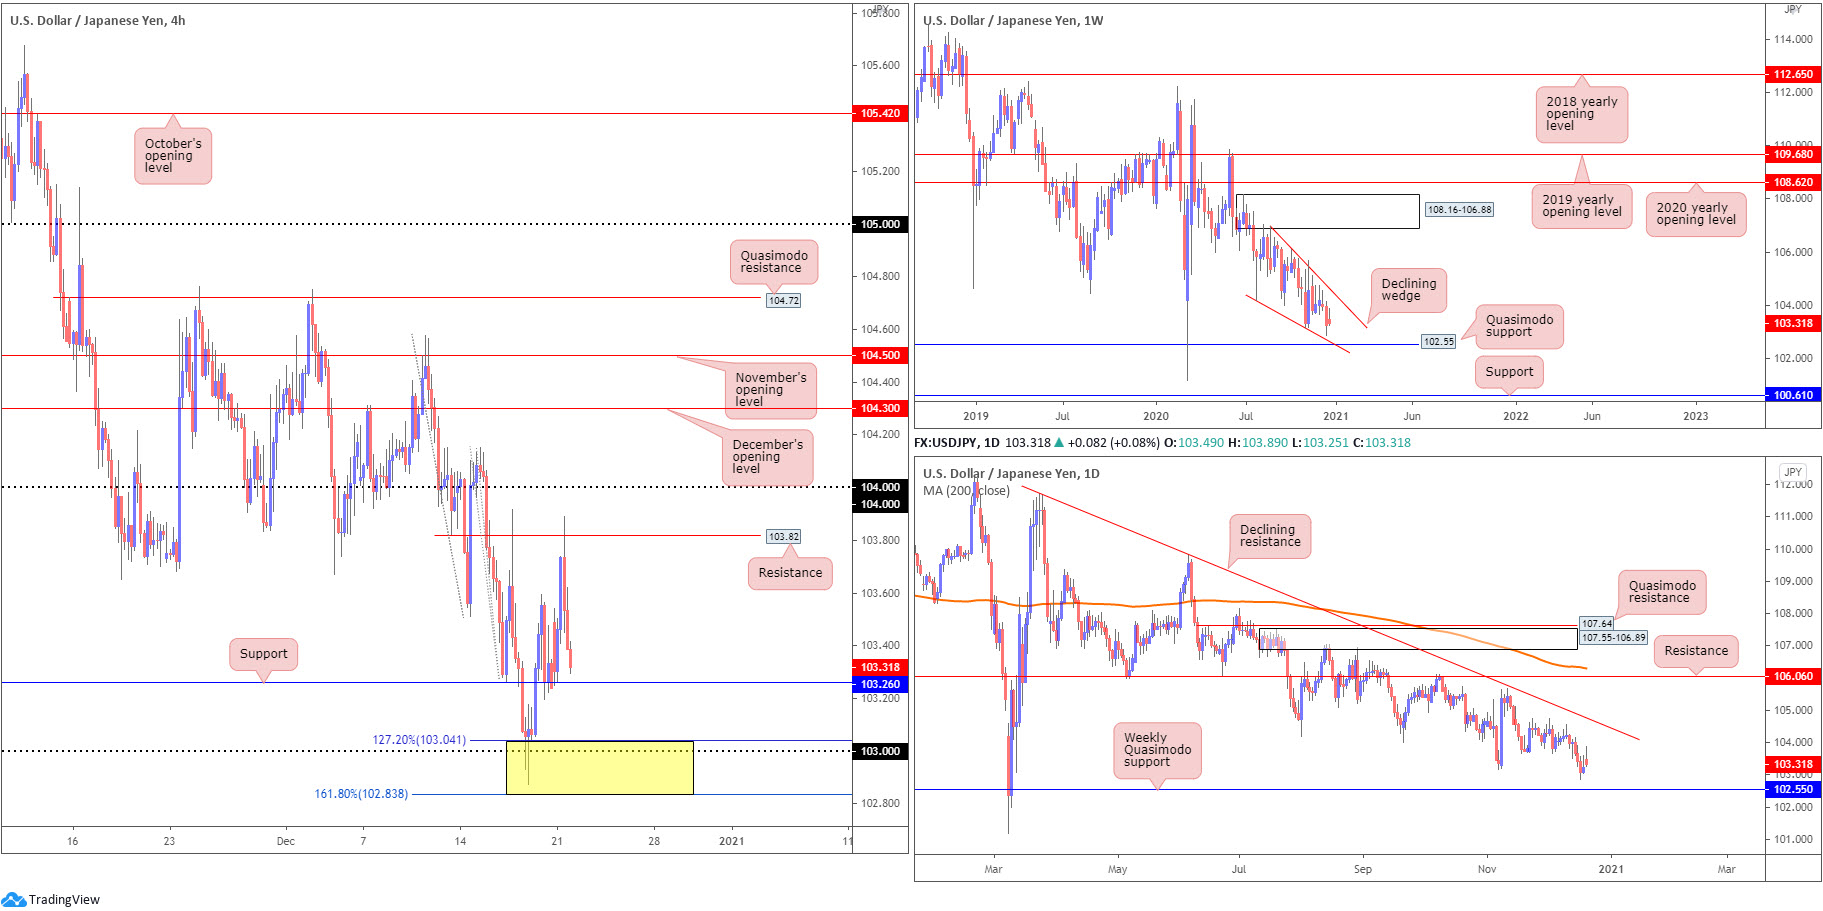
- H4 support at 103.26 was enough to promote buying Monday, with price testing H4 resistance coming in at 103.82. Therefore, 103.26 is likely on the watchlists today.
- The 103 figure also remains a support to be mindful of, bolstered by 127.2% and 161.8% H4 Fibonacci projection points at 103.04 and 102.83 (yellow), respectively.
- Weekly Quasimodo support at 102.55 is also in the picture, should buyers let go of the 103ish range.
- Since connecting with the underside of weekly supply at 108.16-106.88 in August, price has gradually shifted lower and developed a weekly declining wedge (106.94/104.18).
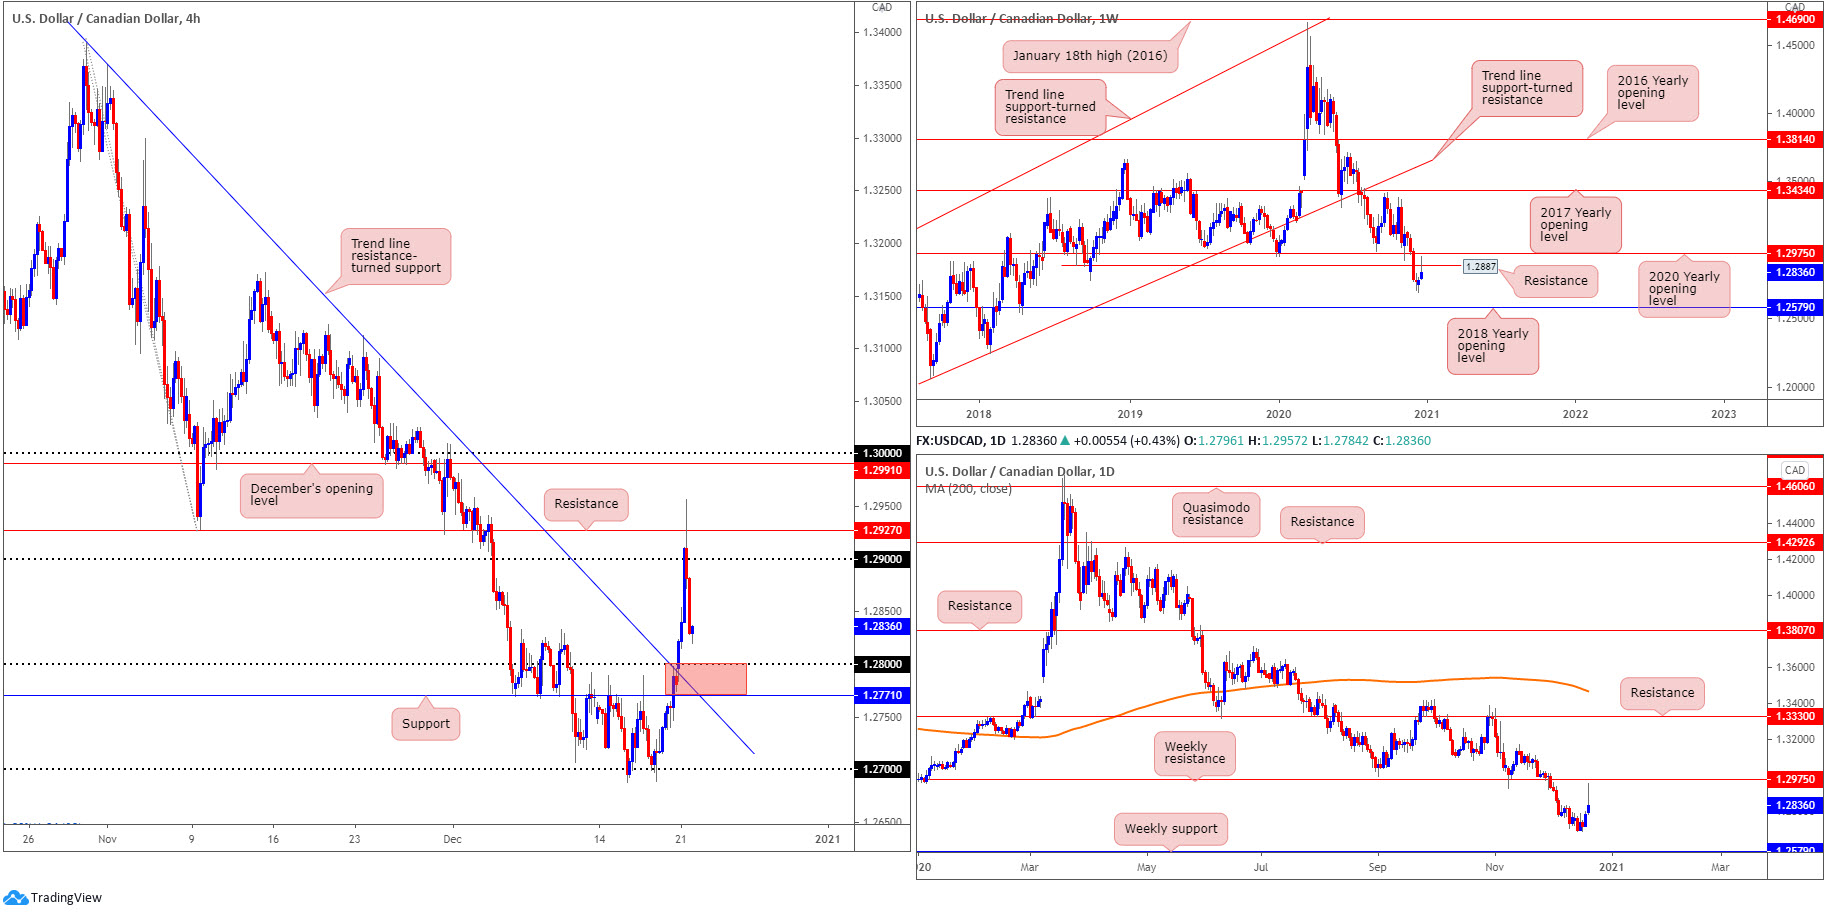
USD/CAD:
Areas of consideration:
- Price action on the weekly timeframe retested resistance at 1.2887 (prior Quasimodo support), positioned beneath another layer of resistance at 1.2975 (2020 yearly opening value). With both 1.2975 and 1.2887 depicting resistance, sustained downside places the 2018 yearly opening value at 1.2579 in the firing line. Also important to note is that long-term flow has been pointing lower since topping in March.
- The 1.28 figure on the H4, along with H4 support at 1.2771 and trend line resistance-turned support, taken from the high 1.3390 (red) represents a possible area of support to be aware of.
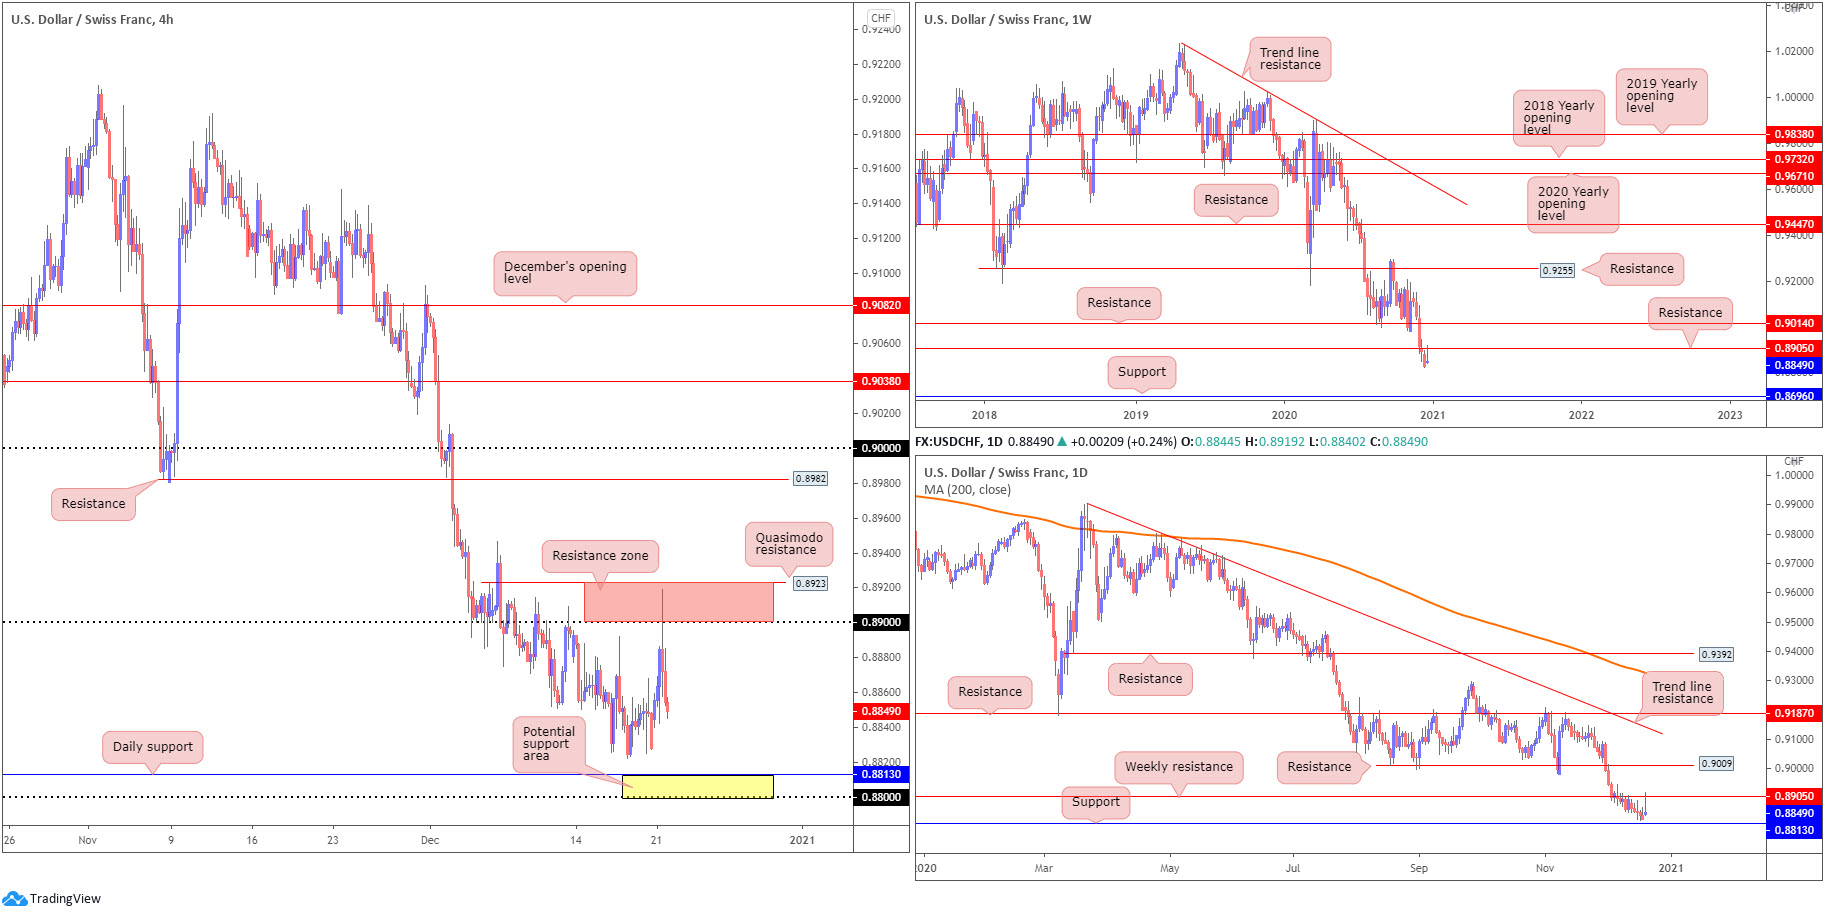
USD/CHF:
Areas of consideration:
- Weekly resistance at 0.8905 represents a key level in this market. Daily support is evident around 0.8813, with weekly support not expected until around 0.8696.
- Daily support at 0.8813 and the 0.88 figure, based on the H4 timeframe, is an area (yellow) traders will likely be watching. Another area on the H4 worth keeping an eye on is between Quasimodo resistance at 0.8923 and the 0.89 handle (red).
- Should 0.88/0.8813 give way, a bearish scenario may form towards weekly support at 0.8696 – essentially the 0.87 figure on the H4.
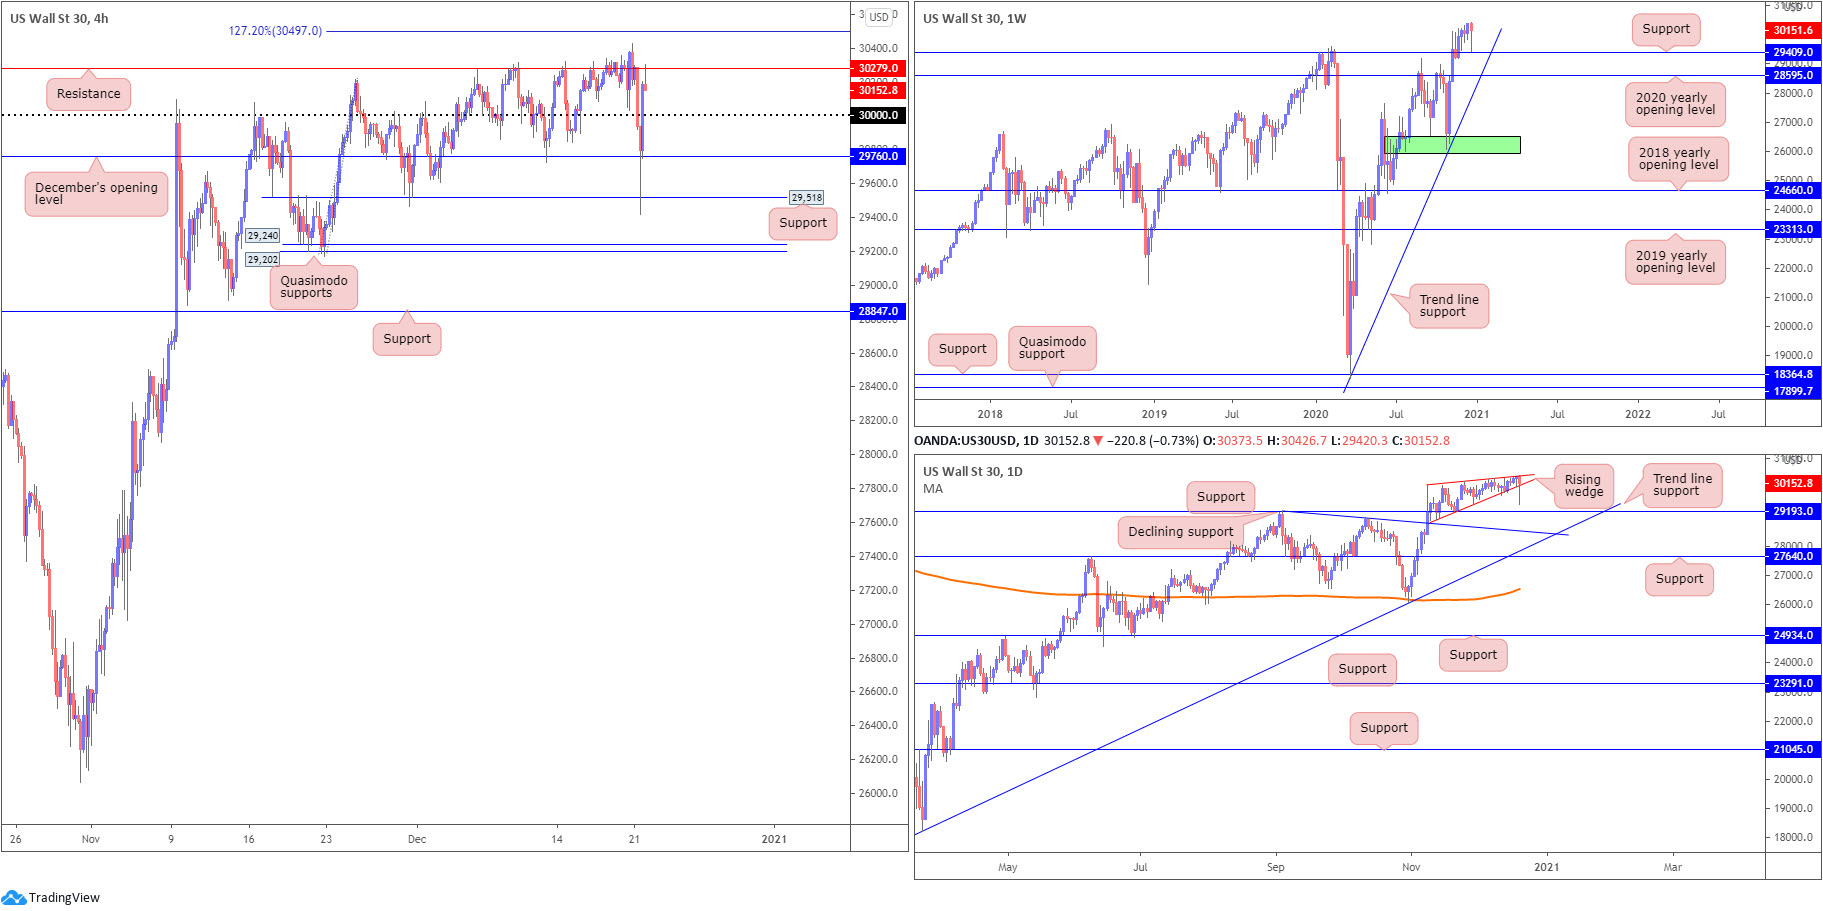
Dow Jones Industrial Average:
Areas of consideration:
- Weekly support at 29,409 (previous Quasimodo resistance) likely remains a level of interest, having seen the base come within inches of making a show yesterday before the unit pared losses.
- H4 resistance around 30,279 is proving problematic for buyers, though an eventual break to fresh all-time peaks is likely to shine the spotlight on the 127.2% and 161.8% H4 Fibonacci projection points at 30,497 and 30,857, respectively. 30,000 stands as immediate support, with a break exposing December’s opening value at 29,760.
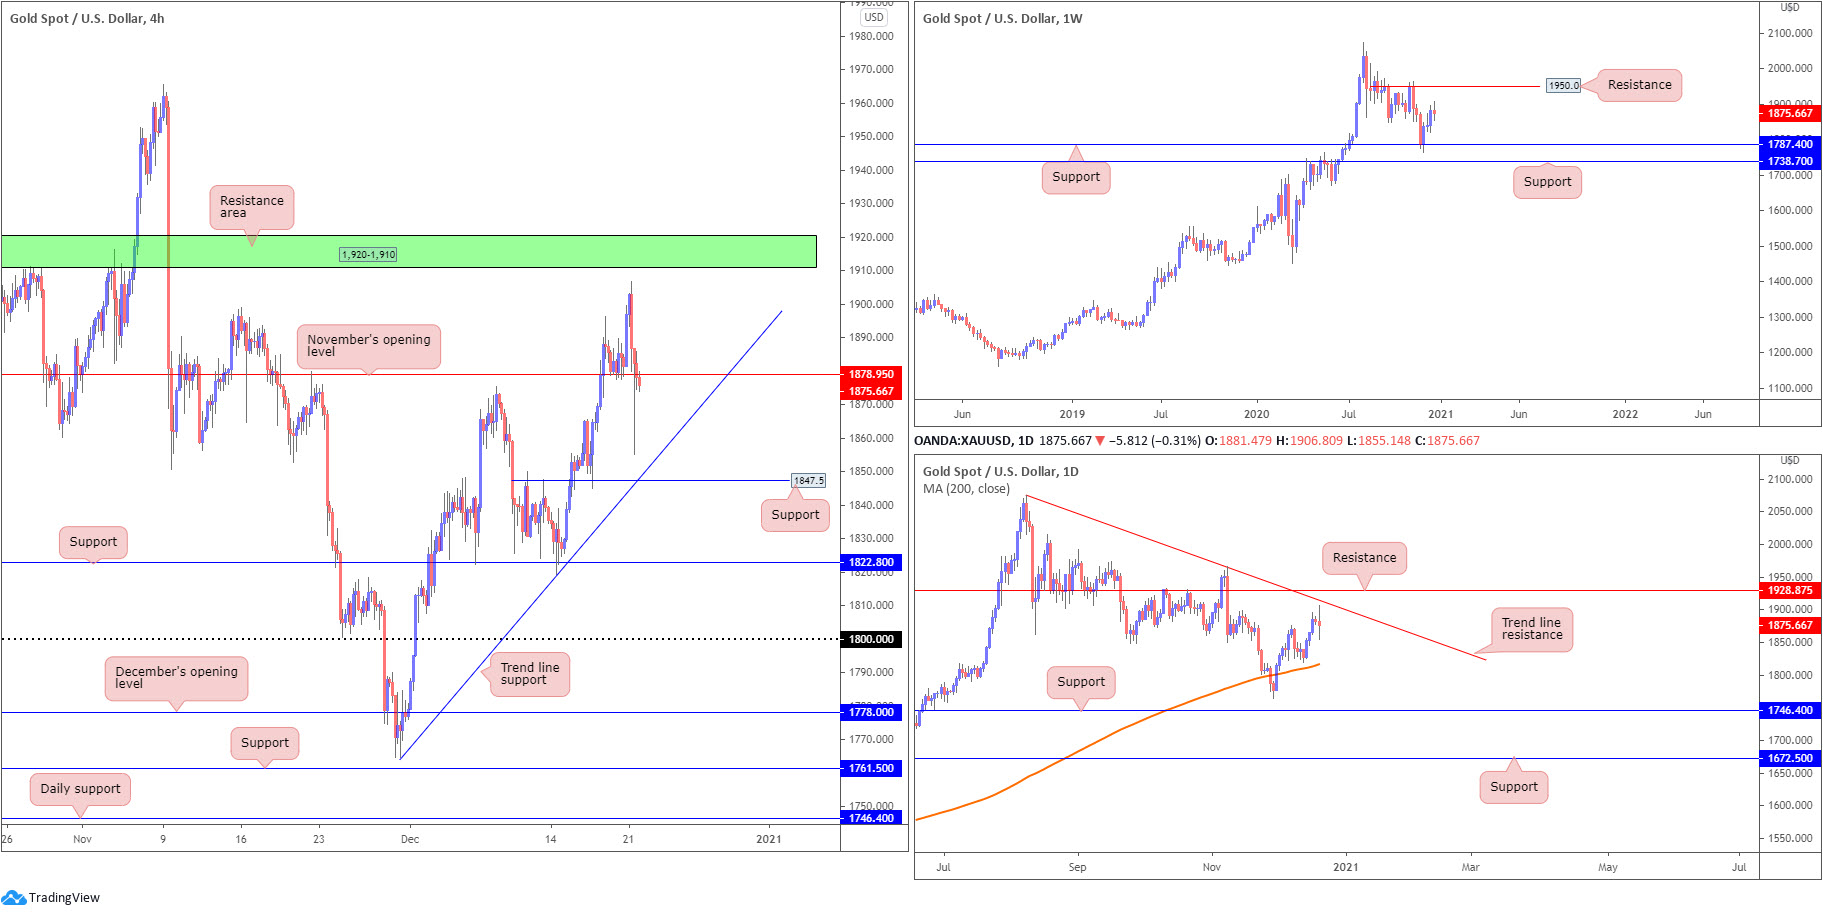
XAU/USD (GOLD):
Areas of consideration:
- Weekly price exhibits scope to approach resistance at $1,950, following the rebound off support at $1,787 in early December.
- Daily flow offered up a long-legged doji pattern Monday, ranging between $1,906/$1,855 ahead of trend line resistance, extended from the high $2,075.
- November’s opening value at $1,878 on the H4, albeit offering support late Friday, failed in later trade Monday following a retreat from the $1,906 session peaks just south of the H4 resistance zone at $1,920-$1,910 (an area merging with daily trend line resistance). Areas of support to be mindful of can be seen around trend line support, etched from the low $1,764, as well as the $1,847 level.
The accuracy, completeness and timeliness of the information contained on this site cannot be guaranteed. IC Markets does not warranty, guarantee or make any representations, or assume any liability regarding financial results based on the use of the information in the site.
News, views, opinions, recommendations and other information obtained from sources outside of www.icmarkets.com.au, used in this site are believed to be reliable, but we cannot guarantee their accuracy or completeness. All such information is subject to change at any time without notice. IC Markets assumes no responsibility for the content of any linked site.
The fact that such links may exist does not indicate approval or endorsement of any material contained on any linked site. IC Markets is not liable for any harm caused by the transmission, through accessing the services or information on this site, of a computer virus, or other computer code or programming device that might be used to access, delete, damage, disable, disrupt or otherwise impede in any manner, the operation of the site or of any user’s software, hardware, data or property.


