
A note on lower timeframe confirming price action…
Waiting for lower timeframe confirmation is our main tool to confirm strength within higher timeframe zones, and has really been the key to our trading success. It takes a little time to understand the subtle nuances, however, as each trade is never the same, but once you master the rhythm so to speak, you will be saved from countless unnecessary losing trades. The following is a list of what we look for:
- A break/retest of supply or demand dependent on which way you’re trading.
- A trendline break/retest.
- Buying/selling tails – essentially we look for a cluster of very obvious spikes off of lower timeframe support and resistance levels within the higher timeframe zone.
- Candlestick patterns. We tend to only stick with pin bars and engulfing bars as these have proven to be the most effective.
For us, lower timeframe confirmation starts on the M15 and finishes up on the H1, since most of our higher timeframe areas begin with the H4.
EUR/USD:
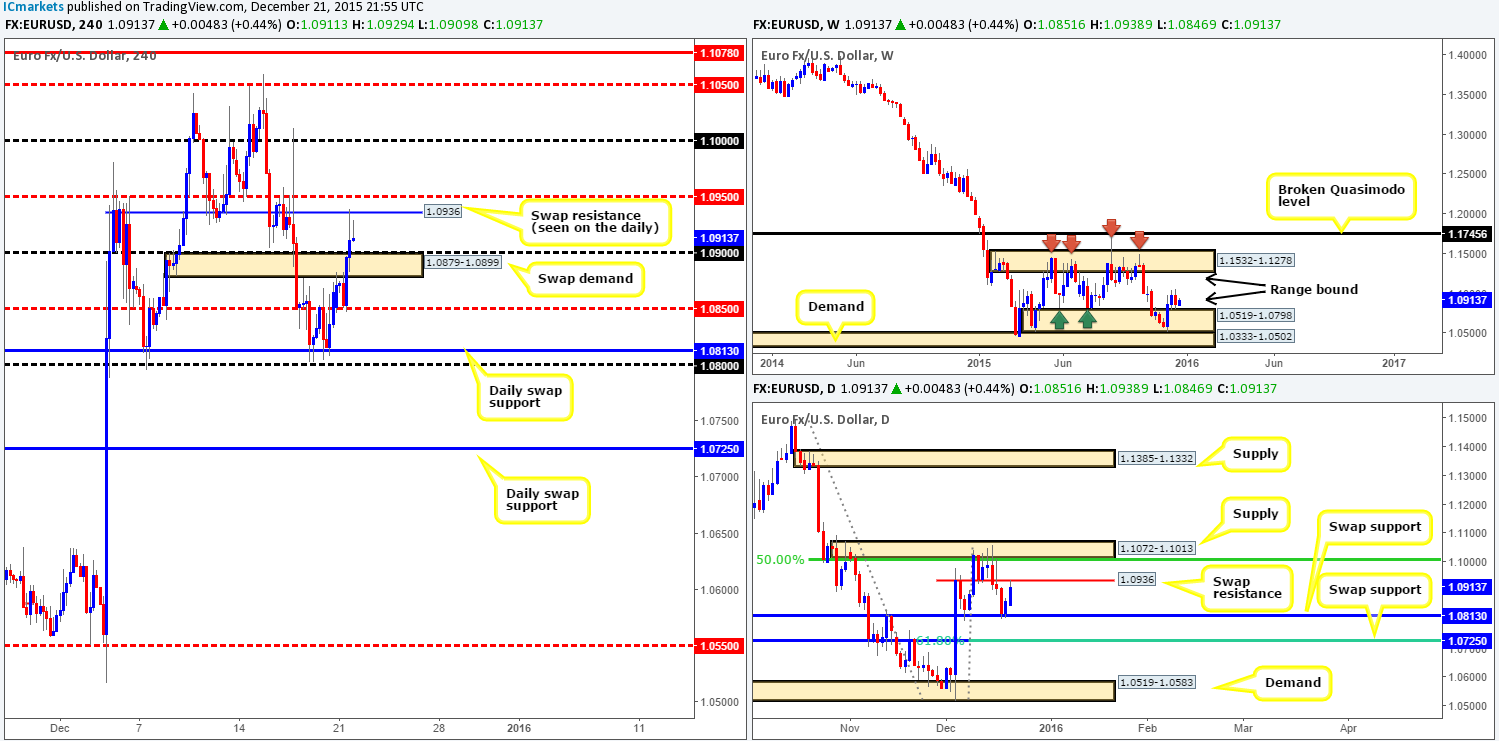
Following Sunday’s open 1.0871, the single currency rebounded from the underside of a H4 swap (supply) area at 1.0879-1.0899, quickly retesting mid-level support at 1.0850 shortly after. From here, the EUR launched itself north, engulfing both the aforementioned H4 swap supply (now demand) and psychological resistance 1.0900, before reaching a H4 swap (resistance) level at 1.0936 (also seen clearly on the daily timeframe) by the day’s end.
With the H4 action in mind, we can see the higher timeframes are in somewhat of a tug-of-war right now. Offers in the market are currently being controlled by the above said swap resistance level at 1.0936 (seen clearly on the daily chart), and the weekly range demand at 1.0519-1.0798 appears to be trading against these offers.
Given the above circumstances, where do we go from here? Well, selling is not something our team is comfortable with at the moment. Reason being is directly below current price on the H4 there’s a collection of near-term supports. By and large, the only opportunity we see potentially taking shape today would be if price closed above both 1.0936 and the mid-level resistance above it at 1.0950, and retested this area as support. That way, we could begin looking for confirmed long entries into the market, targeting the large psychological resistance 1.1000 as a first take-profit zone.
Levels to watch/live orders:
- Buys: Watch for offers to be consumed at 1.0936/1.0950 and look to trade the retest of this area thereafter (confirmation required).
- Sells: Flat (Stop loss: N/A).
GBP/USD:
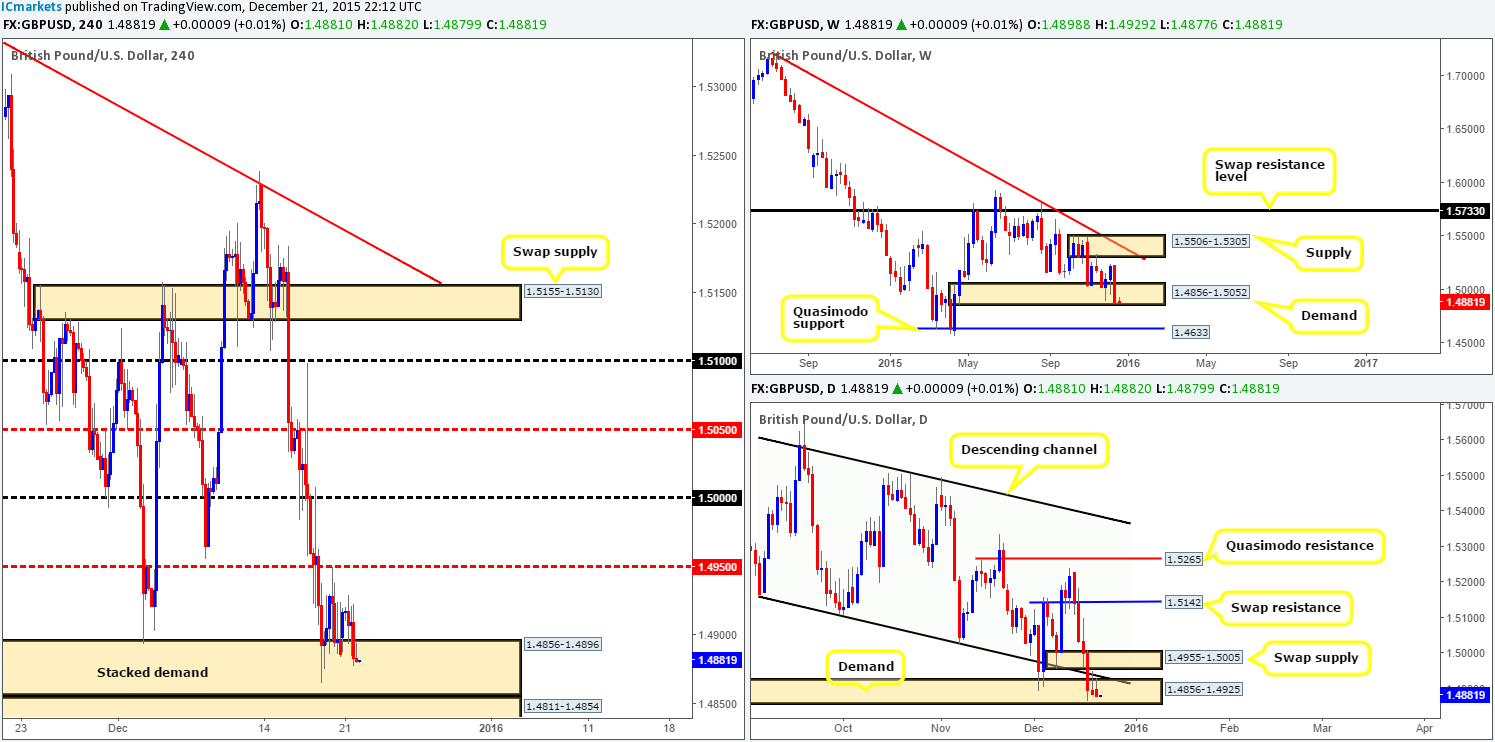
Although Cable remains trading within the lower limits of higher timeframe demand (weekly: 1.4856-1.5052 daily: 1.4856-1.4925) at present, H4 buyers appear to be struggling to stay afloat within demand at 1.4856-1.4896. Friday’s low at 1.4883 was taken out yesterday, consequently forcing price on the daily timeframe to print a second consecutive selling wick (back-to-back inverted pin bars) within the above said daily demand.
We mentioned in our previous report that: as far as supply and demand goes (seen on each of the above timeframes), we should be looking to buy this currency now as this market appears oversold. Whilst we still agree with this statement there is little buying interest being seen at the moment. Unless we are able to locate an attractive buy setup from within the current H4 demand (preferably on the M30/M60), we’ll wait for price to connect with its partner demand below at 1.4811-1.4854 for potential (confirmed) buys. This demand, nevertheless, is planted below the higher timeframe demand areas noted above, so do keep this in mind, as it could either fail miserably, or act as a nice zone to facilitate a fakeout for higher prices.
Remember traders, this is Christmas trading and most of the major players in the FX market are winding down for the festive period, so trade with care as liquidity will likely be thin going forward.
Levels to watch/ live orders:
- Buys: 1.4856-1.4896 [Tentative – confirmation required] (Stop loss: dependent on where one confirms this area). 1.4811-1.4854 [Tentative – confirmation required] (Stop loss: dependent on where one confirms this area).
- Sells: Flat (Stop loss: N/A).
AUD/USD:
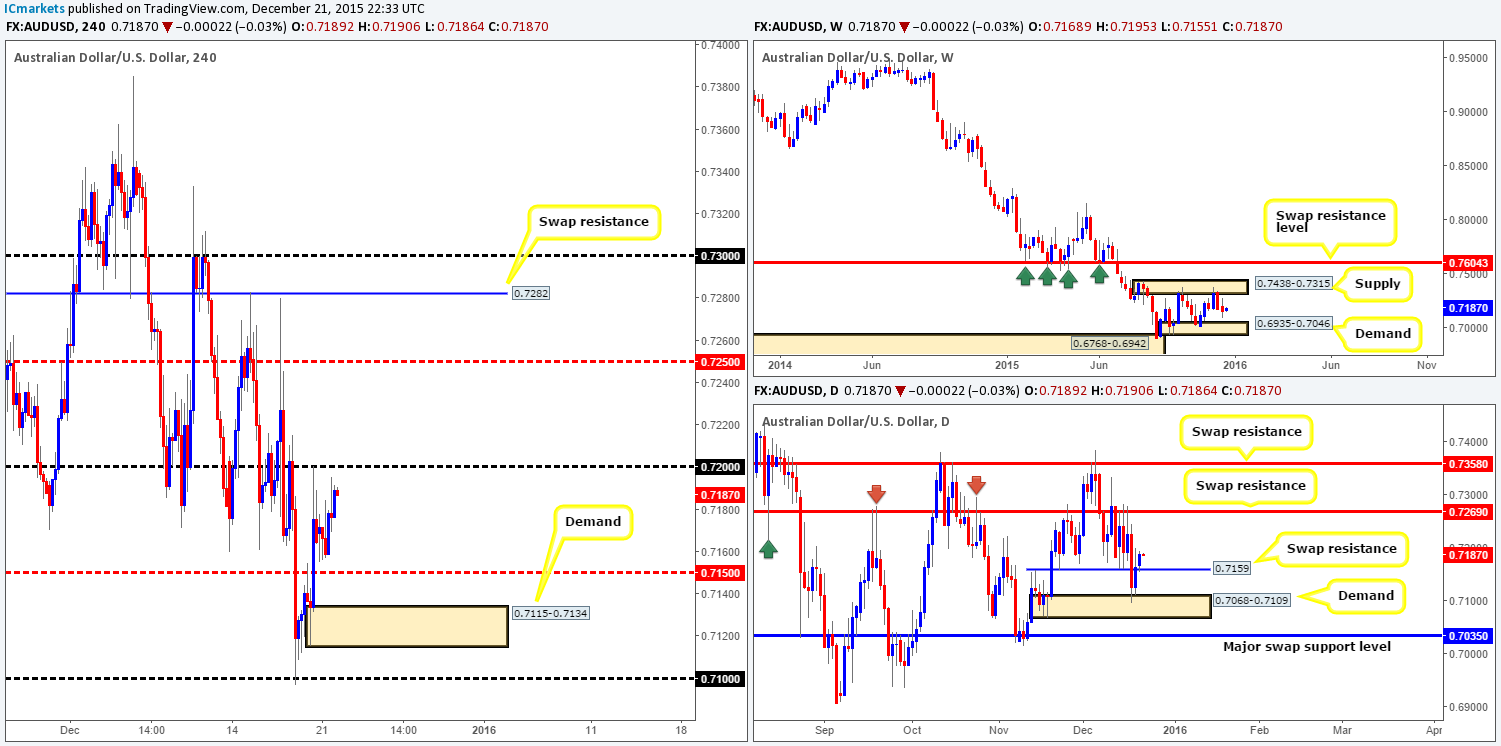
Starting with the weekly chart in this morning’s analysis, we can see that the Aussie remains trading mid-range between supply at 0.7438-0.7315 and demand coming in at 0.6935-0.7046. Zooming in and looking at the daily chart, the buyers managed to hold ground above 0.7159, and retest it as support to close the day positively at 0.7189. In the event that this buying momentum continues this week, this could set the stage for a rally up to swap resistance seen at 0.7269.
Down on the H4, opening action saw the commodity currency drop to lows of 0.7155. It was only mid-way through London trade did we see the bulls rally the market from here, reaching highs of 0.7195 on the day.
With price hovering just below psychological resistance 0.7200, it would be risky to buy this market no matter what the higher timeframe structure is telling us (see above). By the same token, it would, at least for us, also be an uncomfortable platform to short from since price has just respected 0.7159 as support on the daily timeframe. To the end, what we’d really like to see today is a close above 0.7200 before we consider becoming buyers in this market.
Levels to watch/ live orders:
- Buys: Watch for offers to be consumed at 0.7200 and look to trade the retest of this level thereafter (confirmation required).
- Sells: Flat (Stop loss: N/A).
USD/JPY:
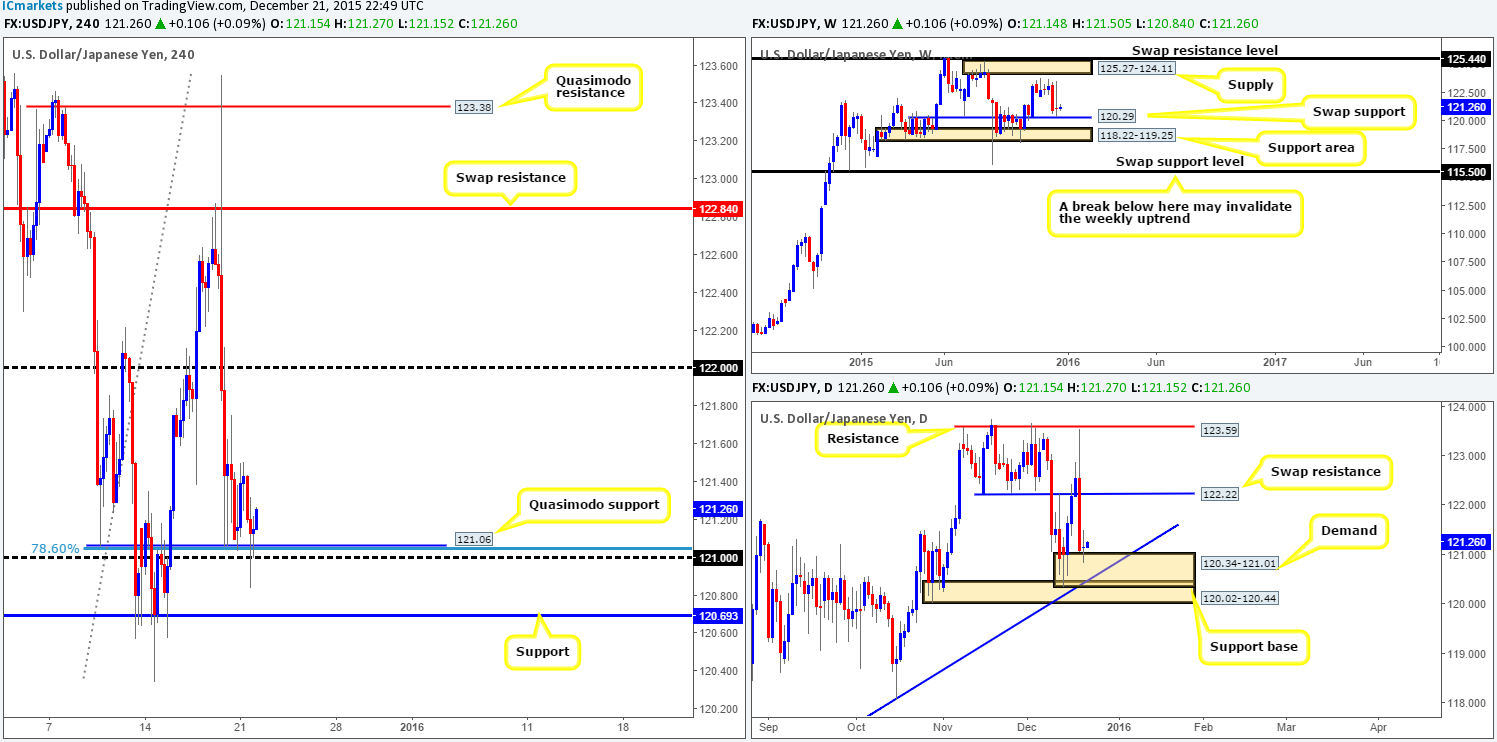
For those who read our previous report on the USD/JPY (http://www.icmarkets.com/blog/monday-21st-december-weekly-technical-outlook-and-review/), you may recall us mentioning that 121.06 was a level we planned to look for confirmed buys from. Shortly after the market opened, one can see price did indeed retest this barrier beautifully, and rally to highs of 121.50 on the day. Well done to any of our readers who managed to lock in some green pips from this bounce.
Price did not hang around too long at 121.50, however, as the market was aggressively sold into, forcing price to whipsaw through the 121.06 Quasimodo support (our previous buy level) into the close. Given the stops losses likely taken out from below both 121.06 and its partnering psychological support 121.00, it’s highly possible price may see further buying in this market today. In addition to this, supporting a move higher, we can see that not only is daily action now teasing demand at 120.34-121.01 (indecision candle printed here yesterday), weekly movement is also holding above the swap support 120.29 for the time being.
On that account, our prime focus today will be (once again) looking for lower timeframe buy entries around the 121.06 region, targeting yesterday’s highs 121.50 first and foremost. Should price break above here, we’ll then be eyeing psychological resistance 122.00 to liquidate our full position.
Levels to watch/ live orders:
- Buys: 121.06 [Tentative – confirmation required] (Stop loss: dependent on where one confirms this level).
- Sells: Flat (Stop loss: N/A).
USD/CAD:
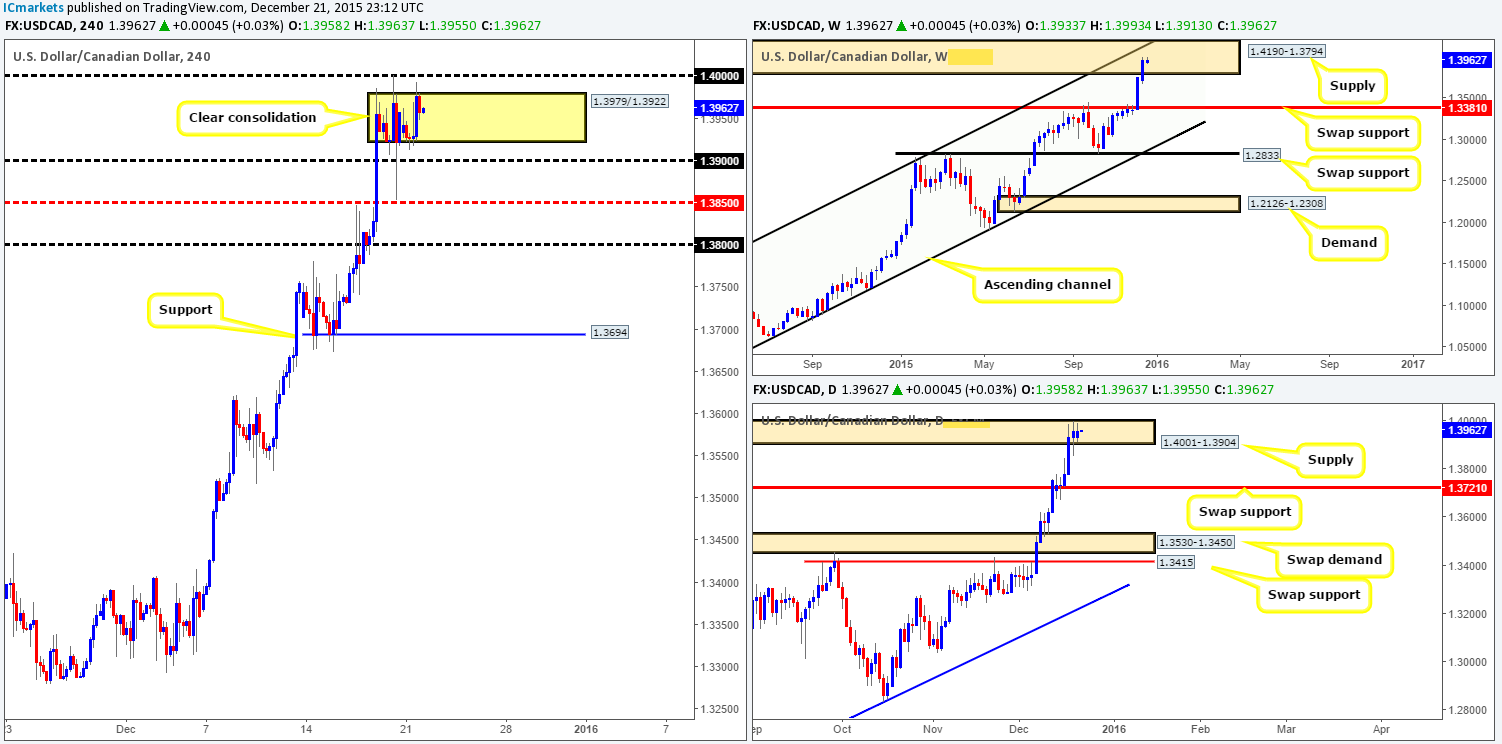
In our previous report (http://www.icmarkets.com/blog/monday-21st-december-weekly-technical-outlook-and-review/), it was noted that the large psychological resistance 1.4000 was (and still is) a key level for us, since traders appear to be unwinding some of their long positions here going into Christmas (making it a potentially strong resistance), hence the consolidation zone currently being seen at 1.3979/1.3922.
In addition to the above, not only is 1.4000 considered a large number in itself, it also sits deep within both a weekly supply at 1.4190-1.3794 and a daily supply drawn from 1.4001-1.3904. As a result, an ideal scenario here would be for price to fake above the current H4 consolidation and hit 1.4000. This effectively would be our cue to begin hunting for a lower timeframe entry to short this market. Given that it’s Christmas and liquidity is likely going to be thin, and the fact that this pair is still trending strong, a short from 1.4000 would be treated as a scalp until proven otherwise.
Levels to watch/ live orders:
- Buys: Flat (Stop loss: N/A).
- Sells: 1.4000 [Tentative – confirmation required] (Stop loss: dependent on where one confirms this level).
USD/CHF:
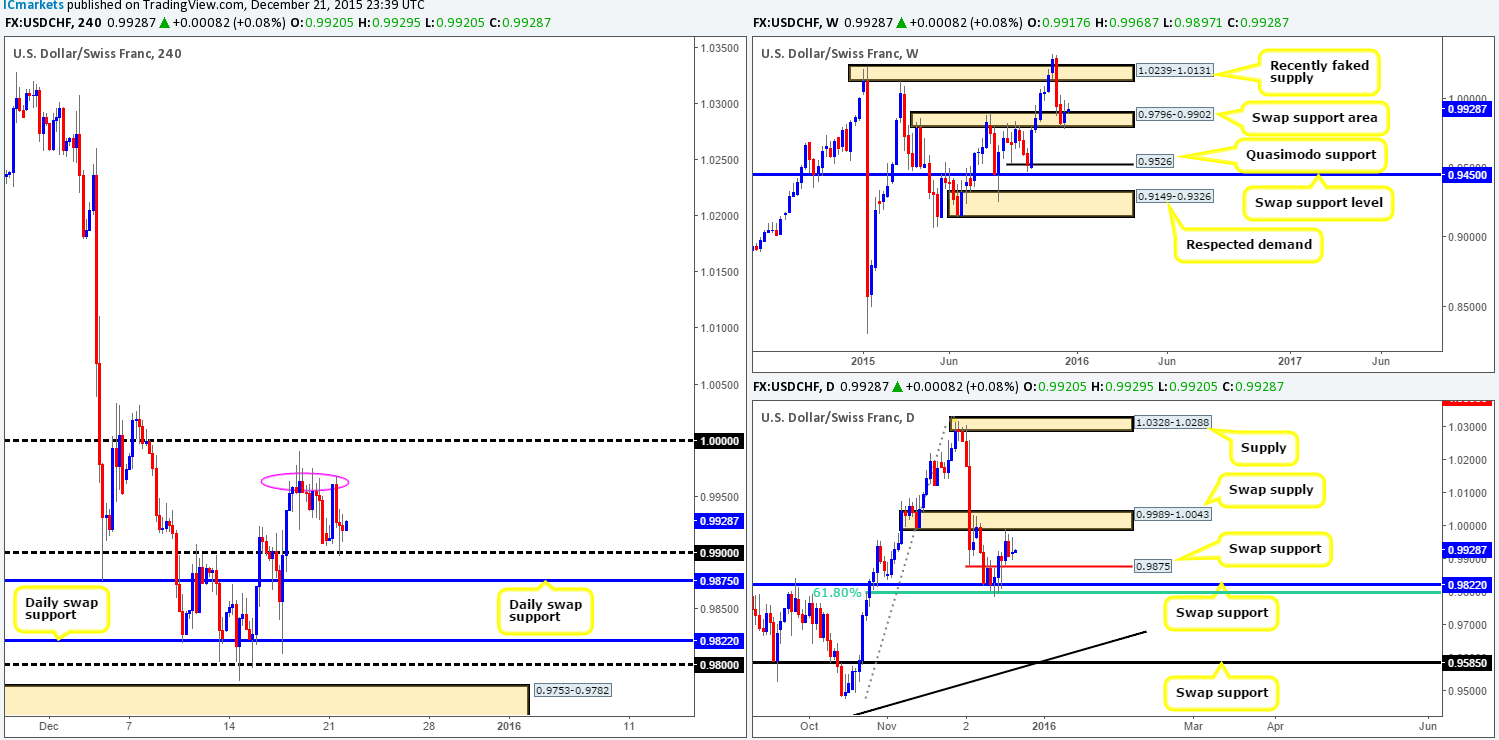
Beginning with the weekly timeframe this morning, bids continue to hold firm at the swap support area drawn from 0.9796-0.9902. From our perspective, the next upside target from here falls in around the recently faked supply area given at 1.0239-1.0131. On the other side of the ledger, the daily chart shows that the buyers and sellers are capped by a swap supply zone coming in at 0.9989-1.0043 and a swap support level at 0.9875. A break above here likely opens the gates for weekly buyers to stretch their legs from the aforementioned weekly swap (support) area. A push below, nonetheless, may allow price to cross swords with swap support at 0.9822 (converges with a 61.8% Fibonacci level at 0.9800), which, in effect, is the last barrier of defense for the current weekly swap area.
Stepping down into the pits of the H4 timeframe, opening trade saw little action until Europe opened for business. Price was aggressively bid up to highs of 0.9968, but then just as aggressively offered, which, as you can see, surpassed session lows of 0.9906 into psychological support 0.9900.
Given this recent action, our outlook has changed a little from the previous report. Here is what we currently have our eye on:
Buys:
- The daily swap (support) level just below 0.9900 at 0.9875. This level, as mentioned above, converges nicely with a 61.8% Fibonacci level at 0.9800, making this hurdle a probable turning point in the market today (lower timeframe confirmation required). We are not ignoring 0.9900 here, it’s just with room seen on the daily structure to push lower, a fake below this round number seems logical to us.
Sells:
- Parity (psychological resistance 1.0000). We know most traders will be fixated on the resistance zone seen marked with a pink circle around the 0.9965 region. However, we believe this structure will likely be faked in order to reach 1.0000. Not only this, but let’s not forget that supporting 1.0000 is a daily swap (supply) zone coming in at 0.9989-1.0043. The only drawback to a short from here is the fact that weekly buyers are currently located within a swap support area at 0.9796-0.9902. Therefore, we’ll only be entering short from 1.0000 should we be able to spot a lower timeframe confirming setup, as getting caught on the wrong side of weekly flow will not do one’s account any favors.
Levels to watch/ live orders:
- Buys: 0.9875 [Tentative – confirmation required] (Stop loss: dependent on where one confirms this level).
- Sells: 1.0000 [Tentative – confirmation required] (Stop loss: dependent on where one confirms this level).
DOW 30
During the course of yesterday’s sessions, we can see that the DOW index bounced nicely from the weekly swap level at 17135, posting highs of 17304 by the day’s end. This recent movement, as you can see, also saw price form a H4 bearish AB=CD pattern topping out around the 17296 region. However, selling on the basis of this pattern may not be the best path to take today as the most we see price retracing to is the H4 swap (support) level seen at 17256. This is primarily due to the possibility that weekly buyers may join on the current momentum from the weekly swap level mentioned above.
Given this, and the fact that both the weekly and daily charts show room to continue rallying much higher, we’re ultimately focusing on buying this market today. As such, the H4 swap (support) level mentioned above may, if retested, provide a platform in which to look for confirmed longs. Should the above come to fruition and we manage to locate a buy setup here, the H4 supply at 17452-17383 will be our first take-profit target (as per the black arrows).

Levels to watch/ live orders:
- Buys: 17256 [Tentative – confirmation required] (Stop loss: dependent on where one confirms this level).
- Sells: Flat (Stop loss: N/A).
XAU/USD: (Gold)
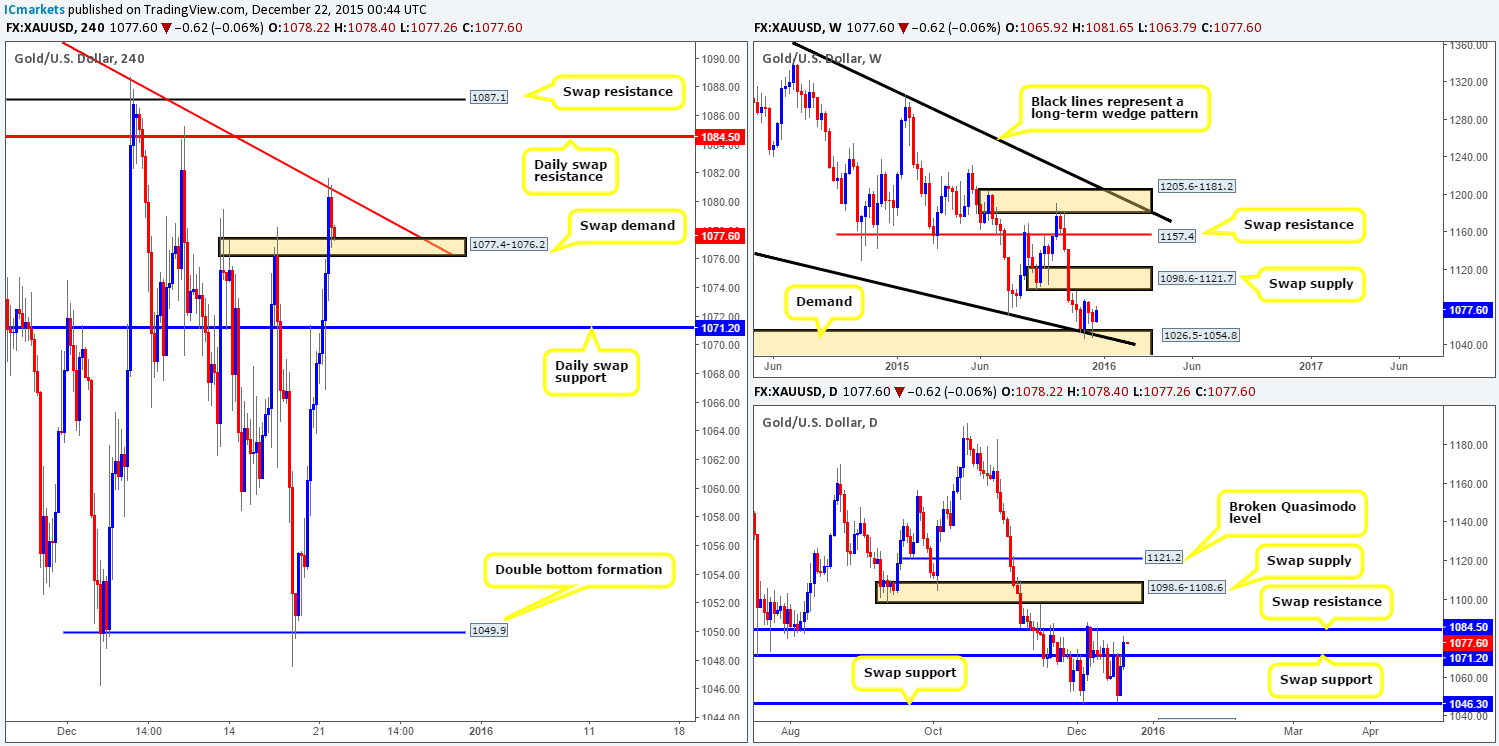
Following Gold’s open 1065.9, the precious metal continued its unrelenting march north, ending the day rebounding from a H4 trendline resistance taken from the high 1097.9. As a result of this recent movement, bids/offers are seen capped between the above said trendline, and a H4 swap (demand) zone seen at 1077.4-1076.2.
In light of the above, what’s the vibe like on the higher timeframe picture? Weekly action continues to hold firm above demand coming in at 1026.5-1054.8 (merges with the lower limit of a long-term wedge pattern from the low 1180.1). Should this continue, the next upside target in the firing range can be seen at 1098.6-1121.7 – a weekly swap (supply) zone. Scrolling down to the daily picture, however, the recent surge of buying broke above swap resistance (now support) at 1071.2, and is currently trading relatively close to a swap resistance level at 1084.5.
With this in mind, battle lines going into today’s sessions are as follows:
Buys:
- The daily swap (support) level at 1071.2. Should price break below the current H4 swap demand at 1077.4-1076.2, this barrier will likely be the next objective to reach. Furthermore, given the position of price on the weekly timeframe (see above) right now, we would consider this a valid platform in which to look for (confirmed) buy entries from.
- A break above the current H4 trendline could potentially give traders the chance to trade any retest seen at this barrier, targeting the daily swap (resistance) level at 1084.5 (confirmation is a must here for us).
Due to the rebound from weekly demand (see above), our team are happy to stick with the above levels for now. Traders may want to bear in mind that trading conditions will likely be thin going forward, unwarranted and sudden moves could be seen so remain vigilant at all times.
Levels to watch/ live orders:
- Buys: 1071.2 [Tentative – confirmation required] (Stop loss: dependent on where one confirms this level). Watch for offers to be consumed around the H4 trendline and look to trade the retest of this barrier thereafter (confirmation required).
- Sells: Flat (Stop loss: N/A).


