
Key risk events today:
RBA Monetary Policy Meeting Minutes; RBA Gov Lowe Speaks; UK Employment Data; German ZEW Economic Sentiment.
(Previous analysis as well as outside sources – italics).
EUR/USD:
It’s been a slow start to the week for EUR/USD, concluding the London session pretty much unchanged. Ranging no more than 55 points on the day, much of the following piece will echo thoughts put forward in Monday’s in-depth technical briefing.
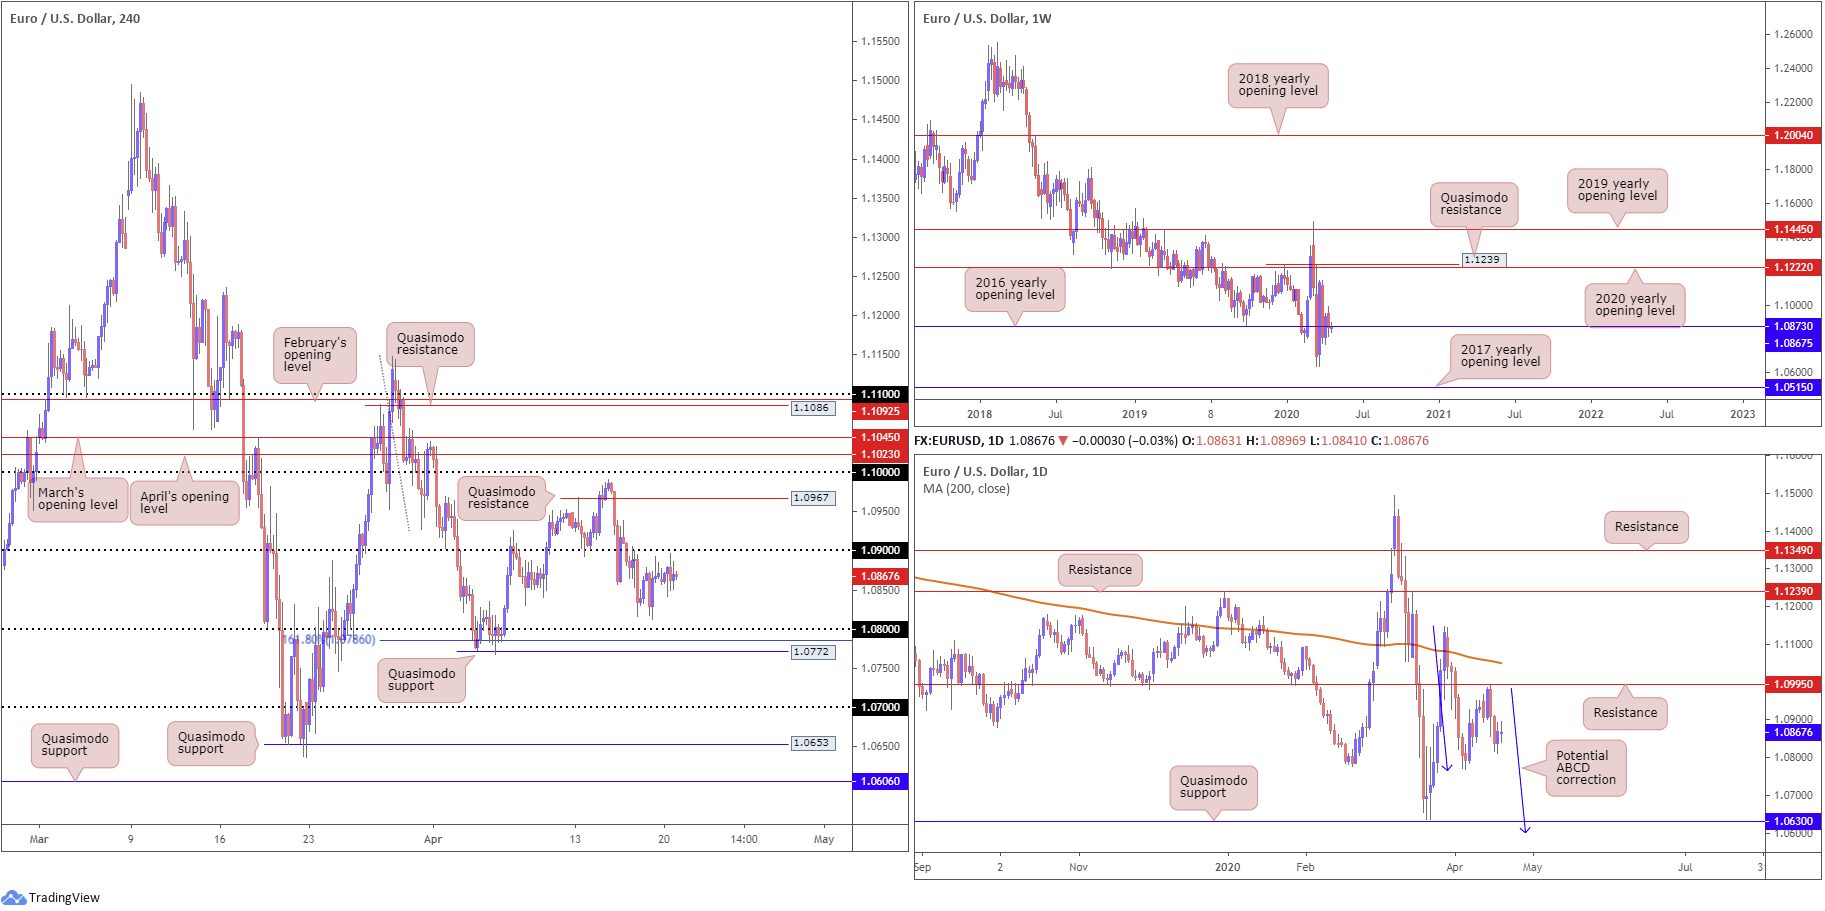
From the weekly timeframe, price action remains linked with its 2016 yearly opening level at 1.0873. Skies above are reasonably blue; a run to the 2020 yearly opening level at 1.1222, shadowed by a Quasimodo resistance at 1.1239 is not out of the question. To the downside, multi-year lows at 1.0635 are in view, with follow-through moves shining the spotlight on the 2017 yearly opening level at 1.0515.
Last week, the daily candles ran into levels just south of resistance at 1.0995, stationed beneath a 200-day SMA (orange – 1.1050). Mid-week witnessed decisive selling, eventually dipping to lows at 1.0812 Friday. Although Friday concluded modestly bullish (Monday’s session formed an indecision candle), continued downside could have the 1.0768 April 6 low come into existence. Beyond here, Quasimodo support at 1.0630 is also a viable floor, closely shadowed by a potential ABCD correction (blue arrows) at 1.0597.
According to the H4 timeframe, price remains hovering south of 1.09. North of here, there’s space towards Quasimodo resistance at 1.0967, though marking 1.0950 may also be an idea as these mid-round numbers can bounce price. To the downside, 1.08 is visible, shadowed closely by a 161.8% Fibonacci extension point at 1.0786 and Quasimodo support at 1.0772.
Beyond 1.0768 (the April 6 low and lower limit of the H4 Quasimodo support at 1.0772), technical eyes are likely fixed on 1.07, owing to the lack of H4 support in between.
Areas of consideration:
1.08, given its close connection with a 161.8% Fibonacci extension point at 1.0786 and Quasimodo support at 1.0772, could prompt an intraday rebound if brought into play today. Conservative traders may seek additional candlestick confirmation prior to pulling the trigger, however, as round numbers are prone to whipsaws. In fact, a whipsaw to H4 Quasimodo support mentioned above at 1.0772 would not be a surprise, having seen the level positioned closely with the 1.0768 April 6 low highlighted on the daily timeframe.
In the event we conquer 1.0768, the pathway south appears clear for a run to 1.07, potentially unlocking the door for bearish scenarios. Likewise, moves above 1.09 could trigger breakout buying towards 1.0950/1.0967.
GBP/USD:
In the absence of tier-1 economic drivers, sterling kicked off the week in relatively subdued fashion.
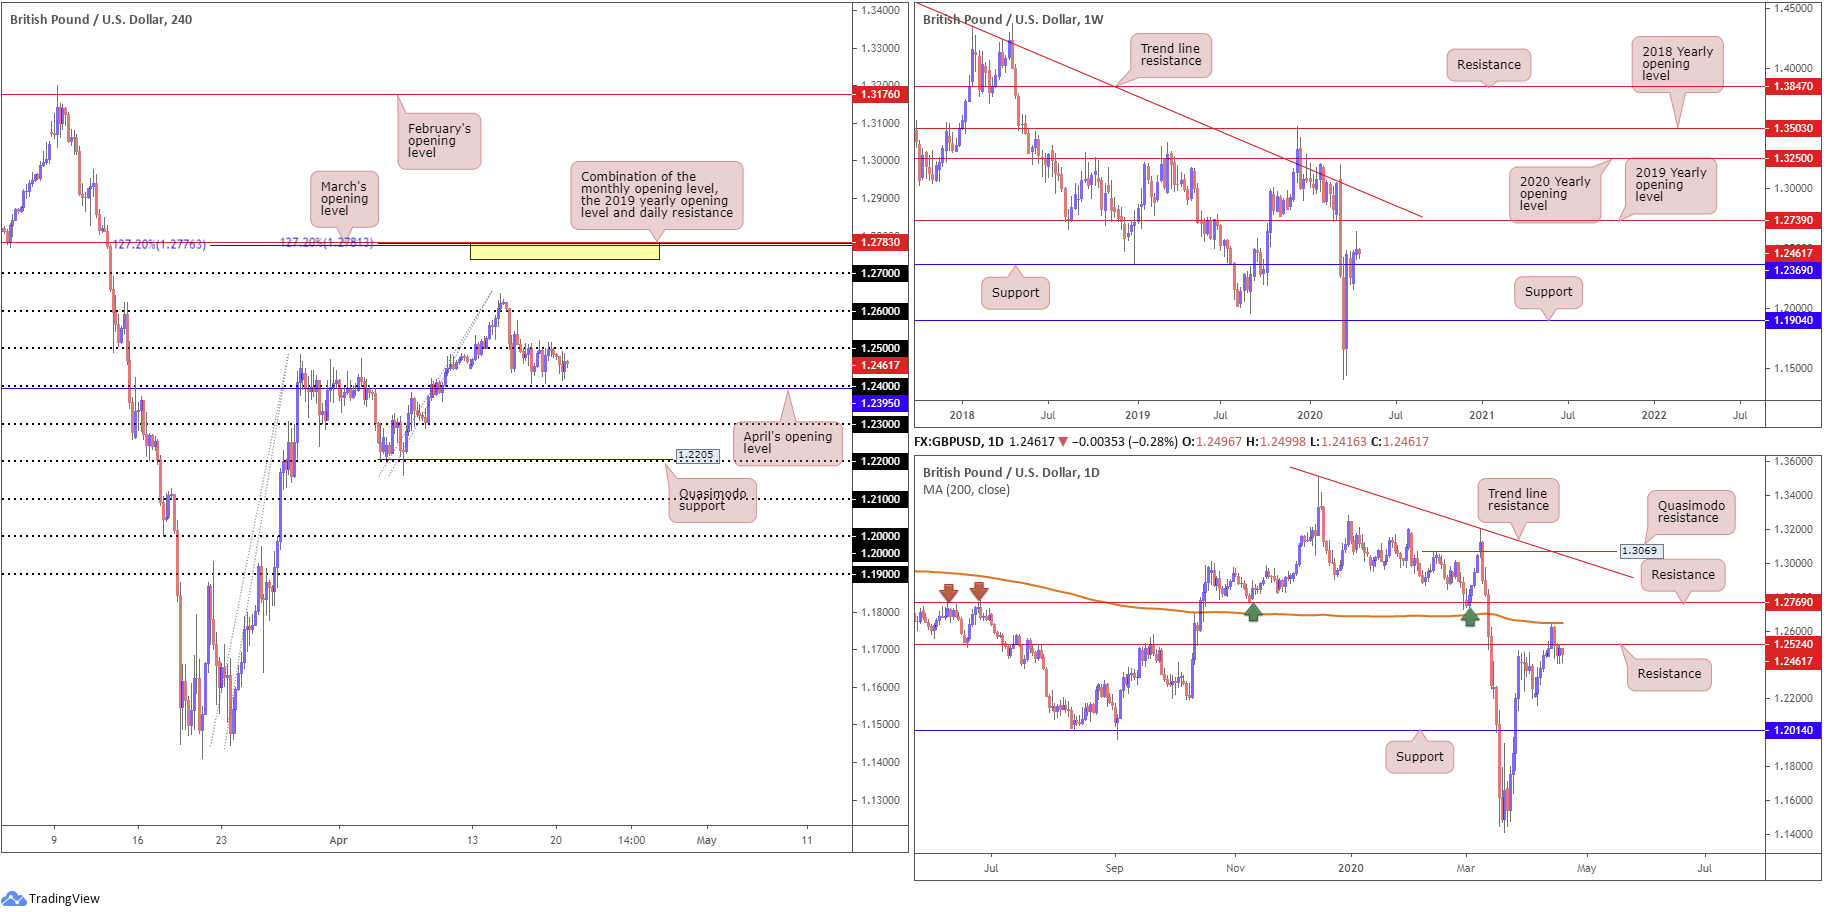
GBP/USD relinquished 1.25 last week, with the figure containing downside thereafter. 1.24 also nearly made its way into the limelight, closely followed by April’s opening level at 1.2395. Outside of these areas, 1.26/3 are likely of interest. Another area worth placing on the watchlist from the H4 timeframe, although it may not come into effect this week, is March’s opening level at 1.2783. It holds closely with the 2019 yearly opening level on the weekly timeframe at 1.2739, daily resistance at 1.2769 (yellow) and two H4 127.2% Fibonacci extension levels at 1.2781 and 1.2776.
Further out on the weekly timeframe, price action is seen hovering north of support at 1.2369. North of here we have the 2019 yearly opening level mentioned above at 1.2739 in view, followed by a long-term trend line resistance, taken from the high 1.5930.
Lower on the curve, daily movement overrun support at 1.2524 last week, following a rejection off the 200-day SMA (orange – 1.2647). Clearing 1.2524 not only opens up the possibility of a retest forming at the said base as resistance this week, it has likely shifted focus towards the 1.2163 April 7 low as the next viable support on this chart, assuming we overthrow weekly support underlined above at 1.2369.
Areas of consideration:
With weekly support at 1.2369 circulating sub 1.24, a fakeout beneath the said round number to the weekly base is a potential scenario. A close back above 1.24 would, for most price-action traders, likely be considered a buy signal, given the weekly connection.
A breakout above 1.25, nevertheless, faces immediate resistance in the form of the noted daily resistance at 1.2524. This will likely catch a lot of breakout traders off guard should 1.2524 still hold a sting. Prudent traders will likely wait for H4 price to clear the said daily base before pulling the trigger.
AUD/USD:
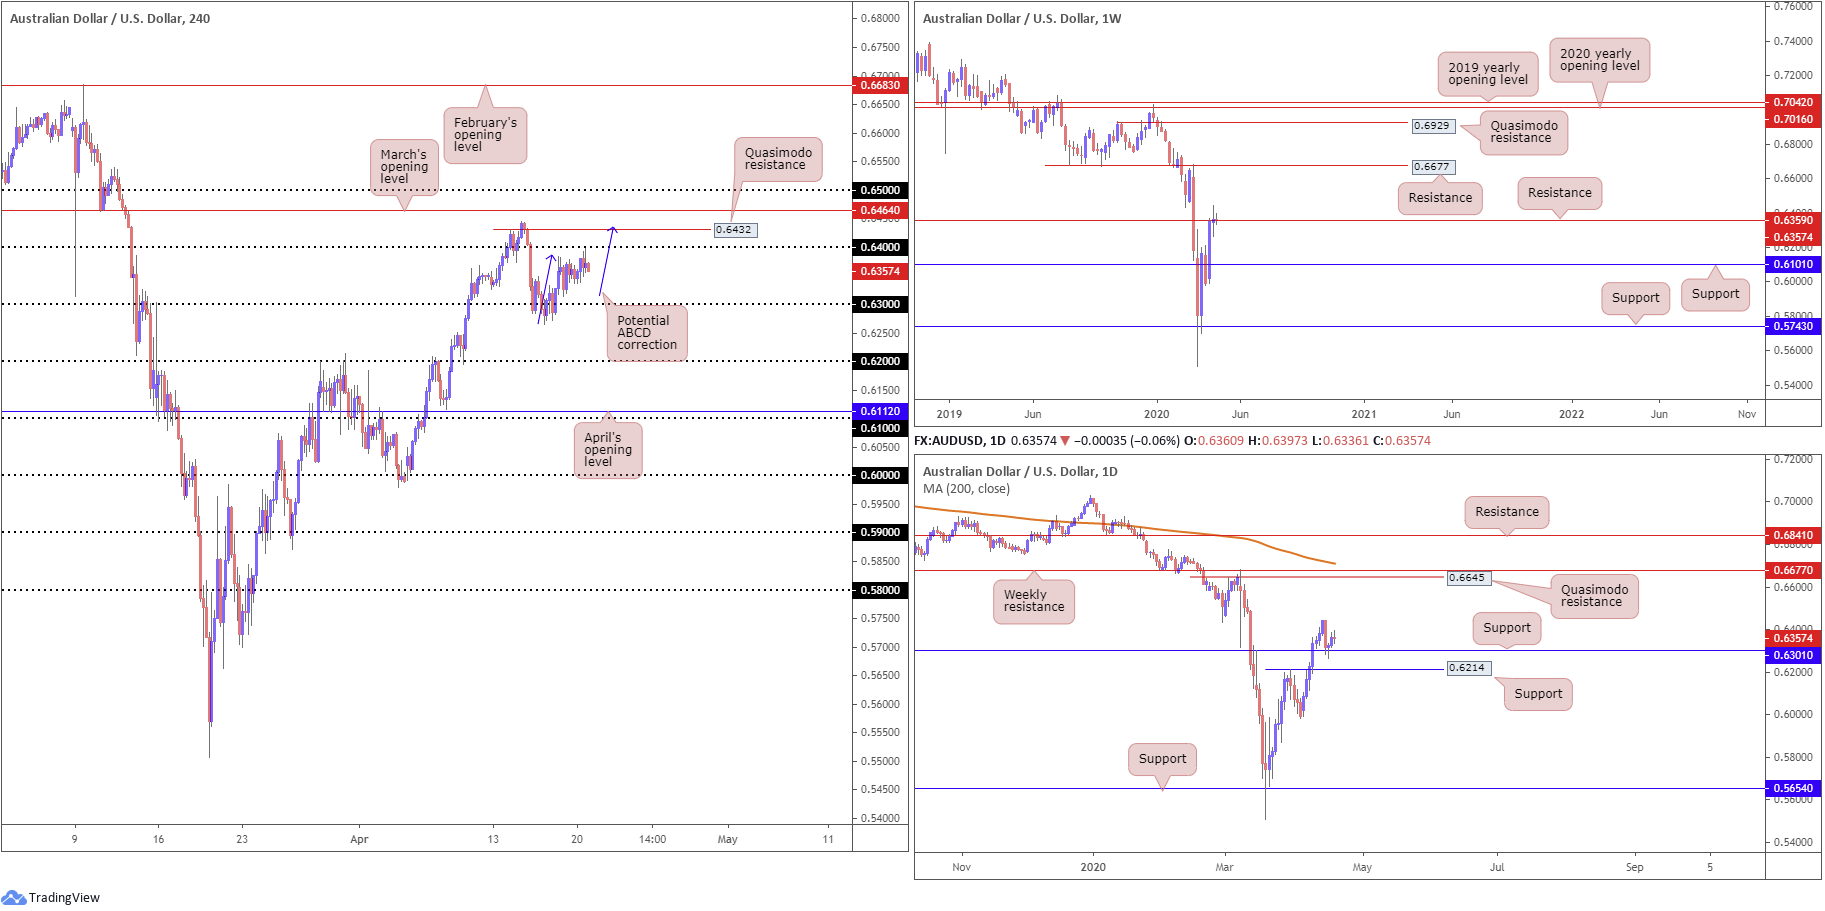
The Australian dollar latched onto a modest bid against the buck Monday, scoring session highs 3 points off 0.64. Above the said round number, Quasimodo resistance is seen at 0.6432, followed by March’s opening level at 0.6464. Note also a potential ABCD correction (blue arrows) may terminate around the said Quasimodo base.
With reference to the weekly timeframe, the pair is seen chewing on resistance from 0.6359. Key support rests at 0.6101, while a move higher has resistance priced in at 0.6677.
From the daily timeframe, last week had gains capped around 0.6443, guiding daily flow to support at 0.6301 which, as you can see, held in the shape of a hammer candlestick pattern Thursday. With the bullish signal along with the help of USD selling, Friday witnessed a modest recovery to highs at 0.6385. Monday, nonetheless, was relatively undecided, shaped by way of a doji candle.
Areas of consideration:
H4 Quasimodo resistance at 0.6432 echoes intraday strength. Not only does it come together with a H4 ABCD pattern, buy stops above 0.64 will likely provide liquidity to sell into. Short sellers off 0.6432, therefore, may position stop-loss orders above March’s opening level at 0.6464 and target waters beyond 0.6366.
A retest at 0.63 may also be of significance this week due to the round number converging with daily support plotted at 0.6301.
USD/JPY:
USD/JPY traded with a mild positive bias in the early hours of the open Monday, though levelled off around 107.95ish heading into Europe. All in all, it was a pretty monotonous session, therefore much of the following will echo a similar vibe to Monday’s technical analysis.
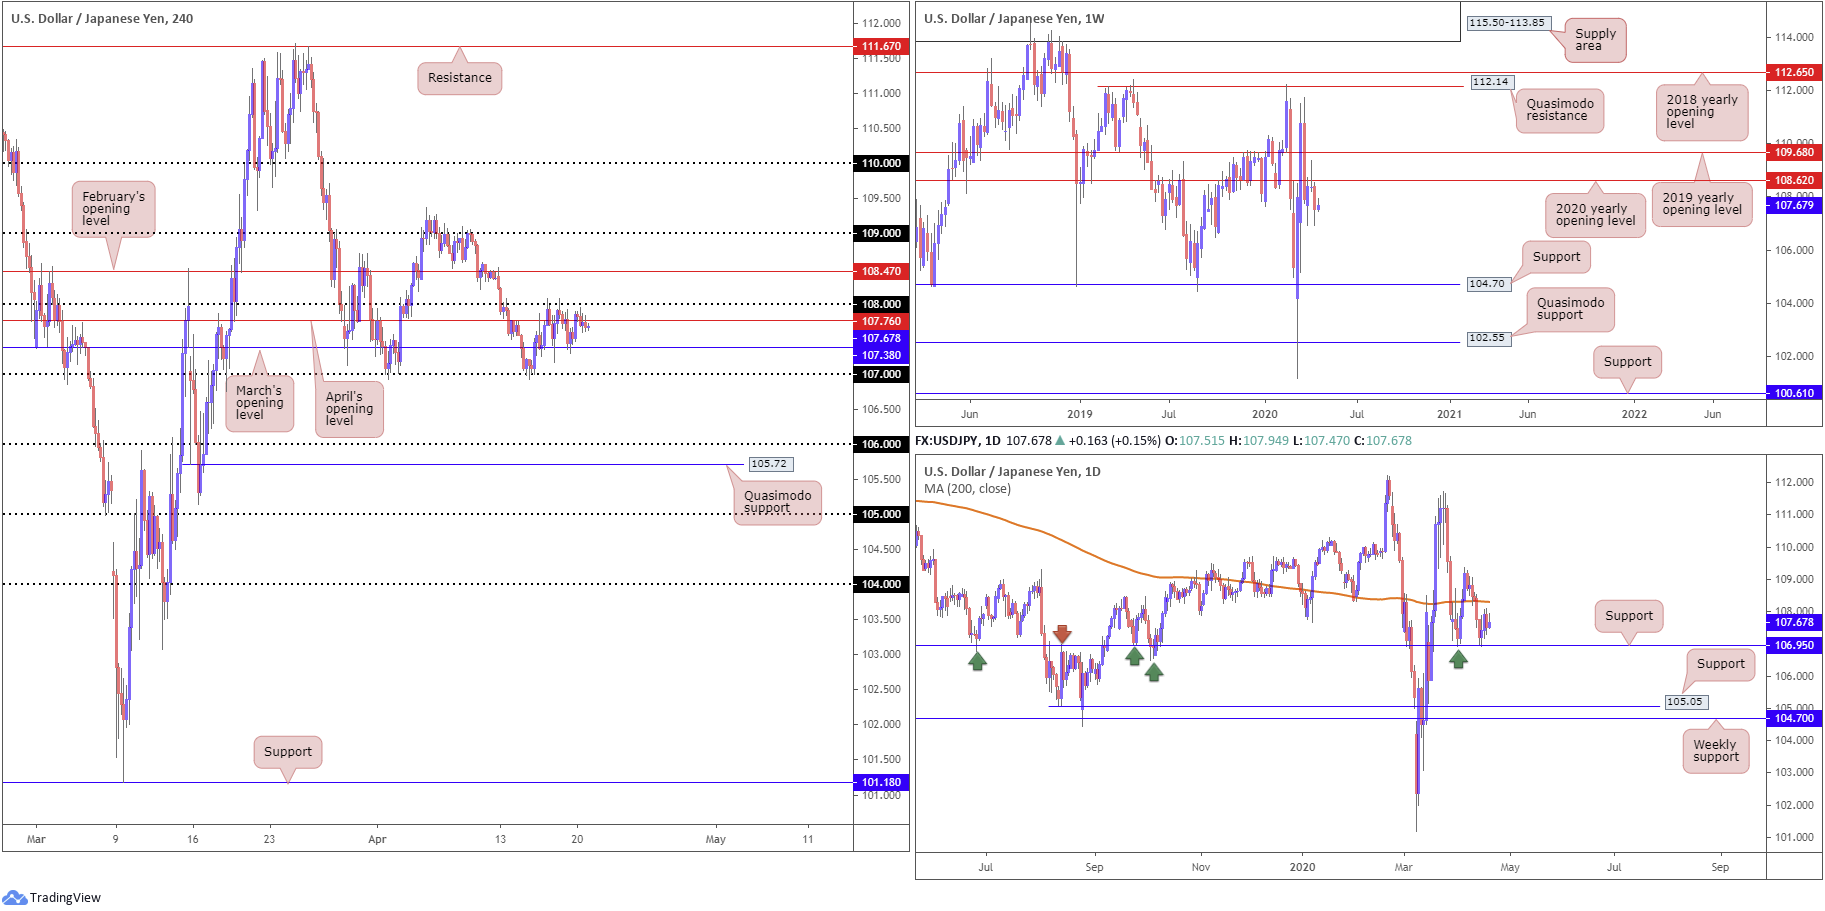
Since Thursday, the H4 candles have been busy carving out a consolidation between the 108 handle and March’s opening level at 107.38 (note in between this range we also have April’s opening level at 107.76 present). 107 is seen as viable support outside of the consolidation, along with February’s opening level at 108.47 as resistance.
The vibe on the weekly timeframe continues to represent a bearish tone. Price action recently produced a clear-cut shooting star candlestick configuration off the 2020 yearly opening level at 108.62, with last week putting in a strong follow-through move to the downside to lows of 106.92. The next support target is not seen until 104.70. Note this figure also represents the lower boundary of a multi-month range between Quasimodo resistance at 112.14.
Daily support at 106.95 made an appearance mid-week and held ground. The 200-day SMA (orange – 108.30) stands as possible resistance this week, whereas a break through 106.95 could land the 105.05 support in the mix, followed by weekly support highlighted above at 104.70.
Areas of consideration:
Traders may wish to acknowledge 107 aligns closely with daily support at 106.95, while February’s opening level at 108.47 comes in closely with the 200-day SMA at 108.30.
Weekly price suggesting lower levels certainly places a question mark on further gains above 108, though if we’re able to reach 108.47, active sellers are likely to enter the fray. The combination of daily support at 106.95 and 107 may also spark a reaction if tested.
USD/CAD:
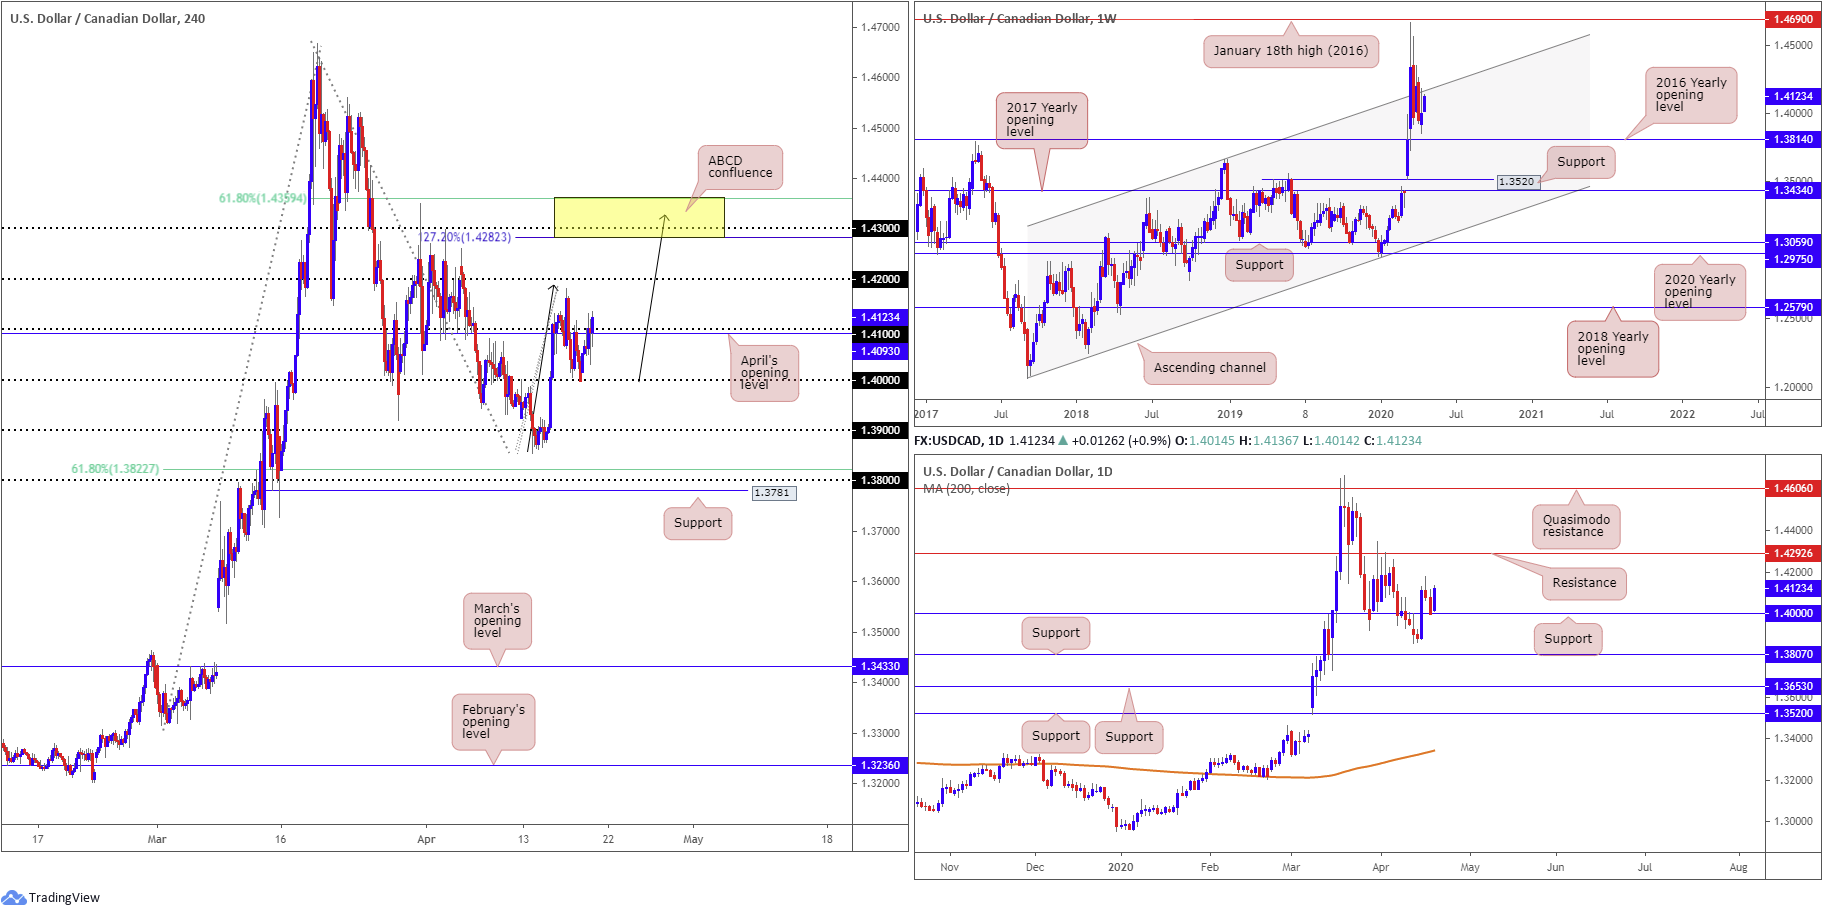
A relatively broad pickup in USD demand as well as a slump in oil prices provided fresh impetus to USD/CAD Monday. Adding more than 120 points on the session, the H4 candles crossed above April’s opening level at 1.4093 and 1.41, with eyes on last Thursday’s high at 1.4182 as the next upside objective, shadowed by the 1.42 base. Interestingly, above this area we have the 1.43 handle surrounded by an ABCD (black arrows) 127.2% Fibonacci extension at 1.4282 and a 61.8% Fibonacci retracement at 1.4359 (yellow).
Over on the weekly timeframe, price is seen nearing long-term channel resistance, extended from the high 1.3661. This follows a near-test of the 2016 yearly opening level at 1.3814. the story on the daily timeframe, on the other hand, has the unit rebounding from support at 1.4000 with further buying potentially drawing in resistance stationed at 1.4292.
Areas of consideration:
While the break above 1.41 is likely to be considered a bullish indicator, weekly structure reveals a potential ceiling in the form of a channel resistance around 1.4160ish. Therefore, breakout buyers may wish to take this into account before pulling the trigger.
Another scenario worthy of note is a potential reversal out of 1.4359/1.4283 on the H4 timeframe. Not only does this base house H4 confluence, daily resistance at 1.4292 adds weight to its bearish presence.
USD/CHF:
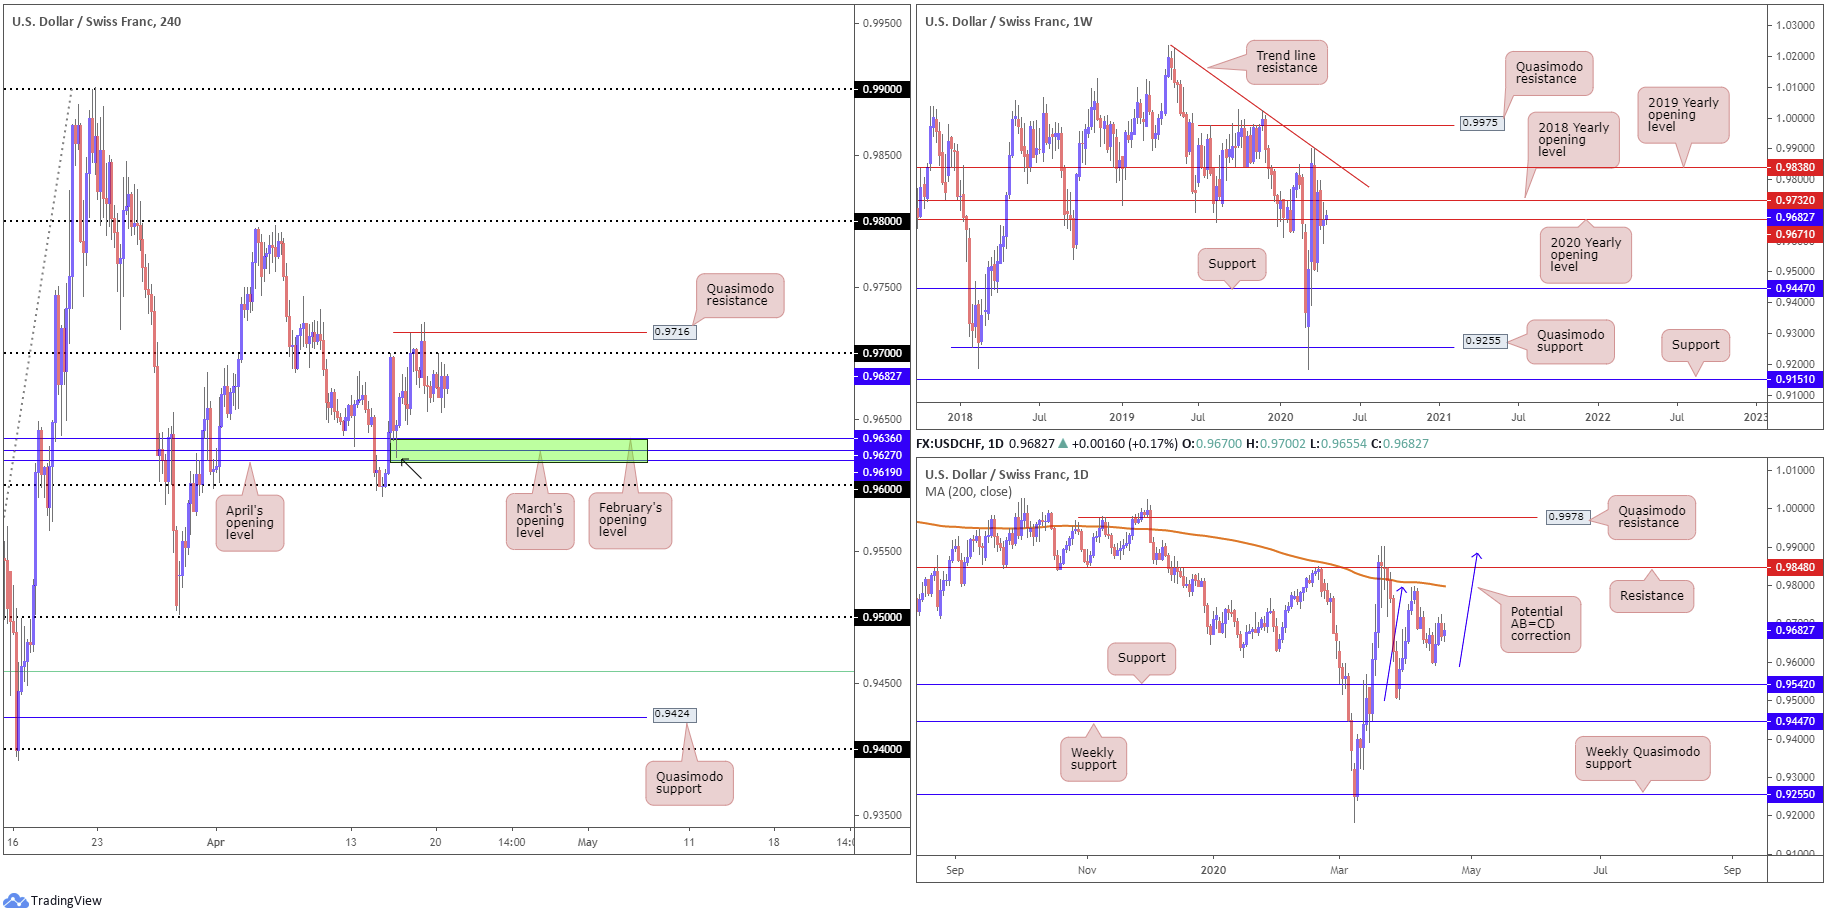
The US dollar concluded a shade higher against the Swiss franc Monday, though remained languishing south of the 0.97 handle. Recent movement on the H4 also chalked up a Quasimodo resistance at 0.9716, which could play a role in price movement sometime today. To the downside, 0.9619/0.9636, an area made up of April, March and February’s opening levels, is also perhaps on the radar today, in light of last Wednesday’s healthy recovery from the zone (black arrow). Another essential point to consider here, however, is the possibility of a fakeout through 0.9619/0.9636 to 0.96.
Further afield on the weekly timeframe, the unit trades around the 2020 yearly opening level at 0.9671, with last week’s high at 0.9724 almost drawing in the 2018 yearly opening level at 0.9732 (the next upside target). Interestingly, should sellers hold ground this week, this may be enough to light up support at 0.9447.
The daily timeframe, as of the current close, offers little in terms of support or resistance. To the upside, resistance is unlikely to emerge until reaching the 200-day SMA (orange – 0.9799), accompanied by 0.9848 and a potential AB=CD correction (blue arrows) at 0.9886. Lower on the curve we have support priced in at 0.9542, situated just ahead of weekly support emphasised above at 0.9447.
Areas of consideration:
For those who read Friday’s technical briefing you may recall the following point (italics):
One possible scenario worthy of attention is a fakeout above 0.97, followed by a test of 0.9732 and a dip back beneath 0.97. Likely fuelled on the back of buy-stop liquidity above 0.97 and weekly sellers, we may see a wave of selling materialise.
Price came within eight points of tagging the 2018 yearly opening level at 0.9732 on the weekly timeframe before spiralling south Friday. Although some traders may have still caught this move, a fakeout through 0.97 to 0.9732 still remains a potential setup going forward (despite H4 Quasimodo resistance at 0.9716).
Moves out of 0.9619/0.9636 are also a possibility, though do bear in mind that not only does this area carry limited higher-timeframe confluence, there is a strong possibility of a whipsaw to 0.96 before buyers step in, if at all.
Dow Jones Industrial Average:
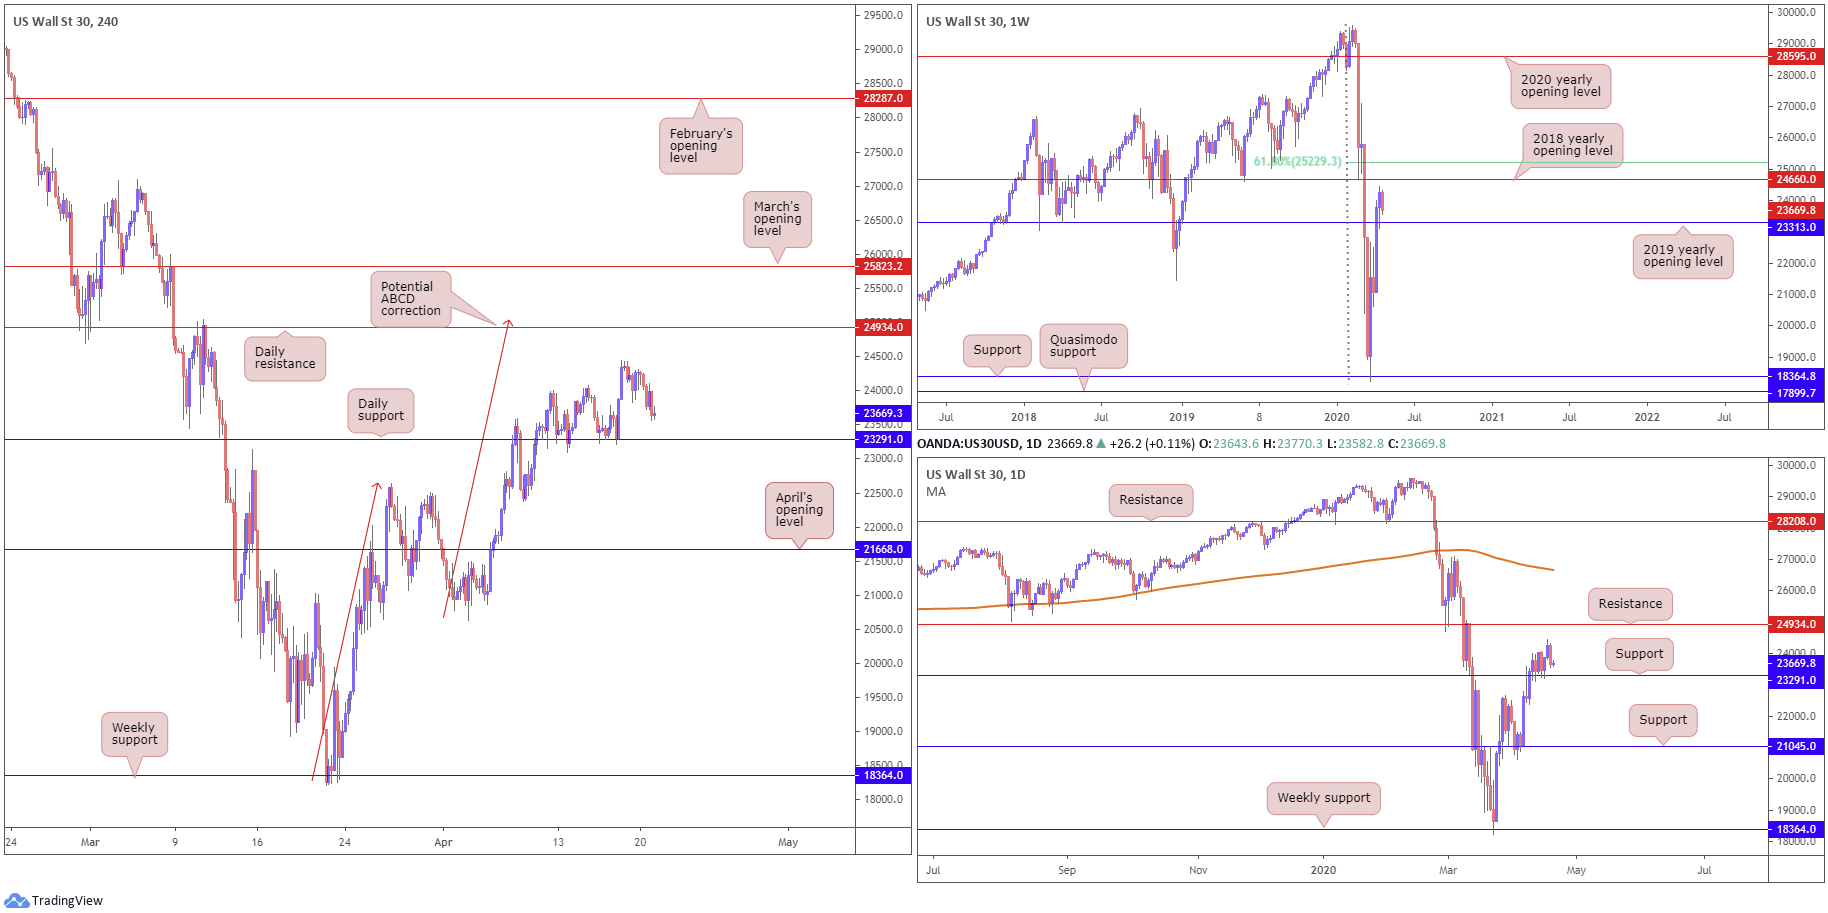
Major US benchmarks kicked off the week lower as oil futures crashed. The Dow Jones Industrial Average erased 592.05 points, or 2.44%; the S&P 500 also lost 51.40 points, or 1.79%, and the tech-heavy Nasdaq 100 concluded lower by 105.90 points, or 1.20%.
Consequently, Monday’s dip has sited the DJIA back within touching distance of daily support at 23291, a level that withstood a number of downside attempts last week. What’s also notable here is the weekly timeframe’s 2019 yearly opening level at 23313 sited close by. To the upside, daily price has resistance at 24934 which merges closely with an ABCD correction (red arrows) at 25030 seen on the H4 timeframe.
Areas of consideration:
In view of the technical picture presented here, daily support at 23291 and the 2019 yearly opening level on the weekly timeframe at 23313 denote a potential buy zone today, with an ultimate upside target set at daily resistance from 24934. This area can also be considered a possible reversal zone, owing to H4 ABCD convergence.
XAU/USD (GOLD):
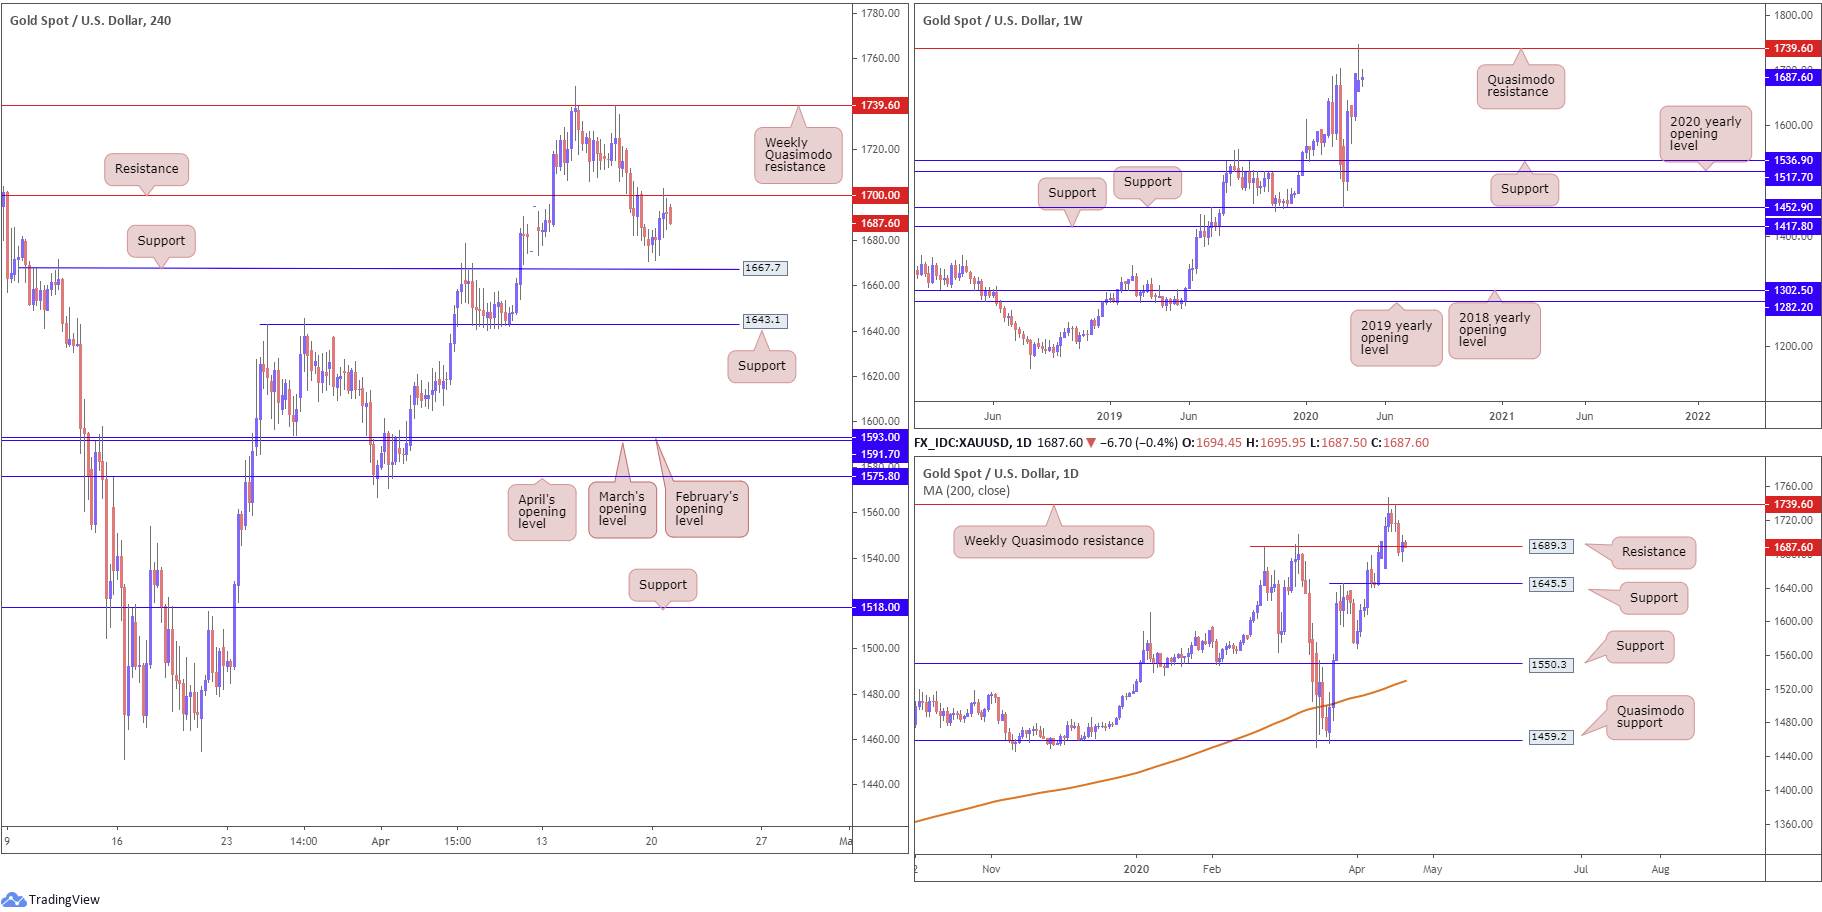
Price entered the week latching onto a modest bullish vibe as risk-off flows provided fresh impetus. As evident from the H4 timeframe, bullion advanced and retested resistance at 1700.0, which, in the form of back-to-back doji indecision candles, is currently holding ground. Neighbouring support is seen at 1667.7, with a break exposing another layer of support at 1643.1. Above 1700.0, on the other hand, we have weekly Quasimodo resistance on the radar at 1739.6.
On note of the weekly timeframe, technical research shows last week clocked highs at 1747.7, levels not seen since November 2012, and concluded shaped as a clear-cut shooting star candlestick pattern (considered a bearish signal) off Quasimodo resistance at 1739.6. This will likely excite candlestick enthusiasts, with some perhaps setting sell-stop entry orders south of last week’s low 1663.0. In terms of support on the weekly scale, the river appears relatively ‘ripple free’ until reaching support at 1536.9.
Looking at gold from a daily viewpoint, resistance at 1689.3 remains in the fold. Buyers are clearly fragile here, emphasising the possibility of a decline to support at 1645.5.
Areas of consideration:
Weekly price bringing in Quasimodo resistance and forming a strong bearish candlestick signal, as well as daily action emphasising the possibility of striking 1645.5, could see the H4 candles hold the retest off 1700.0 for a second time and take a run at (and likely break) support at 1667.7.
Conservative traders may opt to wait and see if a H4 bearish candlestick forms off 1700.0 before pulling the trigger.
The accuracy, completeness and timeliness of the information contained on this site cannot be guaranteed. IC Markets does not warranty, guarantee or make any representations, or assume any liability regarding financial results based on the use of the information in the site.
News, views, opinions, recommendations and other information obtained from sources outside of www.icmarkets.com.au, used in this site are believed to be reliable, but we cannot guarantee their accuracy or completeness. All such information is subject to change at any time without notice. IC Markets assumes no responsibility for the content of any linked site.
The fact that such links may exist does not indicate approval or endorsement of any material contained on any linked site. IC Markets is not liable for any harm caused by the transmission, through accessing the services or information on this site, of a computer virus, or other computer code or programming device that might be used to access, delete, damage, disable, disrupt or otherwise impede in any manner, the operation of the site or of any user’s software, hardware, data or property.


