
EUR/USD:
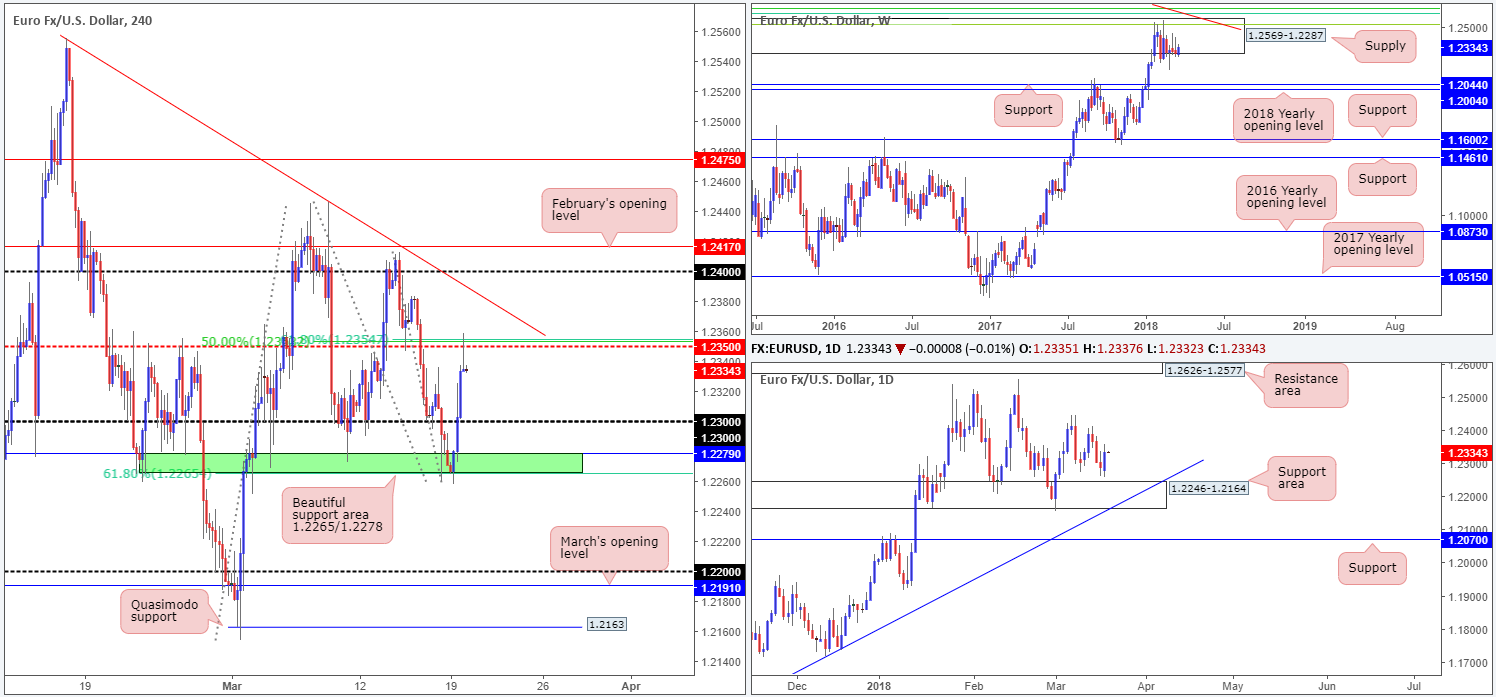
EUR/USD bulls went on the offensive during the course of Monday’s sessions, after sources reported that the ECB is comfortable with the market pricing a first rate hike in Q2 2019, as quantitative easing should end in 2018.
This led to a break of 1.23 handle on the H4 timeframe, followed by continued bidding up to the H4 mid-level resistance at 1.2350 (merges with a 61.8% H4 Fib resistance at 1.2354 and a 50.0% resistance value at 1.2353). As you can see, though, the unit mildly pared gains into the close in the shape of a nice-looking H4 bearish selling wick.
The story on the bigger picture shows that weekly price remains trading within the walls of a major-league weekly supply zone coming in at 1.2569-1.2287, and has done for the past two months! Should sellers eventually crank it up a gear, price could shake hands with the weekly support at 1.2044, followed closely by the 2018 yearly opening level at 1.2004. Daily price, on the other hand, recently printed a firm bottom just north of a daily support area at 1.2246-1.2164 molded in the shape of a daily bullish engulfing candle.
Potential trading zones:
Selling the recently formed H4 bearish selling wick, given the current H4 resistance, could be an option this morning. In doing so, though, remember that you are effectively selling into a daily bullish engulfing pattern. With that said, selling pressure within the aforementioned weekly supply likely has your back!
Downside targets fall in at 1.23, followed then by a beautiful H4 support area seen at 1.2265/1.2279, and then quite possibly the top edge of the noted daily support area at 1.2246.
Data points to consider: German ZEW economic sentiment at 10am GMT.
Areas worthy of attention:
Supports: 1.2265/1.2278; 1.23; 1.2246-1.2164; 1.2004/1.2044.
Resistances: 1.2350; 1.2354/23; 1.2569-1.2287.
GBP/USD:
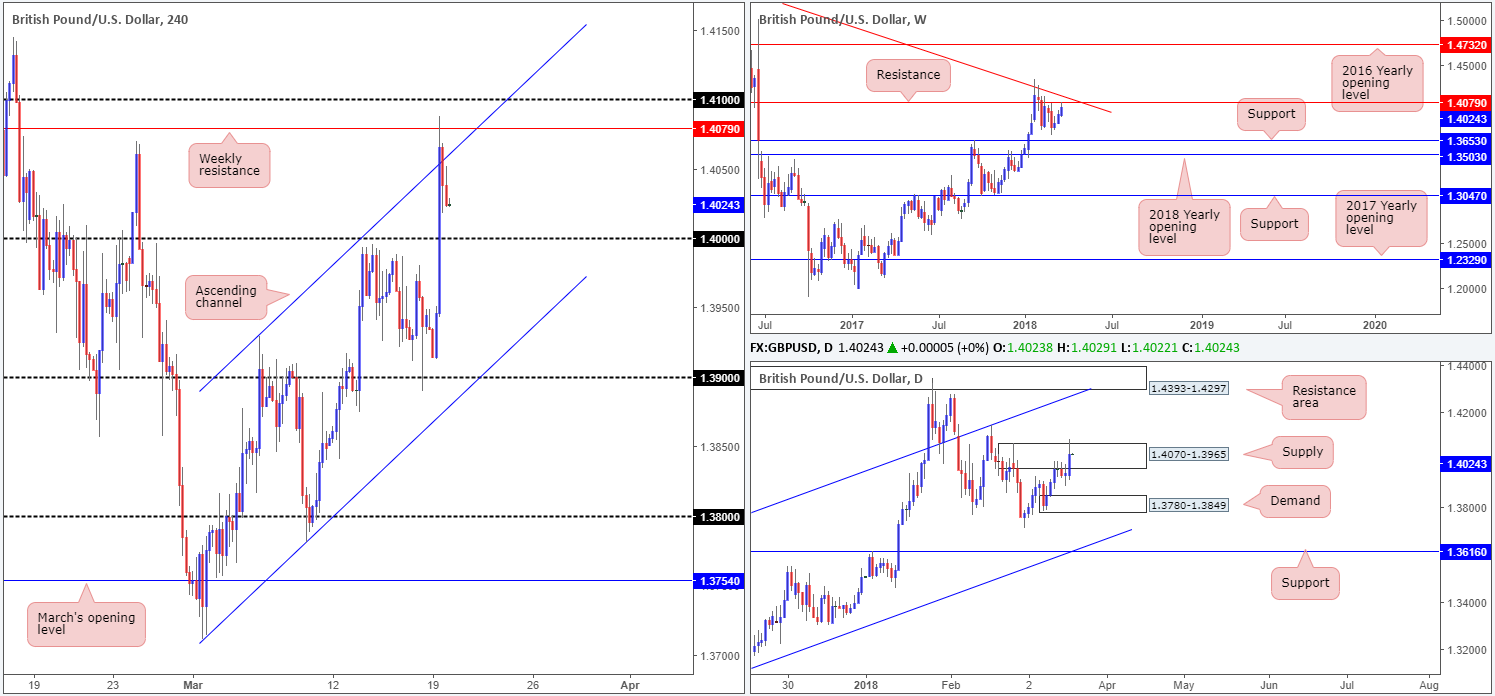
The British pound made considerable ground against its US counterpart on Monday, following news that the UK and EU had provisionally agreed a transition deal. H4 price sliced through the key 1.40 barrier, and also whipsawed through a H4 ascending channel resistance line (taken from the high 1.3929) to a session high of 1.4088.
What’s interesting here is that the pair met strong selling at a weekly resistance level drawn from 1.4079, consequently paring a reasonable portion of gains. Also noteworthy is stop-loss orders above daily supply at 1.4070-1.3965 were likely triggered amid yesterday’s movement.
This has, as you can see, placed H4 action back within striking distance of the 1.40 level.
Potential trading zones:
1.40 is a level that stands out on the H4 timeframe this morning, largely due to being a widely watched number. Furthermore, this level suffered a decisive break yesterday which likely resulted in unfilled buy orders.
However, the team has noted not to expect much more than a bounce to materialize from here, due to potential selling pressure coming from the current weekly resistance level.
To avoid stops being tripped on a fakeout through 1.40, you may want to consider waiting for additional confirmation, preferably on the lower timeframes as this will help achieve better risk/reward. If you do happen to pin down a position on the lower timeframes, we believe its best practice to seek intraday targets on your traded timeframe, particularly when expecting only a bounce.
Data points to consider: UK inflation figures at 9.30am GMT.
Areas worthy of attention:
Supports: 1.40.
Resistances: 1.4070-1.3965; 1.4079.
AUD/USD:
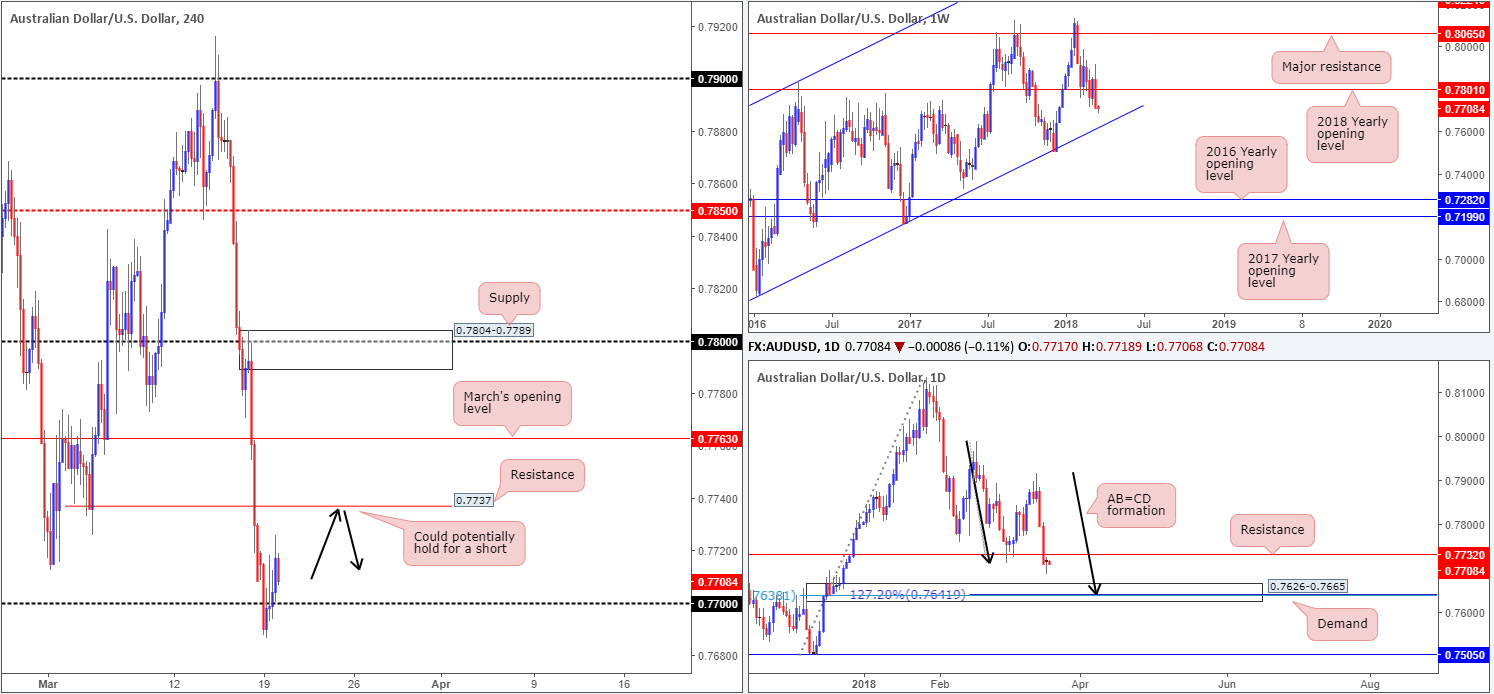
For the most part it was a reasonably quiet Monday for the Australian dollar. H4 movement breached the nearby 0.77 handle in early trading hours, but quickly bottomed around the 0.7687 mark. The commodity currency then reclaimed 0.77 and tapped a session high of 0.7725.
Last week’s sessions saw the Aussie suffer a substantial decline in value. Not only did weekly price close below the 2018 yearly opening level at 0.7801, it did so in the shape of a weekly bearish engulfing candle that closed on its lows! The move, as you can see, has firmly placed the long-term weekly channel support (0.6827) in the firing range.
On the daily timeframe, last week’s move engulfed daily support at 0.7732 and possibly set the stage for a continuation move down to daily demand at 0.7626-0.7665 this week. Traders may have also noticed that this daily area of demand houses a 78.6% daily Fib retracement value at 0.7638 and a daily AB=CD (see black arrows) 127.2% Fib ext. point at 0.7641. Though this area is plotted just north of the aforesaid weekly channel support, a bounce from this angle is expected.
Potential trading zones:
Given the recent break of 0.77 (indicates possible weakness) the team has noted the H4 resistance level at 0.7737 as a possible reversal zone this morning. Seeing as 0.7737 merges closely with daily resistance at 0.7732, a short from here will likely target the top edge of the current daily demand at 0.7665.
Data points to consider: AUD monetary policy meeting minutes at 12.30am; RBA Assist Gov. Bullock speaks at 4.15am GMT.
Areas worthy of attention:
Supports: 0.77; 0.7626-0.7665; weekly channel support.
Resistances: 0.7737; 0.7732; 0.7801.
USD/JPY:
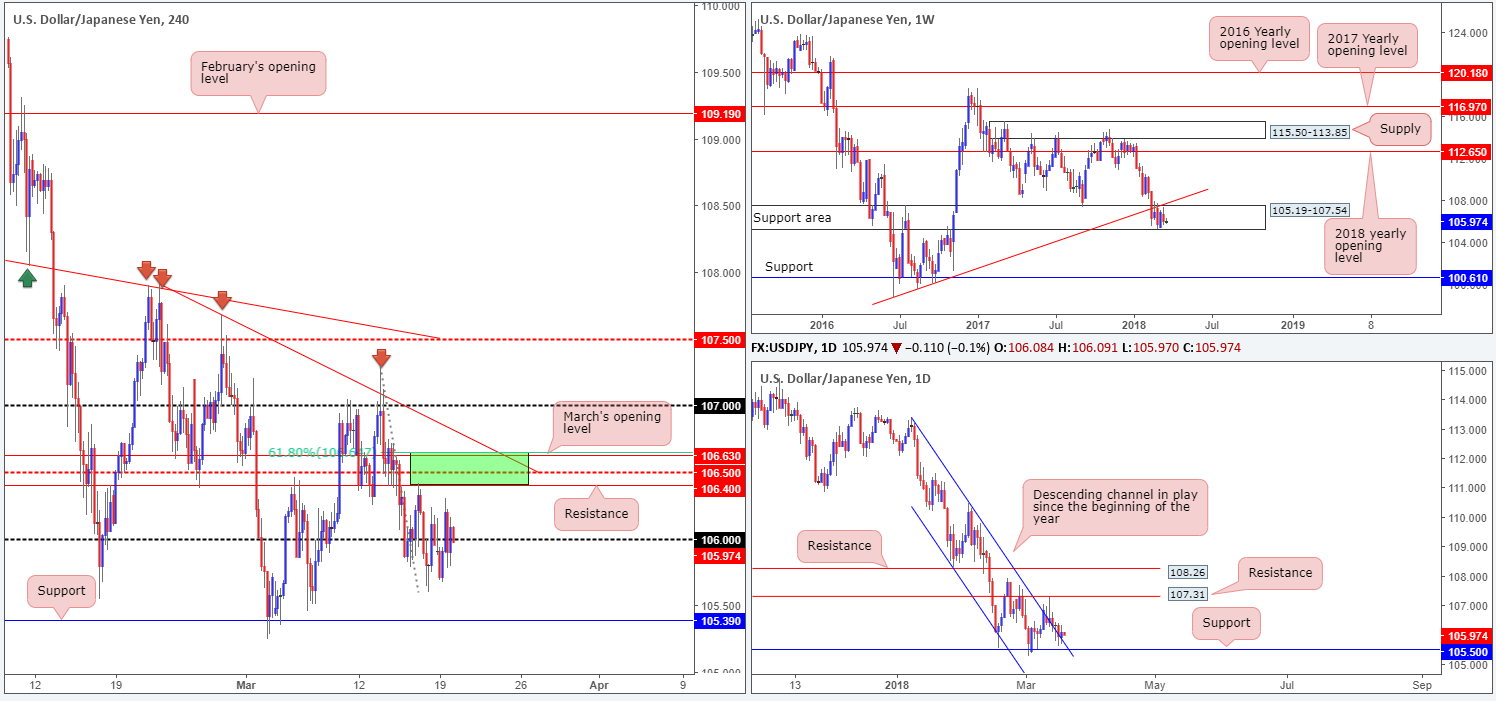
Despite US equity markets extending losses on Monday, the USD/JPY managed to chalk up marginal gains. USD/JPY traders appear to be reluctant to commit ahead of the next big risk event: the highly anticipated FOMC monetary policy decision on Wednesday.
From a technical perspective, weekly price remains confined between a weekly support area pegged at 105.19-107.54, and a nearby weekly trendline support-turned resistance (etched from the low 98.78). Daily flow, however, continues to grind alongside a daily channel resistance line taken from the high 113.38, seen just north of a daily support level penciled in at 105.50.
Potential trading zones:
106.64/106.40 marked in green on the H4 timeframe remains an interesting area of resistance (comprised of a 61.8% H4 Fib resistance at 106.64, March’s opening level at 106.63, a H4 mid-level resistance at 106.50 and a H4 resistance at 106.40). Despite its surrounding confluence, nonetheless, traders should note that the area houses no higher-timeframe resistance, and therefore may only produce an intraday bounce at best.
Downside targets for those considering shorts fall in at the 106 handle, the daily support level mentioned above at 105.50, followed closely by H4 support at 105.39.
Data points to consider: No high-impacting news events on the docket today.
Areas worthy of attention:
Supports: 105.19-107.54; 105.50; 105.39.
Resistances: 106.64/106.40; 106; daily channel resistance; weekly trendline resistance.
USD/CAD:
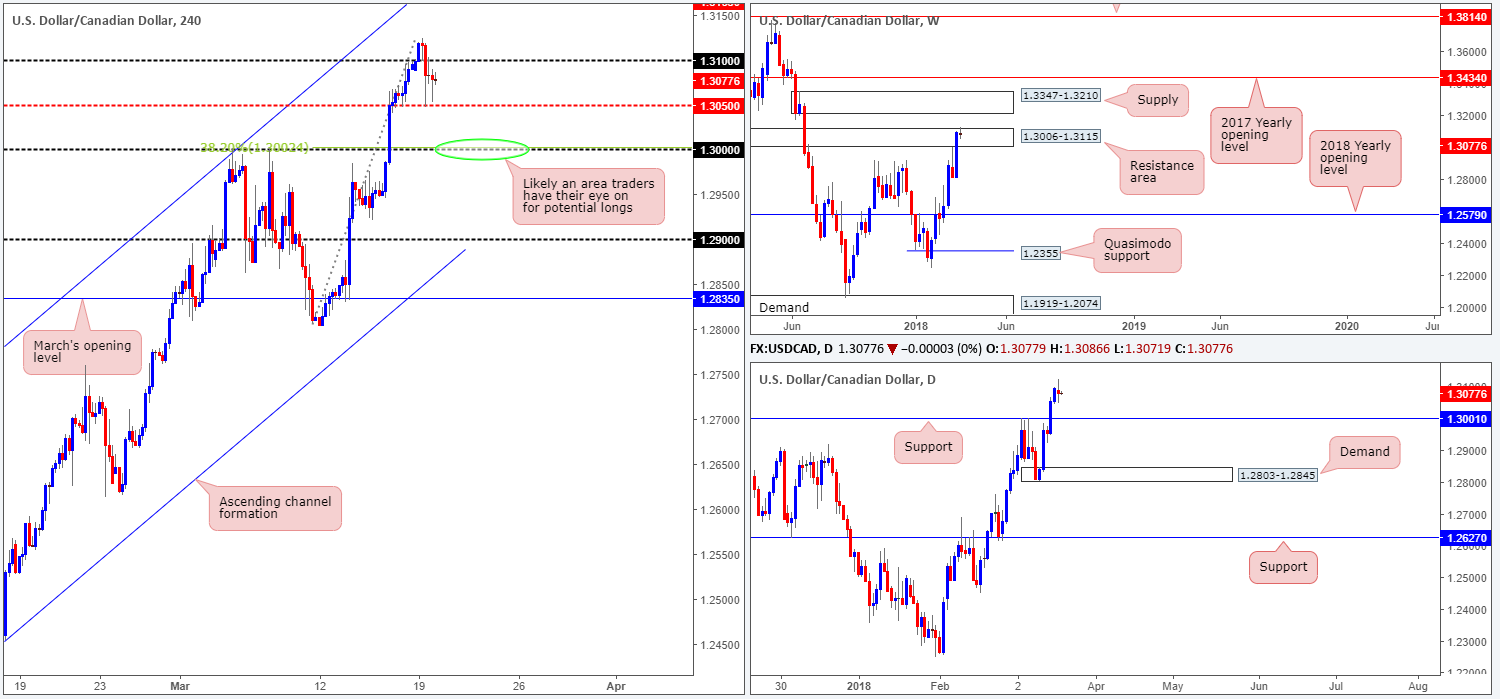
In recent trading, the USD/CAD failed to sustain gains beyond the 1.31 handle on the H4 timeframe. The Canadian dollar caught fresh bids following positive comments from Canadian finance minister Morneau concerning NAFTA talks. The pair probed lower levels, though support around the H4 mid-way point 1.3050 remained strong.
Weekly action continues to loiter around the upper limit of a weekly resistance area coming in at 1.3006-1.3115. Further buying from here could eventually see the unit test weekly supply drawn from 1.3347-1.3210. Looking down to the daily timeframe, however, the team has noted that upside is relatively free to approach a daily resistance level at 1.3207 this week (positioned just ahead of the weekly supply area mentioned above at 1.3347-1.3210). Also worthy of note is the recently formed daily indecision candle.
Potential trading zones:
A break of 1.3050 could lead to an approach down to the 1.30 handle. This number, given its relationship with daily support at 1.3001 and a 38.2% H4 Fib support, is likely in the firing range for potential longs for many traders this morning.
The ultimate target from 1.30 would be the daily resistance mentioned above at 1.3207. This would, however, entail weekly sellers giving up the current weekly resistance area! Therefore, trailing the position using H4 support/resistances is, we believe, the best approach here.
Data points to consider: No high-impacting news events on the docket today.
Areas worthy of attention:
Supports: 1.30; 1.3050; 1.3001.
Resistances: 1.3006-1.3115; 1.3207; 1.3347-1.3210; 1.31 handle.
USD/CHF:
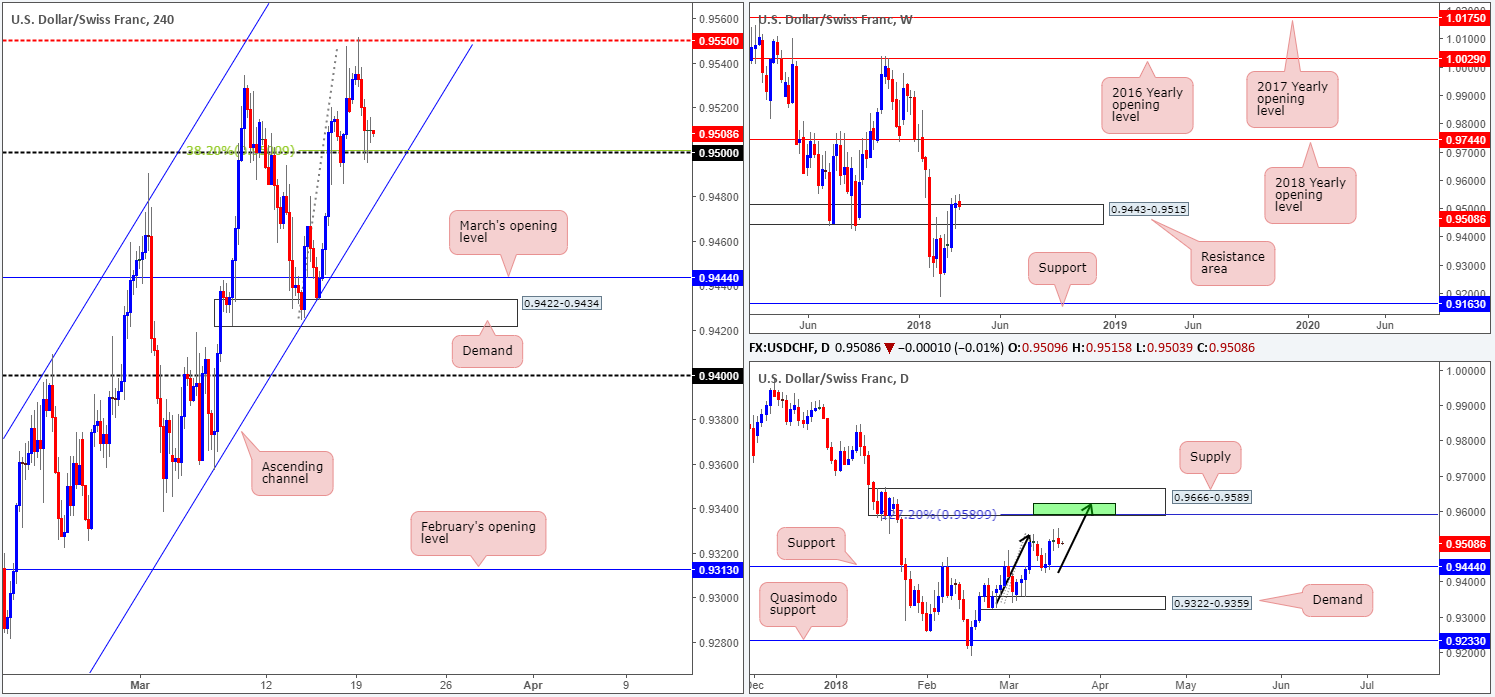
On the back of a weaker dollar across the board, the USD/CHF pressed south in recent trade. Despite this, the unit remains within its H4 ascending channel (0.9187/0.9409) and ahead of the 0.95 handle, which happens to converge nicely with a 38.2% H4 Fib support. Is 0.95, which has already held firm as support, worthy of a long? According to the daily timeframe, further upside is likely. Following a firm retest of daily support at 0.9444, this has potentially set the stage for a move up to daily supply pegged at 0.9666-0.9589. Also notable from a technical perspective is the AB=CD (see black arrows and green zone) 127.2% daily Fib ext. point which coincides with the lower edge of the aforesaid daily supply. We also like the fact that the pair is seen trading marginally above a weekly resistance area printed at 0.9443-0.9515. Given the minor topside breach here, traders may want to pencil in the 2018 yearly opening level at 0.9744 as the next upside objective.
Potential trading zones:
The H4 buying tails formed from 0.95 in recent hours is, we believe, a sign that buyers want to bring things back up to the H4 mid-level resistance at 0.9550. The next port of call beyond this number falls in at 0.9589.
Data points to consider: No high-impacting news events on the docket today.
Areas worthy of attention:
Supports: 0.95; H4 channel support; 0.9444.
Resistances: 0.9550; 0.9666-0.9589; 0.9744.
DOW 30:
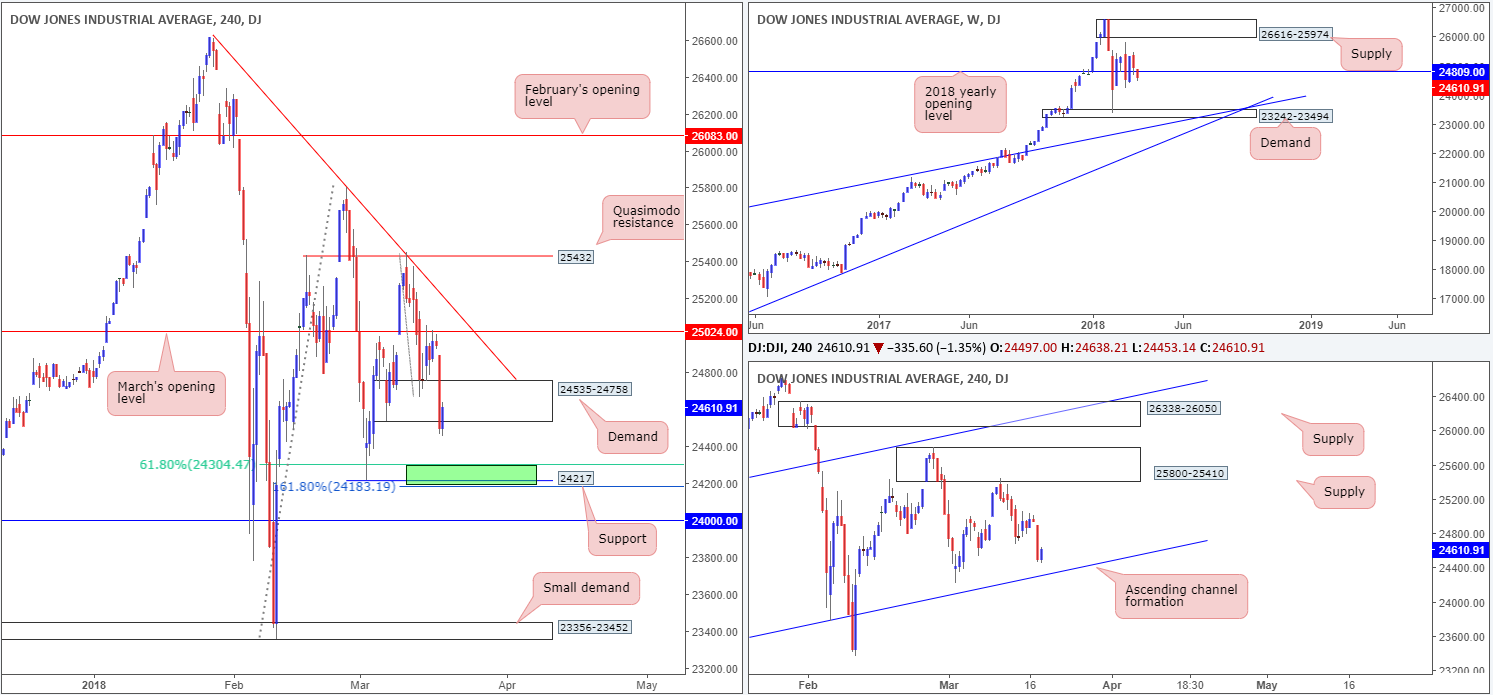
Risk-off sentiment saw stock indices drop on Monday, led by technology shares. Facebook (FB) was down heavily after a data breach, with Apple (AAPL) weighing on the tech sector after reports that it plans to develop its own micro LED screens.
H4 price action held form at March’s opening level drawn from 25024, and marginally squeezed longs out from H4 demand at 24535-24758. The stop-loss orders triggered by this move could potentially drag the index lower in today’s trade.
According to the daily timeframe, though, we could see active buyers sooner than expected. After responding beautifully to daily supply at 25800-25410 on Monday last week, the index is currently seen loitering within shouting distance of a daily channel support extended from the low 17883. Traders may have also witnessed weekly price sliding below the 2018 yearly opening level at 24809 on the weekly timeframe.
Potential trading zones:
Initial thoughts were to look for shorts beyond the current H4 demand area as this could trigger further selling. Caution is warranted here, though, since there’s only a few points space beyond the H4 demand before we reach the noted daily channel support, so you could potentially be selling into a strong layer of daily buyers!
A more exciting point of interest (shaded in green on H4 timeframe), however, can be seen at 24183/24304 (comprised of a161.8% Fib ext. at 24183, a swing H4 support at 24217 and a 61.8% Fib support at 24304), which, as far as we can see, intersects with the aforementioned daily channel support line. Longs from here, therefore, could be a consideration.
Data points to consider: No high-impacting news events on the docket today.
Areas worthy of attention:
Supports: 24183/24304; daily channel support.
Resistances: 25800-25410; 25024.
GOLD:
Using a top-down approach this morning, weekly movement is seen inching its way closer to the 2018 yearly opening level at 1302.5, which unites beautifully with a long-term weekly channel support etched from the low 1122.8. Looking over the daily timeframe, nevertheless, you’ll see that daily price remains fluctuating between a daily supply area at 1341.0-1333.1 and a daily support area marked in blue at 1308.4/1316.9, and has been since late February. In order for weekly action to test the noted 2018 yearly opening band, the current daily support area will have to have its lower edge taken out.
Influenced by a declining dollar, the H4 candles revisited March’s opening level at 1317.2 on Monday which, for the most part, has held ground.
Potential trading zones:
Overall, we do believe that XAU/USD bulls have a slight edge, given both the daily support area and 2018 yearly opening line with weekly channel support. However, we will not be ‘fully’ convinced until a touch of the 2018 yearly level has been seen.
Selling from March’s opening level mentioned above on the H4 timeframe at 1317.2 may be of interest to some this morning. Although this could potentially work for an intraday bounce, you are effectively going up against daily buyers here! Therefore, it may be an idea to pass and wait for something more attractive.

Areas worthy of attention:
Supports: 1308.4/1316.9; 1302.5; weekly channel support.
Resistances: 1341.0-1333.1; 1317.2.
This site has been designed for informational and educational purposes only and does not constitute an offer to sell nor a solicitation of an offer to buy any products which may be referenced upon the site. The services and information provided through this site are for personal, non-commercial, educational use and display. IC Markets does not provide personal trading advice through this site and does not represent that the products or services discussed are suitable for any trader. Traders are advised not to rely on any information contained in the site in the process of making a fully informed decision.
This site may include market analysis. All ideas, opinions, and/or forecasts, expressed or implied herein, information, charts or examples contained in the lessons, are for informational and educational purposes only and should not be construed as a recommendation to invest, trade, and/or speculate in the markets. Any trades, and/or speculations made in light of the ideas, opinions, and/or forecasts, expressed or implied herein, are committed at your own risk, financial or otherwise.
The use of the site is agreement that the site is for informational and educational purposes only and does not constitute advice in any form in the furtherance of any trade or trading decisions.
The accuracy, completeness and timeliness of the information contained on this site cannot be guaranteed. IC Markets does not warranty, guarantee or make any representations, or assume any liability with regard to financial results based on the use of the information in the site.
News, views, opinions, recommendations and other information obtained from sources outside of www.icmarkets.com.au, used in this site are believed to be reliable, but we cannot guarantee their accuracy or completeness. All such information is subject to change at any time without notice. IC Markets assumes no responsibility for the content of any linked site. The fact that such links may exist does not indicate approval or endorsement of any material contained on any linked site.
IC Markets is not liable for any harm caused by the transmission, through accessing the services or information on this site, of a computer virus, or other computer code or programming device that might be used to access, delete, damage, disable, disrupt or otherwise impede in any manner, the operation of the site or of any user’s software, hardware, data or property.


