
Key risk events today:
China Caixin Manufacturing PMI; RBA Cash Rate and Rate Statement; Canada Manufacturing PMI; US ISM Manufacturing PMI.
(Previous analysis as well as outside sources – italics).
EUR/USD:
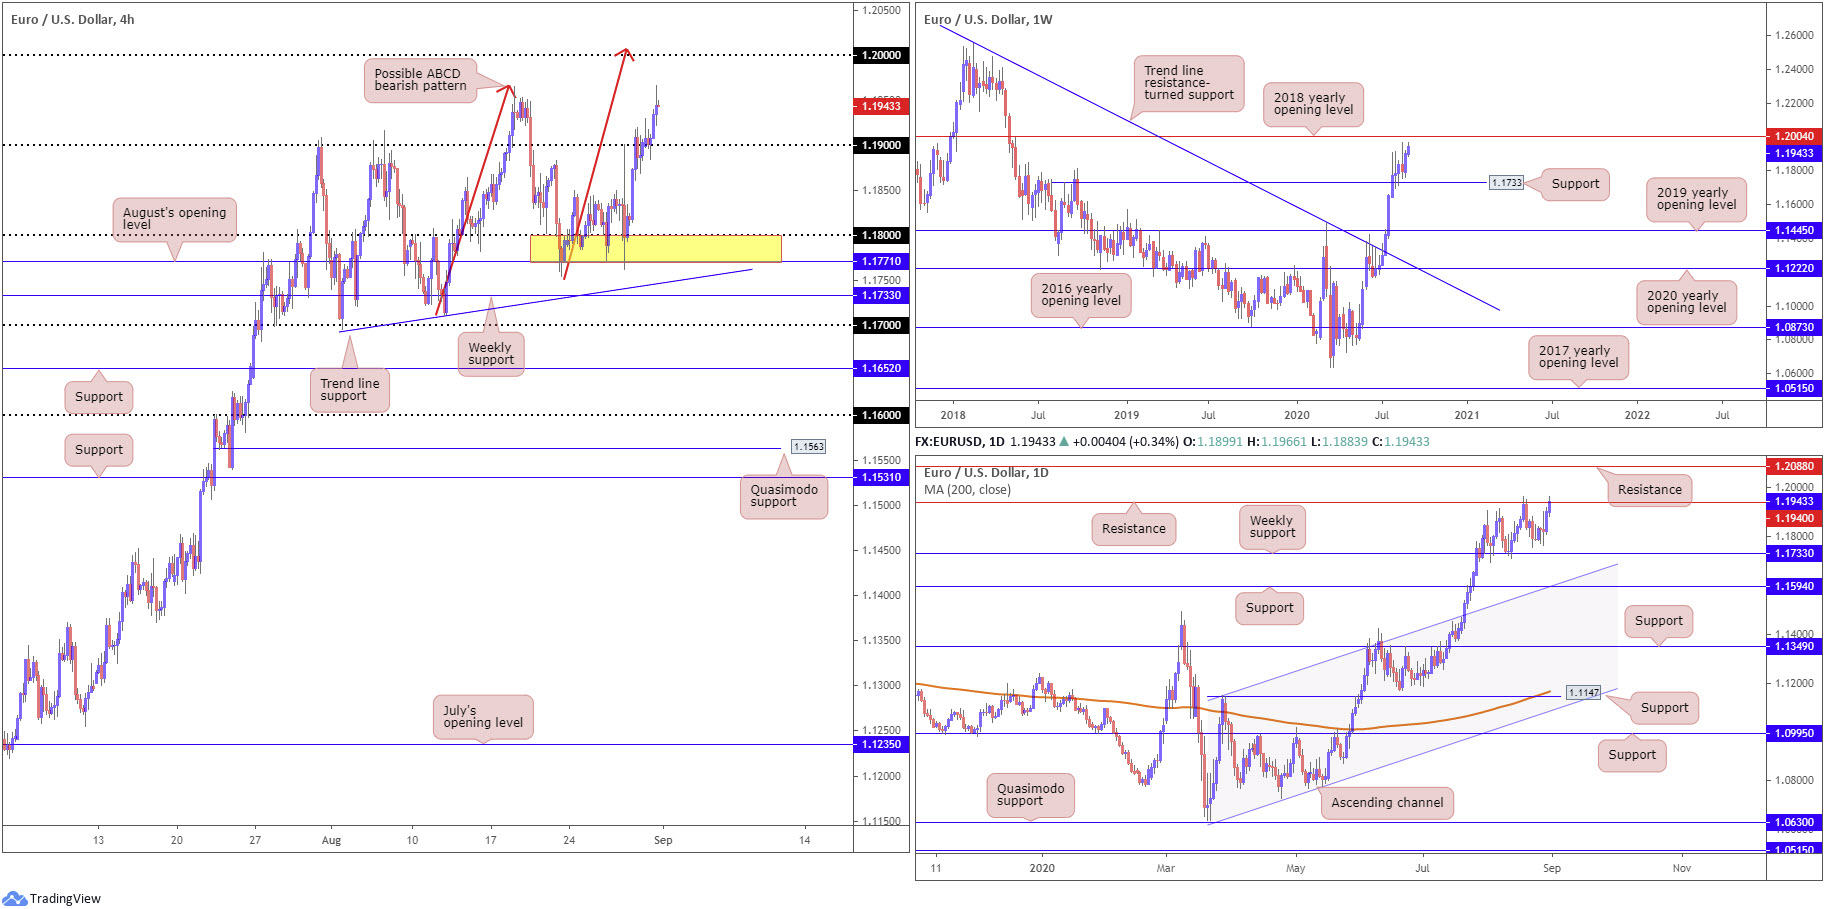
The euro continued to gain against the buck Monday as the DXY clocked fresh YTD lows at 91.99.
EUR/USD activity also matched its YTD pinnacle at 1.1965 (August 18) after establishing position above the 1.19 perimeter. Upside movement also shines the spotlight on the 1.20 figure, sharing the same space with a H4 ABCD bearish approach (red arrows) at 1.2007.
Recent trading on the weekly timeframe left support at 1.1733 unchallenged, a prior Quasimodo resistance level, and is currently poised to shake hands with the 2018 yearly opening level at 1.2004. While this may perhaps fill some intraday buyers with confidence to take on August 18 highs, we must also take into account that daily resistance made an appearance at 1.1940.
Areas of consideration:
The retest at 1.19 on the H4 was clearly of interest to buyers yesterday, sponsored by a half-hearted hammer candlestick formation (H4).
1.20 is likely a watched figure going forward, not only as a take-profit target for bullish themes from 1.19 (and any intraday breakout signals taken above 1.1965), but also as a potential reversal zone given the H4 ABCD confluence and weekly resistance at 1.2004.
GBP/USD:
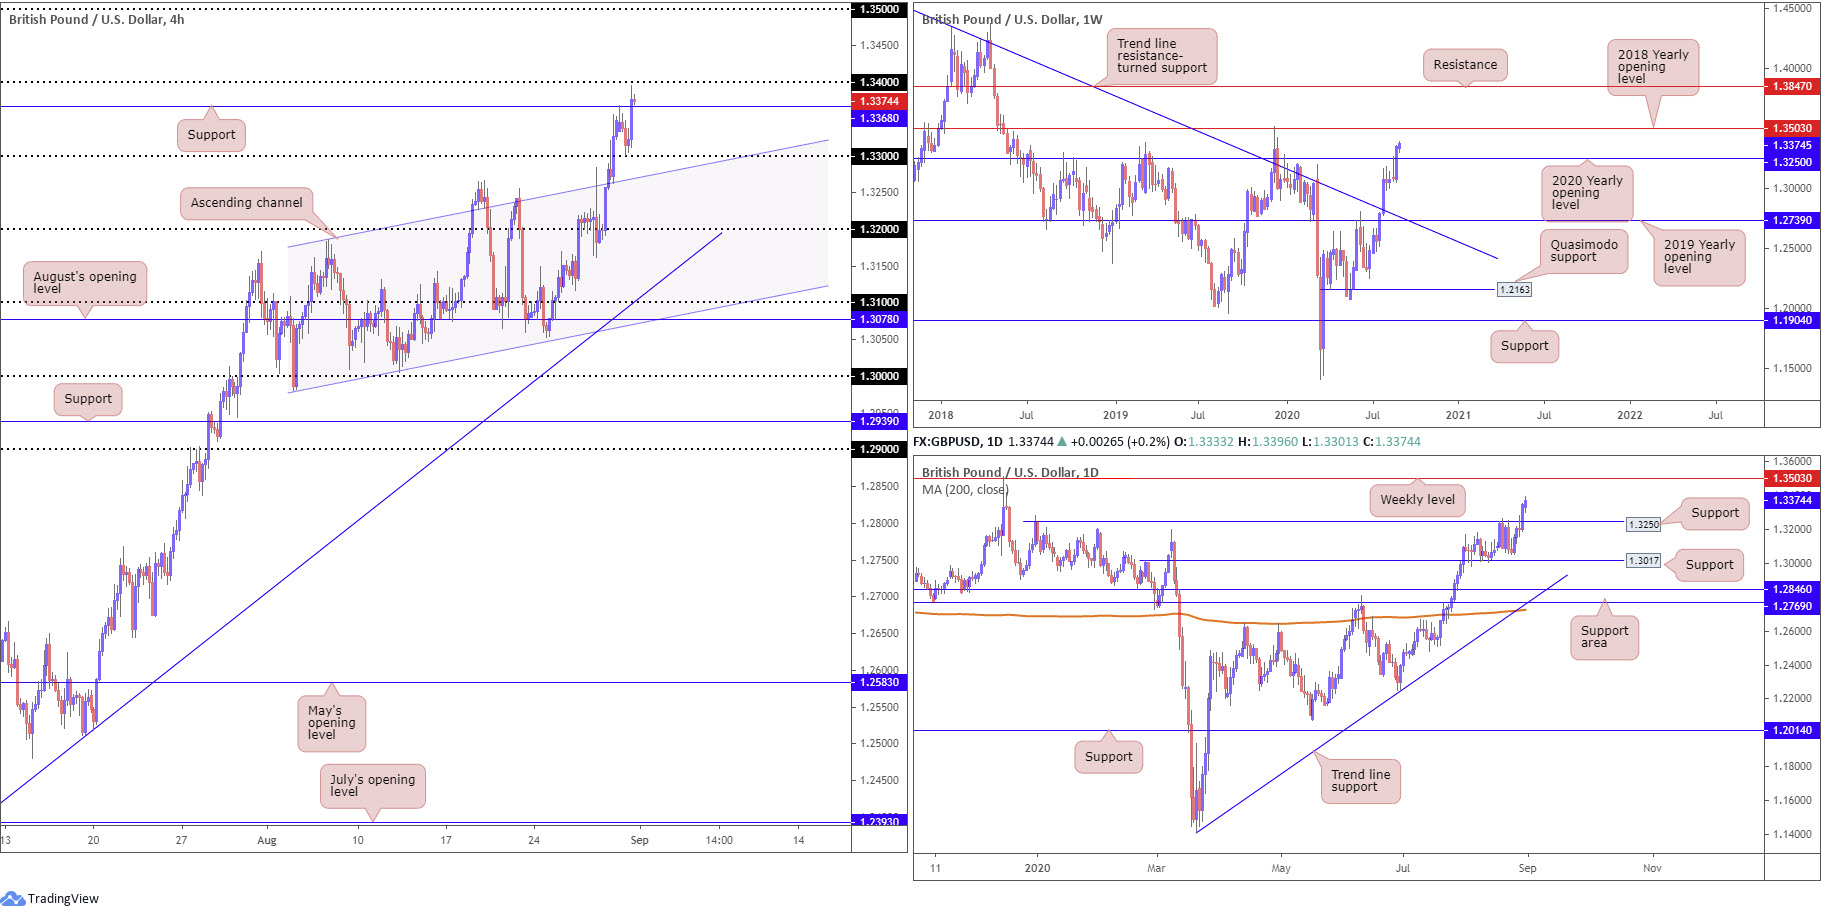
Sterling rallied to fresh YTD peaks at 1.3396 on Monday as the US dollar index navigated YTD lows. GBP/USD, as evident from the H4 chart, came within a pip of retesting 1.33 before taking on Quasimodo resistance at 1.3368 (now a serving support) and landing the fresh pinnacle. Any sustained move above 1.34 would likely swing the 1.35 handle in the firing range. Another potential scenario is 1.3368 serving buyers support, perhaps prompting an attack at the 1.34 region.
Further afield on the weekly timeframe, it appears we have a reasonably clear run north until crossing swords with 1.3503 (the 2018 yearly opening level) after engulfing the 2020 yearly opening level at 1.3250. By the same token, the daily timeframe also exhibits scope to climb towards 1.3503.
Areas of consideration:
Higher timeframe action securing ground north of 1.3250 (the 2020 yearly opening level) indicates 1.3368 on the H4 timeframe might form support today and have buyers target territory above 1.34. Conservative traders, on the other hand, may seek a H4 close above the round number before committing; others could take it a step further and wait and see if a 1.34 retest occurs. Either way, upside north of 1.34 reveals space to approach the 1.35 region.
AUD/USD:
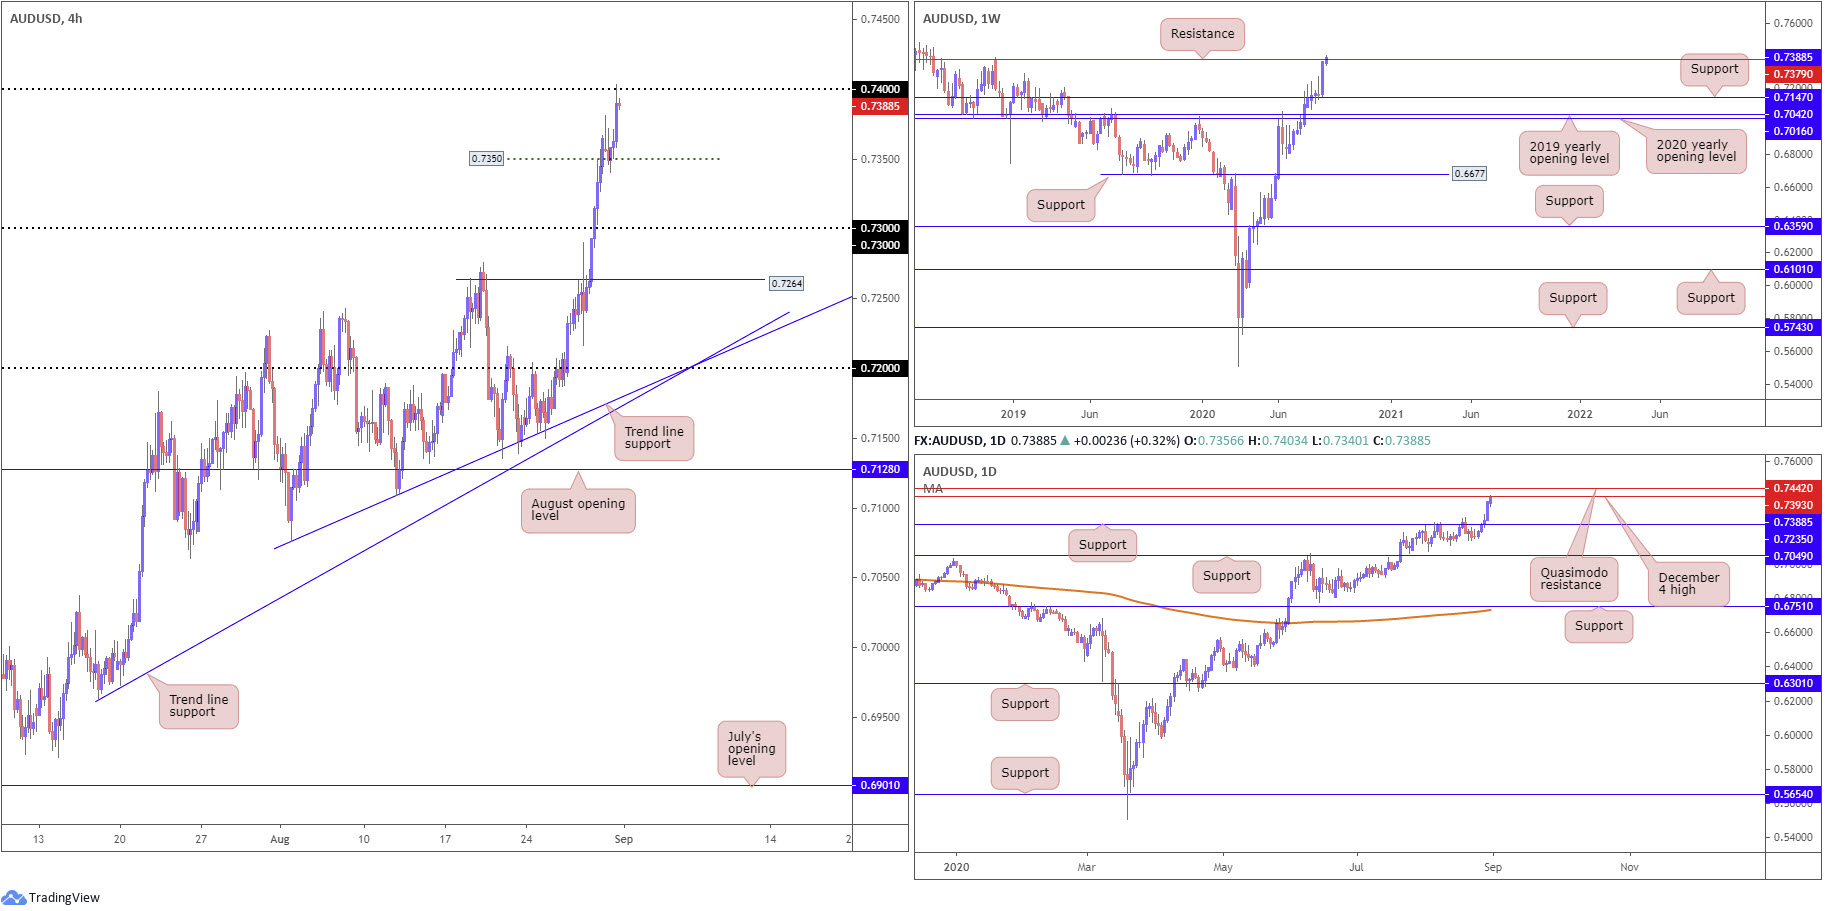
The greenback kicked off the week on the backfoot, dipping to fresh YTD lows and, consequently, reinforcing the Australian dollar to YTD peaks at 0.7403. Technically, 0.7350 lent a helping hand on the H4, welcoming an intraday retest. Psychological resistance posted at 0.74 also made an appearance, marginally rotating intraday flow to the downside into the close.
Meanwhile, daily price is seen tackling the 0.7393 December 4 high, which if fails to contain upside strength (trending northbound since bottoming in late March) exposes Quasimodo resistance at 0.7442. Note we can also see Monday pencilled in a fifth consecutive rally, movement that overrun resistance at 0.7235 last week. Higher on the curve, though, we also have weekly price testing the mettle of resistance coming in at 0.7379, a level that has boasted reasonably strong S/R since mid-2015.
Areas of consideration:
Although the market’s trend faces a northerly trajectory right now, buyers face resistance on all three timeframes analysed. While probably not enough to halt the current trend, the resistances may be sufficient to generate a dip. For that reason, moves back to 0.7350 on the H4 timeframe are a possibility today, which could initiate dip-buying strategies.
A continuation north – closing above 0.74 – may, however, see daily Quasimodo resistance at 0.7442 enter play. Intraday buying opportunities, therefore, might take shape.
USD/JPY:
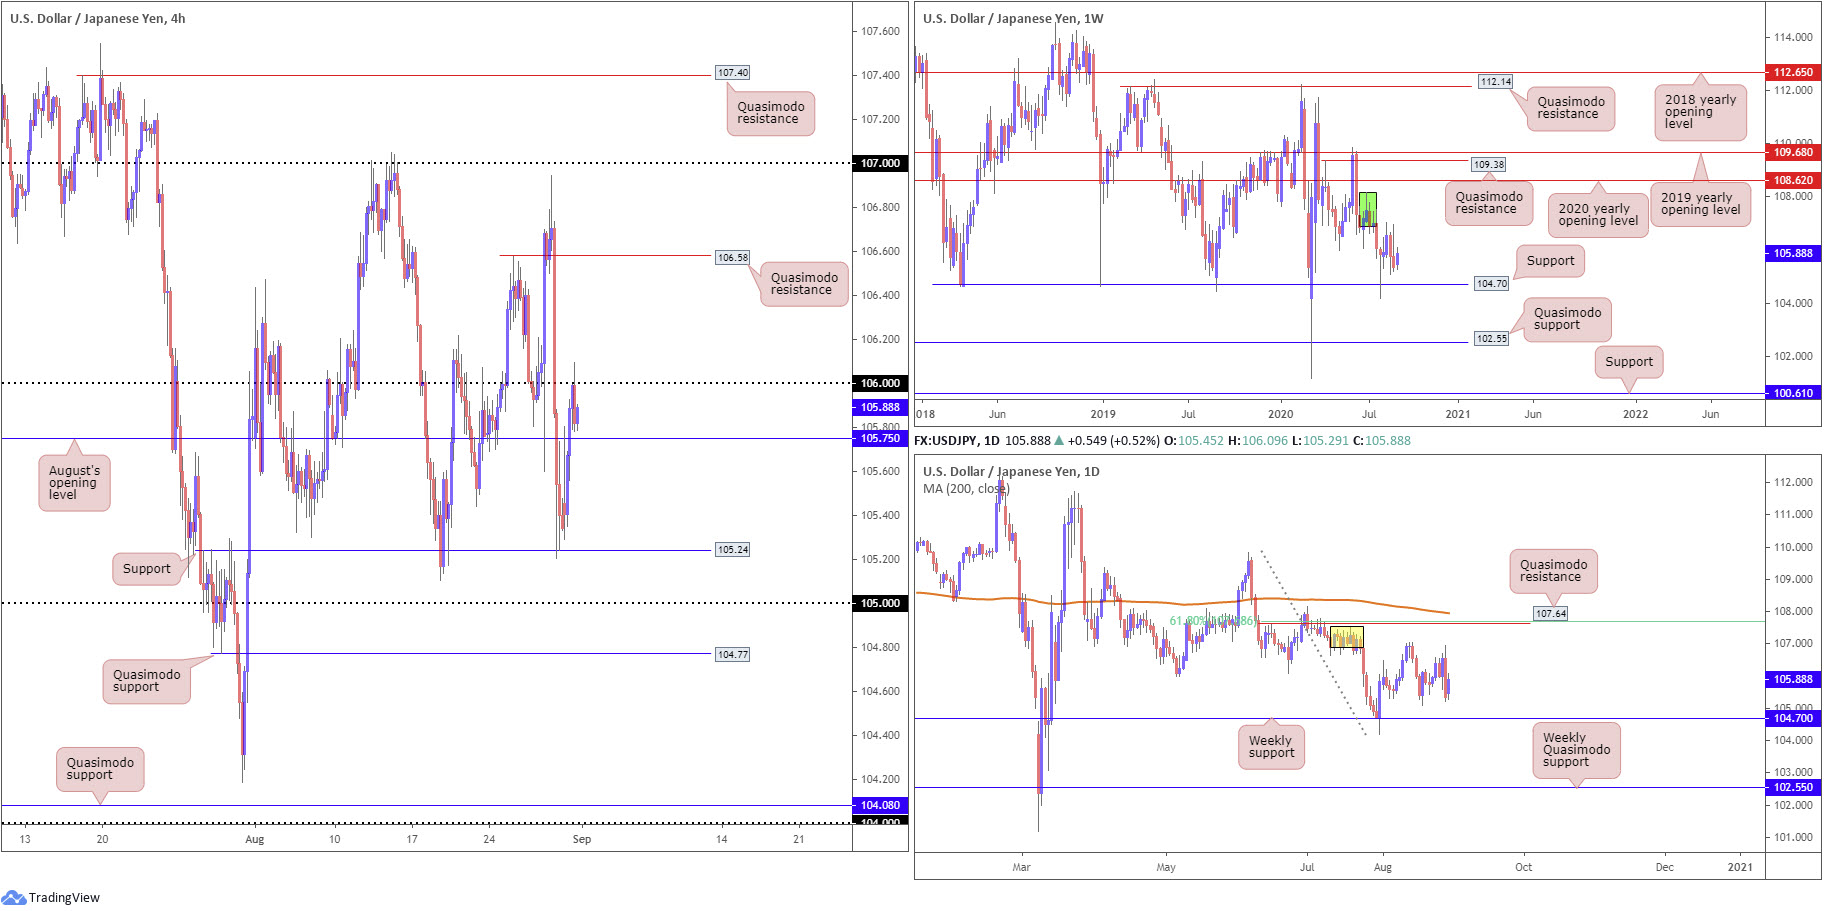
The USD/JPY recovered almost 50 percent of Friday’s decline Monday, reclaiming August’s opening level at 105.75 and testing 106 resistance on the H4 timeframe. Traders are likely to show interest in bullish scenarios today in the event a H4 close above 106 takes form, targeting Quasimodo resistance at 106.58.
Although we recently popped higher, the weekly timeframe’s overall structure remains unchanged. Therefore, here’s a reminder of Monday’s technical briefing:
From the weekly timeframe, we can see supply remains prominent at 108.16-106.88 (dark green) after price made its way off support at 104.70 at the end of July. Last week’s movement ended in the form of a strong selling wick, positioning the aforementioned support back in the fold. Should buyers regain consciousness, the 2020 yearly opening level at 108.62 may enter view, closely followed by Quasimodo resistance at 109.38.
From the daily timeframe:
Supply at 107.55/106.89 (yellow), an area housed within the lower boundary of weekly supply mentioned above at 108.16-106.88, is also proving a tough nut to crack, with further downside to potentially target the weekly support underlined above at 104.70. In the event buyers make a comeback, Quasimodo resistance at 107.64 might enter play, reinforced by a 61.8% Fibonacci retracement ratio at 107.68 and the 200-day SMA (orange – 107.95).
Areas of consideration:
August’s opening level on the H4 timeframe at 105.75 is set to perhaps serve as support today, motivating an approach/engulf above 106, to take aim at 106.58. Conservative traders, nevertheless, may wait and see if a 106 retest occurs before taking action.
USD/CAD:
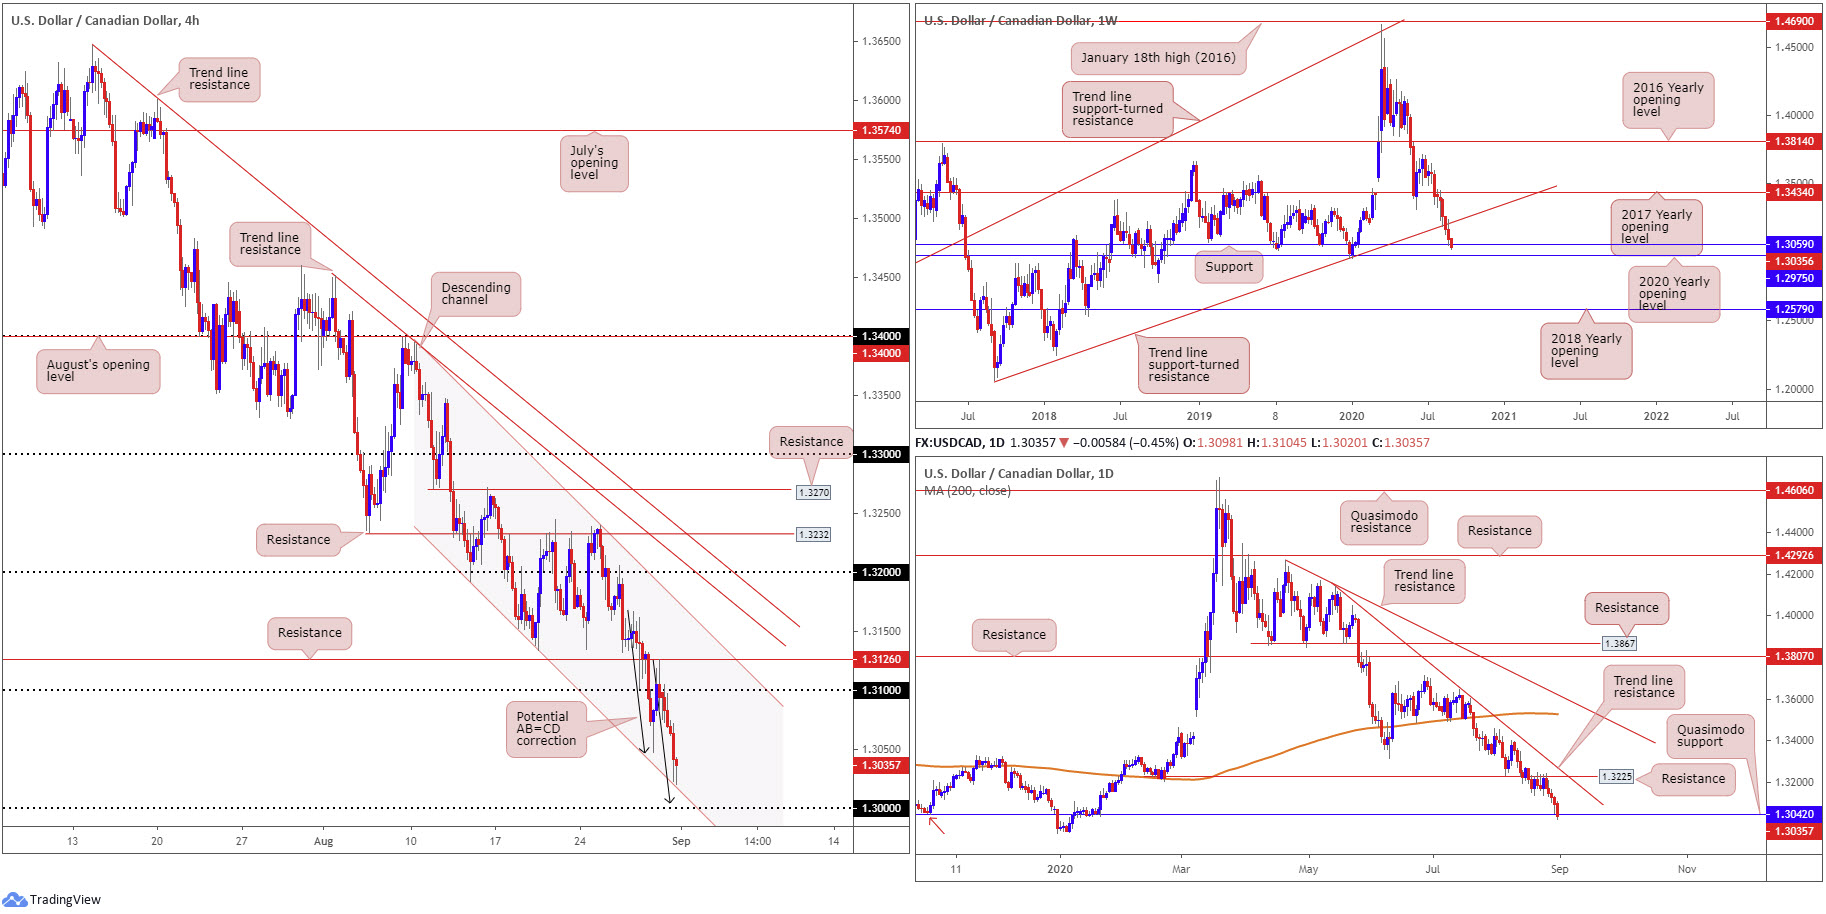
The US dollar tumbled against its Canadian counterpart Monday, in line with the US dollar index securing fresh YTD lows. Recording a fifth consecutive daily loss, USD/CAD touched gloves with daily Quasimodo support at 1.3042, following a meaningful decline from the underside of resistance parked at 1.3225 over the last week. The Quasimodo level (or area), technically speaking, remains valid until the low of the Quasimodo formation at 1.2951 (Dec 31 2019) is taken out.
The story on the weekly timeframe reveals price slipped to a seventh consecutive losing week in recent movement. After testing ground under the 2017 yearly opening level at 1.3434 in early August and later under trend line support (taken from the low 1.2061), price recently surpassed support at 1.3059 and threw the 2020 yearly opening level at 1.2975 into the mix as possible support.
Across the page on the H4 timeframe, we’re seen testing channel support, extended from the low 1.3133, which, as you can probably see, mingles closely with a potential AB=CD correction (black arrows) at 1.3004 and the key figure 1.30.
Areas of consideration:
With daily Quasimodo support in the frame (with its pattern low set at 1.2951) at 1.3042, along with H4 structure underlined in bold, and weekly support seen at 1.2975 (the 2020 yearly opening level), this sends across a potential reversal zone between 1.2975/1.3042. While a reasonably large area, it is likely most countertrend traders will be targeting 1.30. However, ensure to have protective stop-loss orders suitably placed as a whipsaw through 1.30 into weekly support at 1.2975 is a possible scenario.
USD/CHF:
For those who read Monday’s technical briefing you may recall the following (italics):
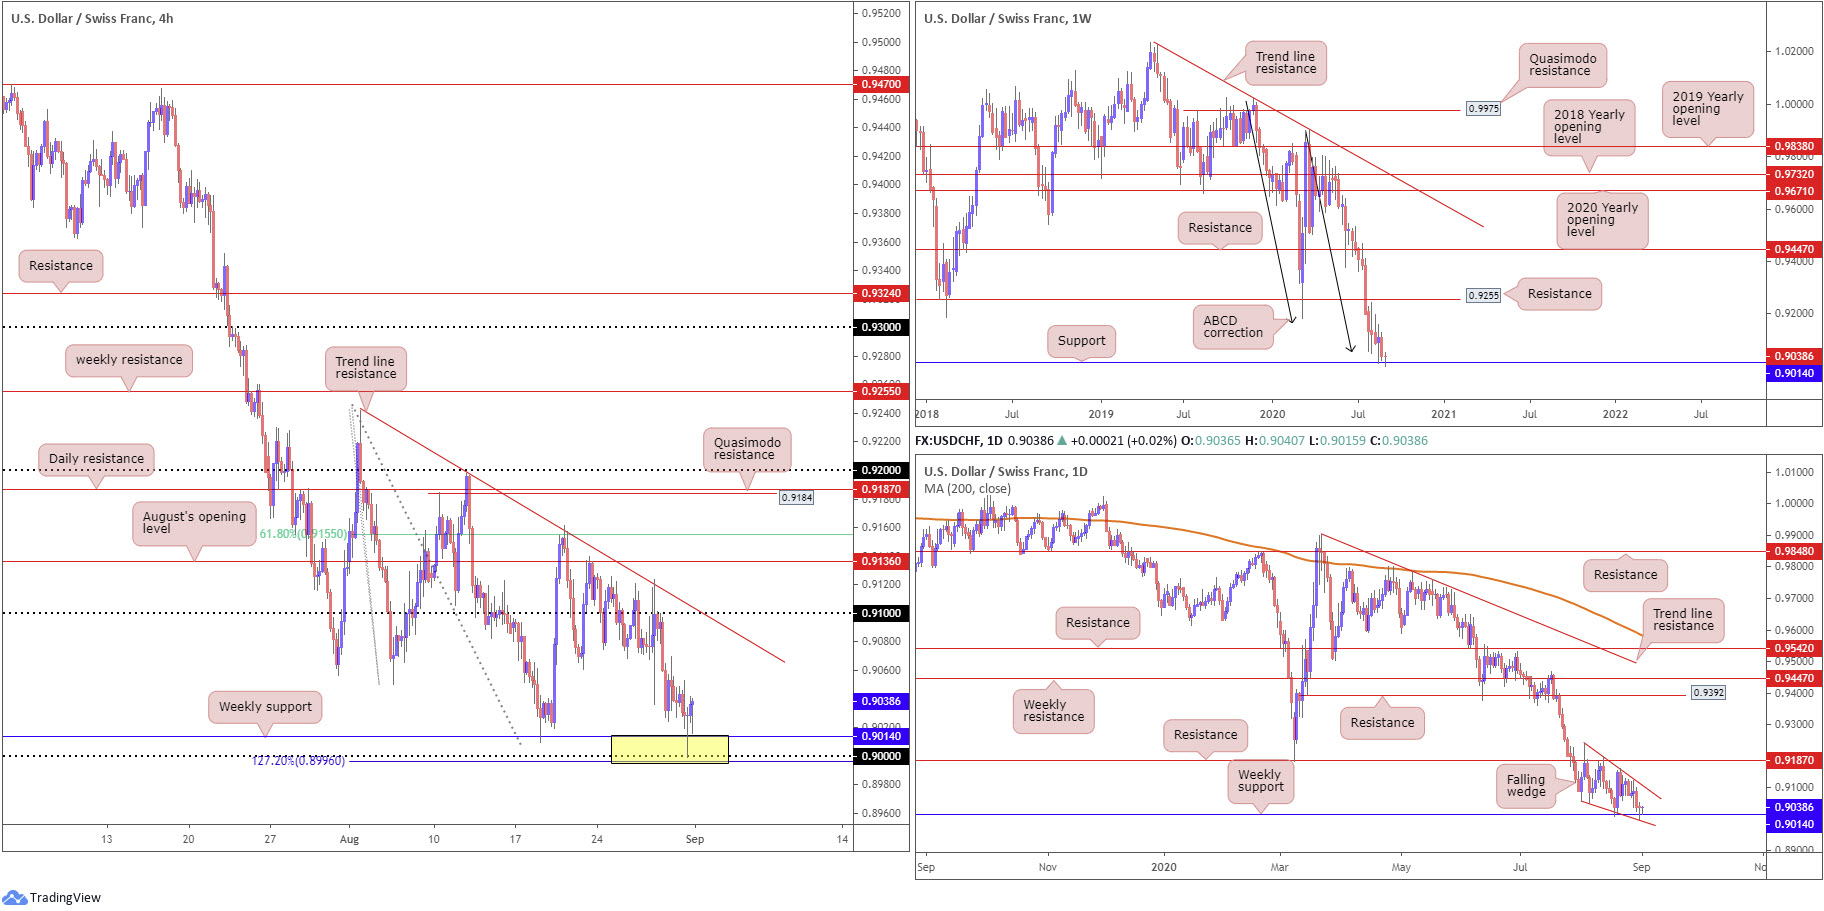
Weekly support at 0.9014 is significant in this market, particularly as it’s joined with a weekly ABCD bullish formation at 0.9051 (black arrows), and a falling wedge pattern on the daily timeframe pencilled in from the high 0.9241 and a low of 0.9056. As such, the area between 0.8996 (H4 127.2% Fibonacci extension point), the 0.90 handle and weekly support from 0.9014 (yellow [H4]) could deliver a solid recovery this week.
As evident from the H4 chart this morning, price rebounded from 0.8996/0.9014 and formed a near dragonfly doji pattern, typically interpreted as a bullish reversal candlestick configuration. Assuming extended recovery gains, the upper boundary of the daily falling wedge is likely to hit first (essentially the trend line resistance shown on the H4 chart), followed closely by the 0.91 handle.
Areas of consideration:
Those long from 0.8996/0.9014 likely have protective stop-loss orders tucked around 0.8990ish, with some likely to reduce risk to breakeven when/if we reach 0.9050. Beyond here, as underlined above, the upper boundary of the daily falling wedge could hamper upside and, therefore, may have traders liquidate partial profits around this region.
Dow Jones Industrial Average:
The final trading day of August witnessed major US equity benchmarks finish mostly lower. The Dow Jones Industrial Average dipped 223.82 points, or 0.78%; the S&P 500 dropped 7.70 points, or 0.22% while the tech-heavy Nasdaq 100 traded higher by 114.84 points, or 0.96%.
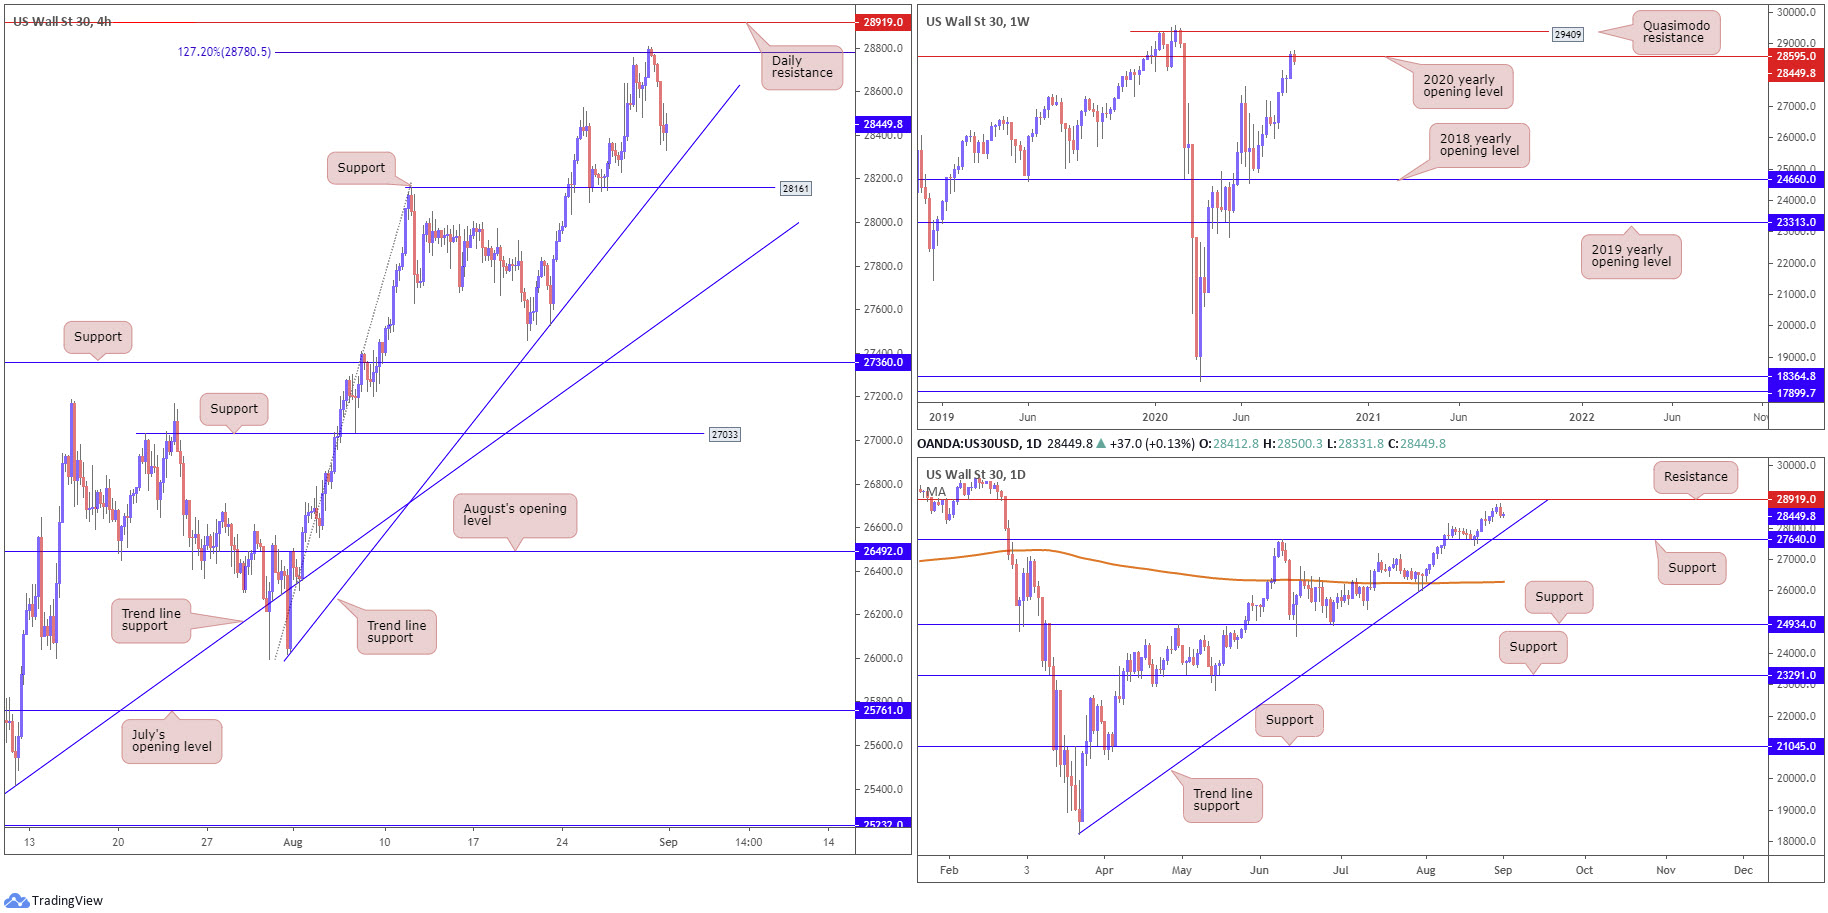
From a technical standpoint, price action on the DJIA is seen trading from resistance on the weekly timeframe, by way of the 2020 yearly opening level at 28595. With the market booking strong gains in August, there is a chance we could eventually see weekly candles draw higher and welcome Quasimodo resistance seen at 29409. Before heading north, however, daily price must contend with resistance parked at 28919, in addition to the possibility of retreating to trendline support (18213).
A closer reading of price action on the H4 timeframe shows price faded a 127.2% Fibonacci extension point at 28780 (sited just south of daily resistance at 28919), causing a daily bearish outside day reversal. Downside from current price targets trend line support, etched from the low 26017, as well as support coming in from 28161.
Areas of consideration:
The H4 trend line support, taken from the low 26017, and support coming in from 28161 are likely watched areas of support today. An ideal scenario would be for H4 price to fakeout through the noted trend line and test support, tapping into sell-stop liquidity under the trend line and potentially fuelling a recovery.
XAU/USD (GOLD):
XAU/USD was little changed Monday, forming a near-neutral doji candlestick formation on the daily timeframe. In light of yesterday’s lacklustre response, much of the following analysis will echo thoughts put forward in Monday’s technical briefing.
From the weekly timeframe:
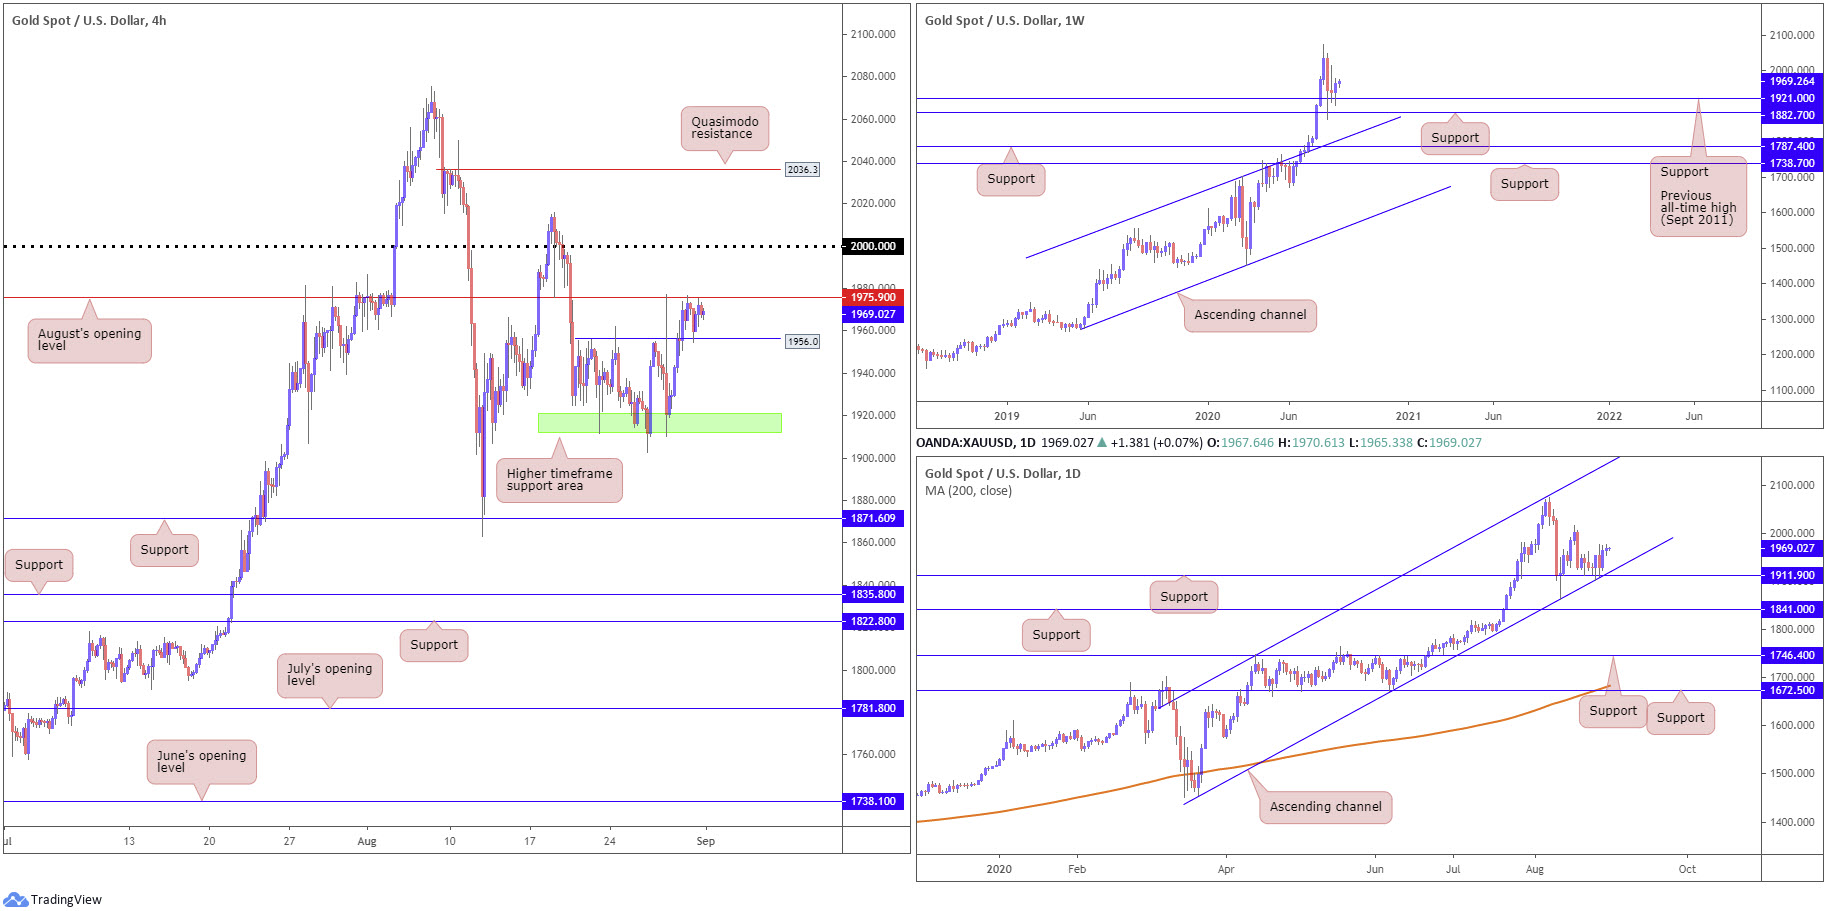
Spot gold finished the week in modestly positive territory, noticeably off $1,921.00 support, the previous major all-time high (September 2011). This is a level sited ahead of support at $1,882.70. With the current trend trekking north since 2016, the combination of $1,882.70 and $1,921.00 may be enough to encourage additional buying this week, with most targeting all-time peaks at $2,075.28 as the initial point. Failure to hold gains, we could see channel resistance-turned support, etched from the high $1,703.28, enter play.
From the daily timeframe:
Channel support, taken from the low $1,455.32, coupled with support at $1,911.90, remains a key point of interest on the daily timeframe. Buyers, as you can see, defended this area last week, with Friday chalking up a near-2% move. The $2,015.72 August 18 high represents the next possible resistance area, should we continue to climb this week.
From the H4 timeframe:
$1,911.90-$1,921.00 (daily support/weekly support – green) served the market well last week as a support area.
Friday, as you can see, had price run through resistance at $1,956.08 (now a serving support), buoyed on the back of the DXY trading lower (Monday had the DXY drop to fresh YTD lows). Consequently, price movement is now sandwiched between August’s opening level at $1,975.90 and $1,956.08. A break higher exposes $2,000.00 as a potential resistance, followed by the $2,015.72 August 18 high mentioned above on the daily timeframe and then the H4 Quasimodo resistance at $2,036.30.
Areas of consideration:
The reaction from higher timeframe supports at $1,911.90-$1,921.00, together with the current uptrend firmly intact, implies buyers have the upper hand going into the week.
Therefore, a H4 close above August’s opening level at $1,975.90 is likely to trigger breakout buying. A retest of the latter may also draw in additional buying, particularly conservative traders.
Irrespective of the entry above $1,975.90, $2,000.00 is in place as an initial upside hurdle to be aware of.
The accuracy, completeness and timeliness of the information contained on this site cannot be guaranteed. IC Markets does not warranty, guarantee or make any representations, or assume any liability regarding financial results based on the use of the information in the site.
News, views, opinions, recommendations and other information obtained from sources outside of www.icmarkets.com.au, used in this site are believed to be reliable, but we cannot guarantee their accuracy or completeness. All such information is subject to change at any time without notice. IC Markets assumes no responsibility for the content of any linked site.
The fact that such links may exist does not indicate approval or endorsement of any material contained on any linked site. IC Markets is not liable for any harm caused by the transmission, through accessing the services or information on this site, of a computer virus, or other computer code or programming device that might be used to access, delete, damage, disable, disrupt or otherwise impede in any manner, the operation of the site or of any user’s software, hardware, data or property.


