
Key risk events today:
Limited.
(Previous analysis as well as outside sources – italics).
EUR/USD:
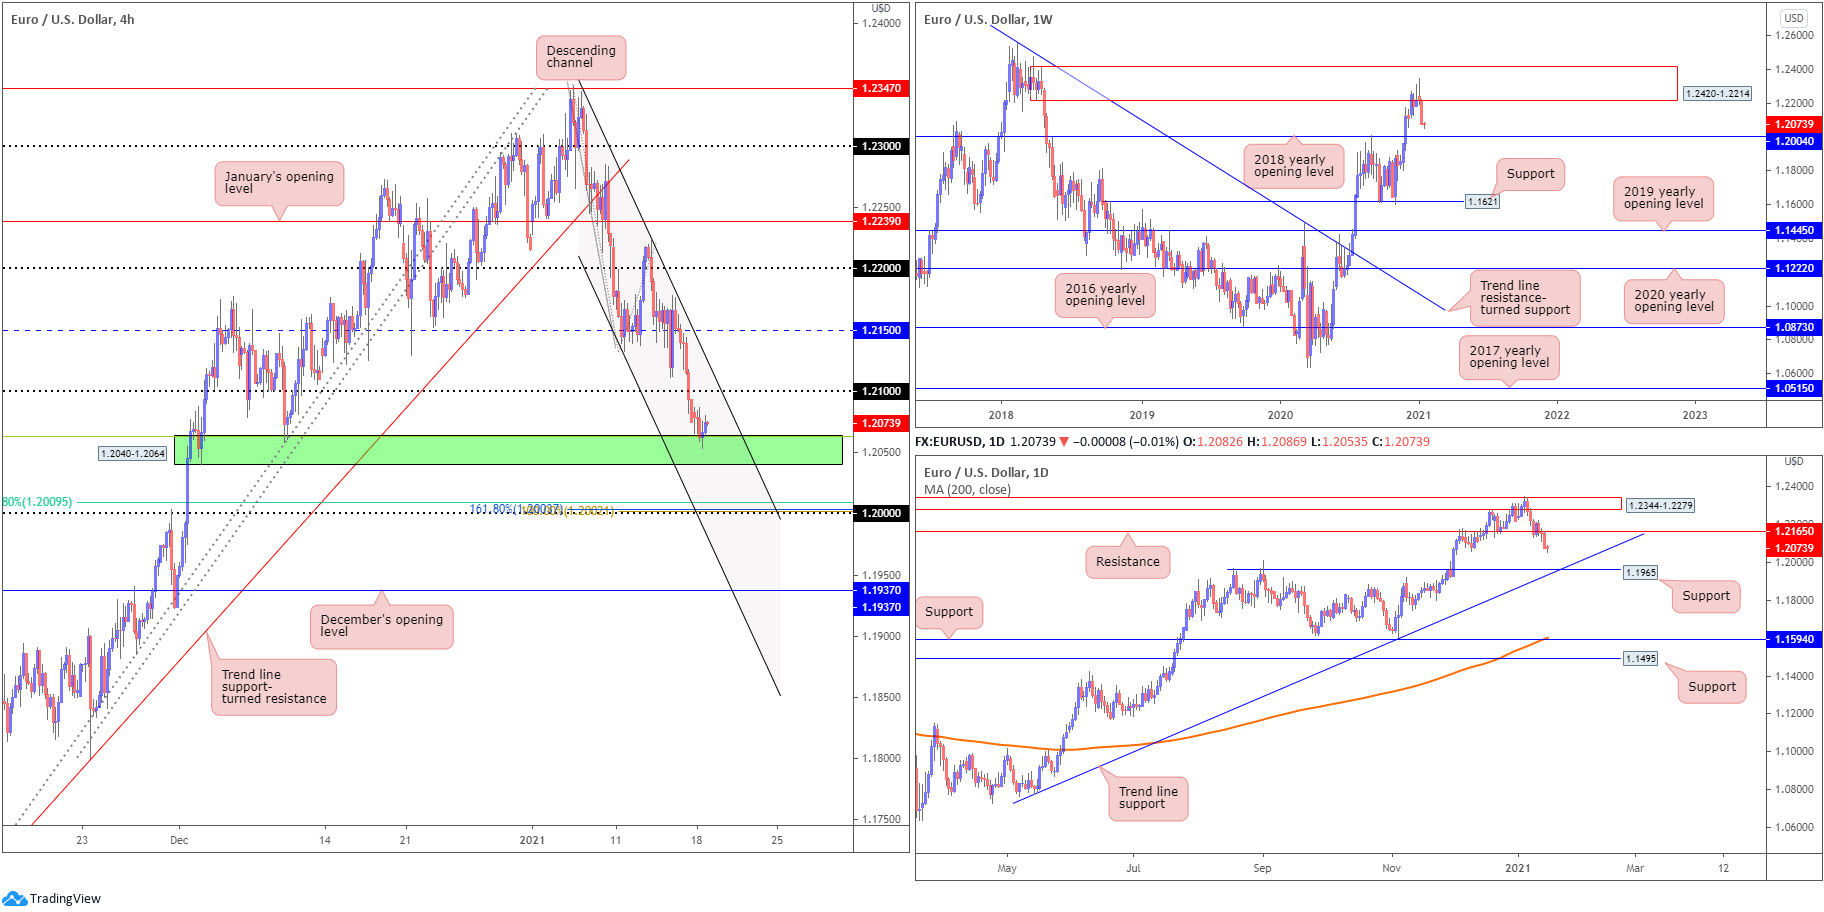
Holiday-thinned liquidity witnessed narrow trading on Monday, despite shaking hands with H4 demand (green) at 1.2040-1.2064 and connecting 38.2% Fibonacci retracement ratio at 1.2062 (green line). Any upside attempt will likely receive 1.21 and converging channel resistance, taken from the high 1.2345.
Extending lower throws the key figure 1.20 in the mix as a possible support, conveniently dovetailing with a 61.8% Fibonacci retracement ratio at 1.2009 (as well as a 100.00% Fibonacci extension point at 1.2002 and a 161.8% Fibonacci projection point at 1.2003). In addition, channel support resides close by, extended from the low 1.2132.
Further out on the weekly timeframe, supply at 1.2420-1.2214 remains central focus, with last week’s action printing strong downside. A sustained bearish spirit places the 2018 yearly opening value at 1.2004 on the hit list. In terms of trend, upside has remained favoured since bottoming at 1.0637 in March 2020. For that reason, longer-term dip-buying could surface from 1.2004 if tested.
From the daily timeframe, support at 1.2165 caved last week and shined the technical spotlight on support at 1.1965, and merging trend line support, taken from the low 1.0774. Note the support level is located just south of weekly support at 1.2004.
Areas of consideration:
- The 2018 yearly opening value at 1.2004 plotted on the weekly scale—as a reminder, the trend in this market has also faced an upward trajectory since early 2020.
- H4 demand at 1.2040-1.2064 and associated 38.2% Fibonacci retracement ratio at 1.2062. Though the area lacks higher timeframe confluence.
- The 1.20 level, based on the H4 timeframe. Not only is this value joined by H4 Fibonacci confluence and channel support, weekly support exists at 1.2004.
GBP/USD:
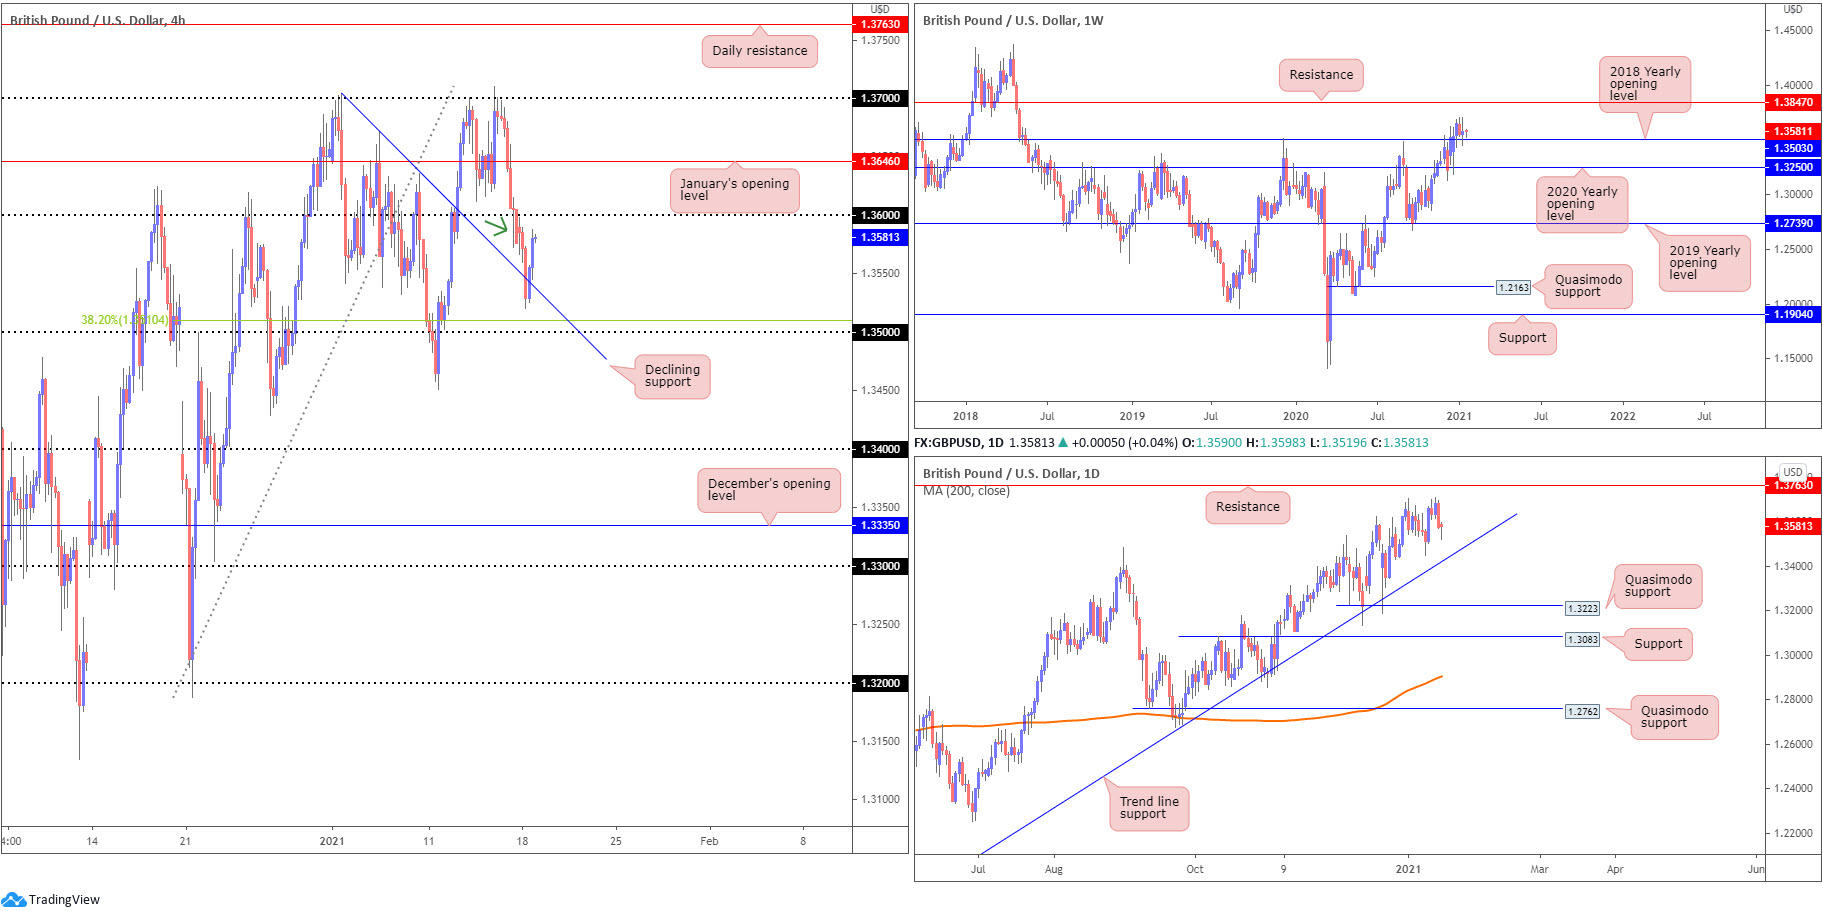
Sterling wrapped up European trading considerably off session troughs Monday, on track to form a daily hammer candlestick pattern.
For those who read Monday’s technical briefing you may recall the following (italics):
As you can see, price initially tested the waters below 1.36 (green arrow) and failed to rally higher. Therefore, the subsequent H4 close below 1.36 is likely here to stay. With short-term eyes now south of 1.36, a declining support level is in sight, etched from the high 1.3703. Below, 1.35 is the next notable support, merging with a 38.2% Fibonacci retracement ratio at 1.3510.
As evident from the H4 chart, price did indeed seek deeper levels on Monday, though failed to cross swords with the 1.35 figure before rotating northbound. H4 action is now within touching distance of retesting the underside of 1.36.
From the weekly timeframe, the 2018 yearly opening value at 1.3503 remains in view. To the upside, resistance at 1.3847 is on the radar, whereas under 1.3503 we can see support at 1.3250, the 2020 yearly opening value. Also of technical interest is the recent engulf of 1.3514 (December 9 [2019] high), helping to confirm the current uptrend (since early 2020).
The technical position on the daily timeframe shows buyers and sellers battling for position in between trend line support, etched from the low 1.1409 and resistance at 1.3763.
Areas of consideration:
- Weekly support at 1.3503 holding, in a market trending higher, places long-term buyers in a favourable position.
Monday’s technical briefing highlighted the following (italics):
Weekly support places any bearish scenario beneath 1.36 in a questionable situation. For that reason, buyers could make an appearance off the H4 declining support level. Though a downside test of 1.35 may still also be on the cards.
- Monday, as you can see, reacted off H4 declining support, with buyers on course to invade 1.36. A break above the latter could spark a bullish scenario, targeting January’s opening value from 1.3646 (H4).
AUD/USD:
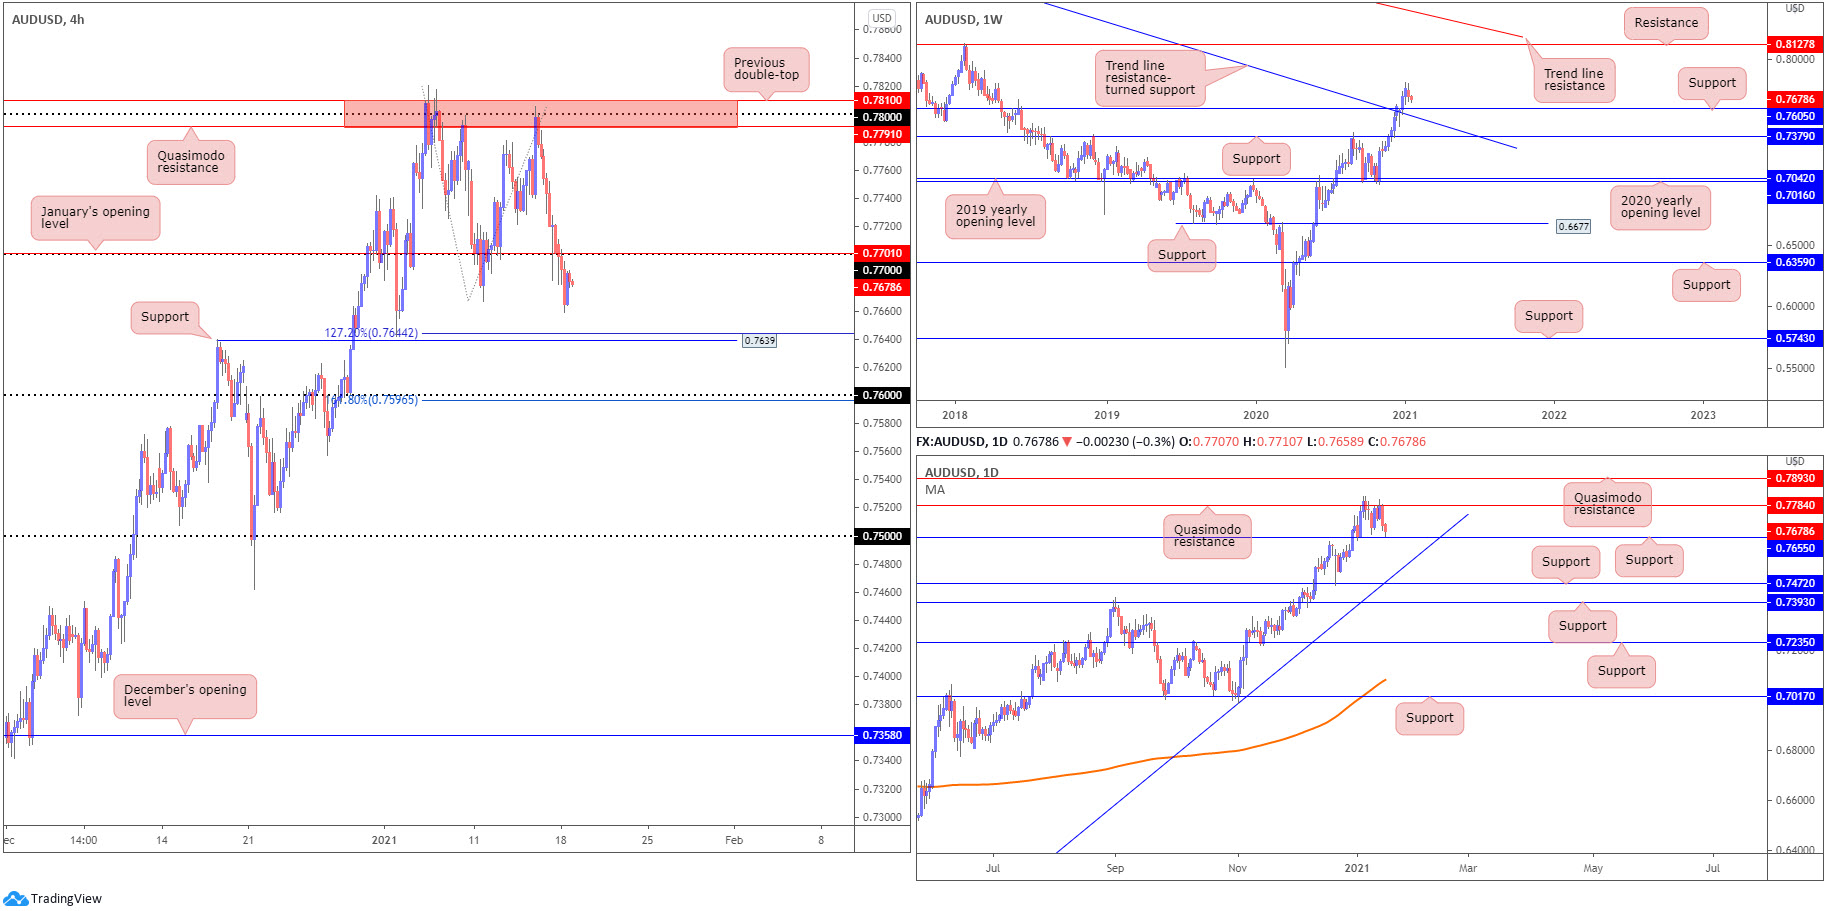
Despite marginally trimming losses going into the early hours of London on Monday, AUD/USD remains on the backfoot south of the 0.77 figure and January’s opening value taken from 0.7701. Should the Aussie continue to explore lower levels, H4 support is likely to call for attention at 0.7639 (along with the nearby 127.2% Fibonacci extension point at 0.7644), with a break exposing the 0.76 figure (and 161.8% Fibonacci extension point at 0.7596).
The 0.76 figure is in a particularly interesting location, sharing its space with weekly support at 0.7605, a previous Quasimodo resistance. A little lower on the curve, we can also see the daily timeframe trading within striking distance of support coming in at 0.7655.
Areas of consideration:
- Trend has remained firmly to the upside since early 2020.
- H4 support at 0.7639 may interest today, given its close connection with the H4 2% Fibonacci extension point at 0.7644 and daily support coming in at 0.7655.
- 76 is also an appealing figure, closely merging with weekly support at 0.7605 and a H4 161.8% Fibonacci extension point at 0.7596.
USD/JPY:
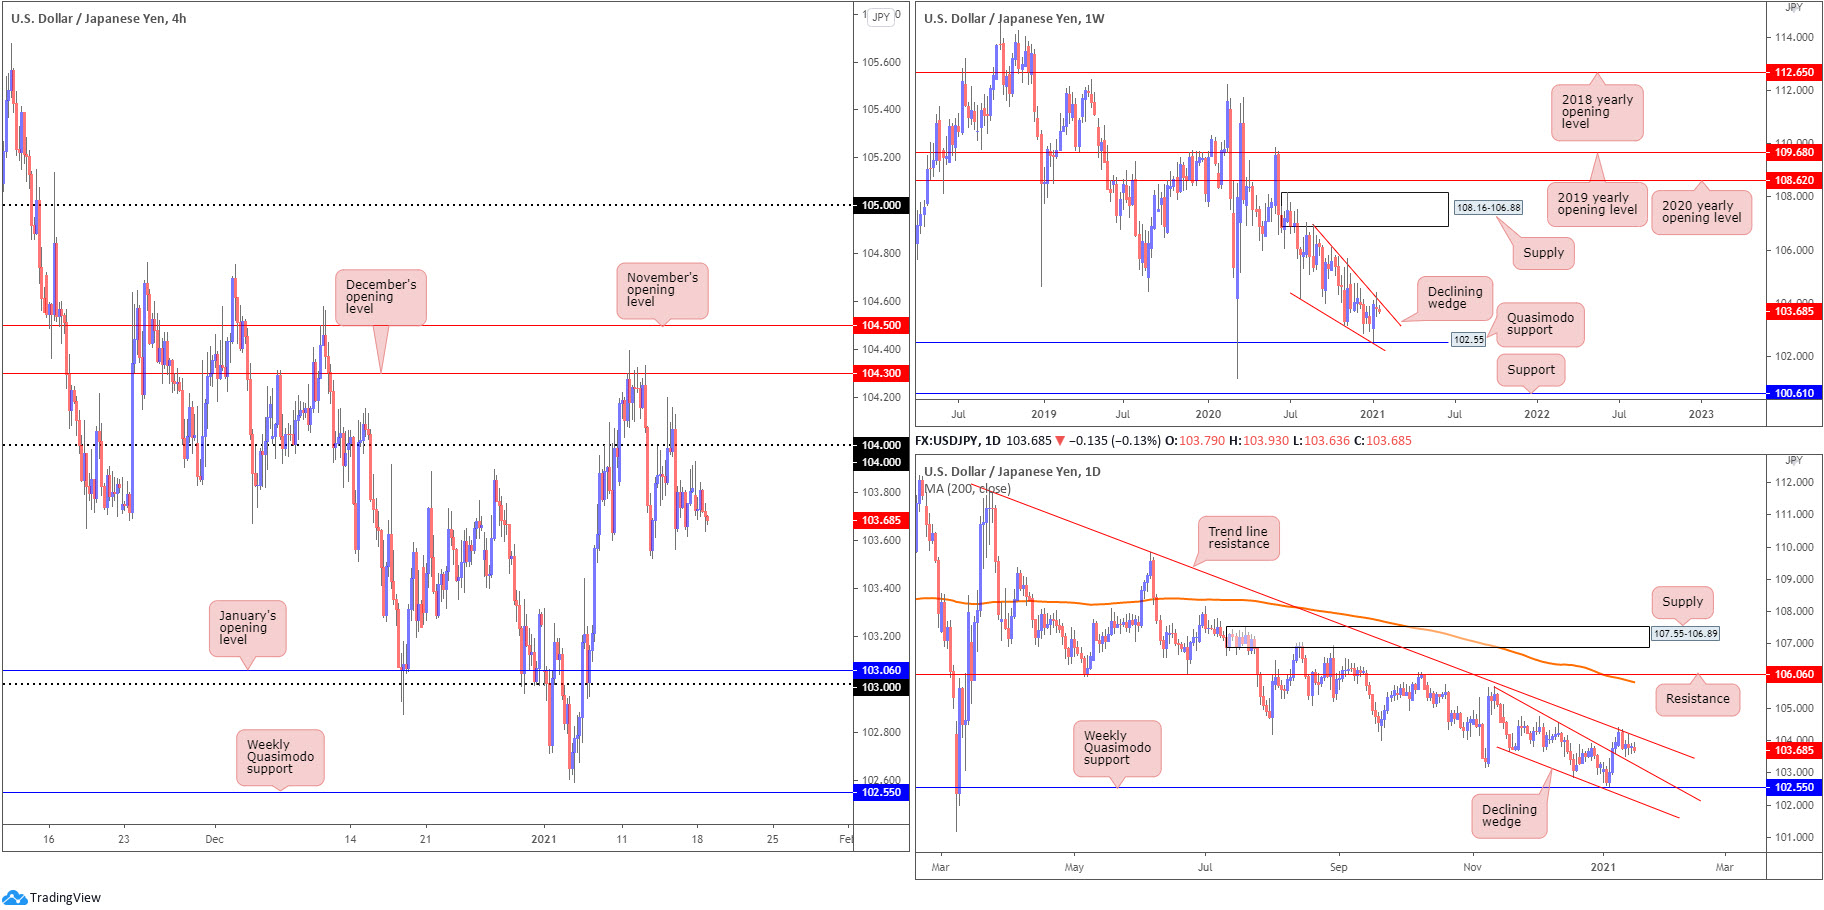
The US dollar eked out marginal losses against the Japanese yen on Monday, as price established a tight range in response to thinned-holiday movement. Therefore, the majority of the following analysis will echo thoughts put forward in Monday’s technical briefing.
From the weekly timeframe:
Since connecting with the underside of weekly supply at 108.16-106.88 in August (2020), price has gradually shifted lower and developed a weekly declining wedge (106.94/104.18). Price, as you can see, shook hands with the upper edge of the declining wedge pattern last week. With room to press lower, this may see traders zone in on Quasimodo support at 102.55.
Daily timeframe:
Action out of the daily timeframe recently crossed swords with trend line resistance, extended from the high 111.71. Traders may acknowledge the aforementioned trend line converges with the upper edge of the weekly declining wedge. Downside support resides around the upper boundary of a recently penetrated declining wedge, taken from the high 105.67.
H4 timeframe:
Last Thursday’s 104 retest saw price action challenge space ahead of Wednesday’s trough at 103.52, with Friday and Monday’s movement exhibiting a restricted stance. 104 remains a clear resistance to the upside, while drilling 103.52 shines the spotlight on January’s opening value at 103.06 and 103 figure.
Areas of consideration:
- 104 holding delivers a bearish vibe. A retest of this level, therefore, may be a welcomed sight for sellers.
- Breaching last Wednesday’s low at 103.52 (on the H4) may induce further selling, targeting the upper boundary of the penetrated declining wedge on the daily timeframe, followed by January’s opening value at 103.06 and the 103 figure (H4).
USD/CAD:
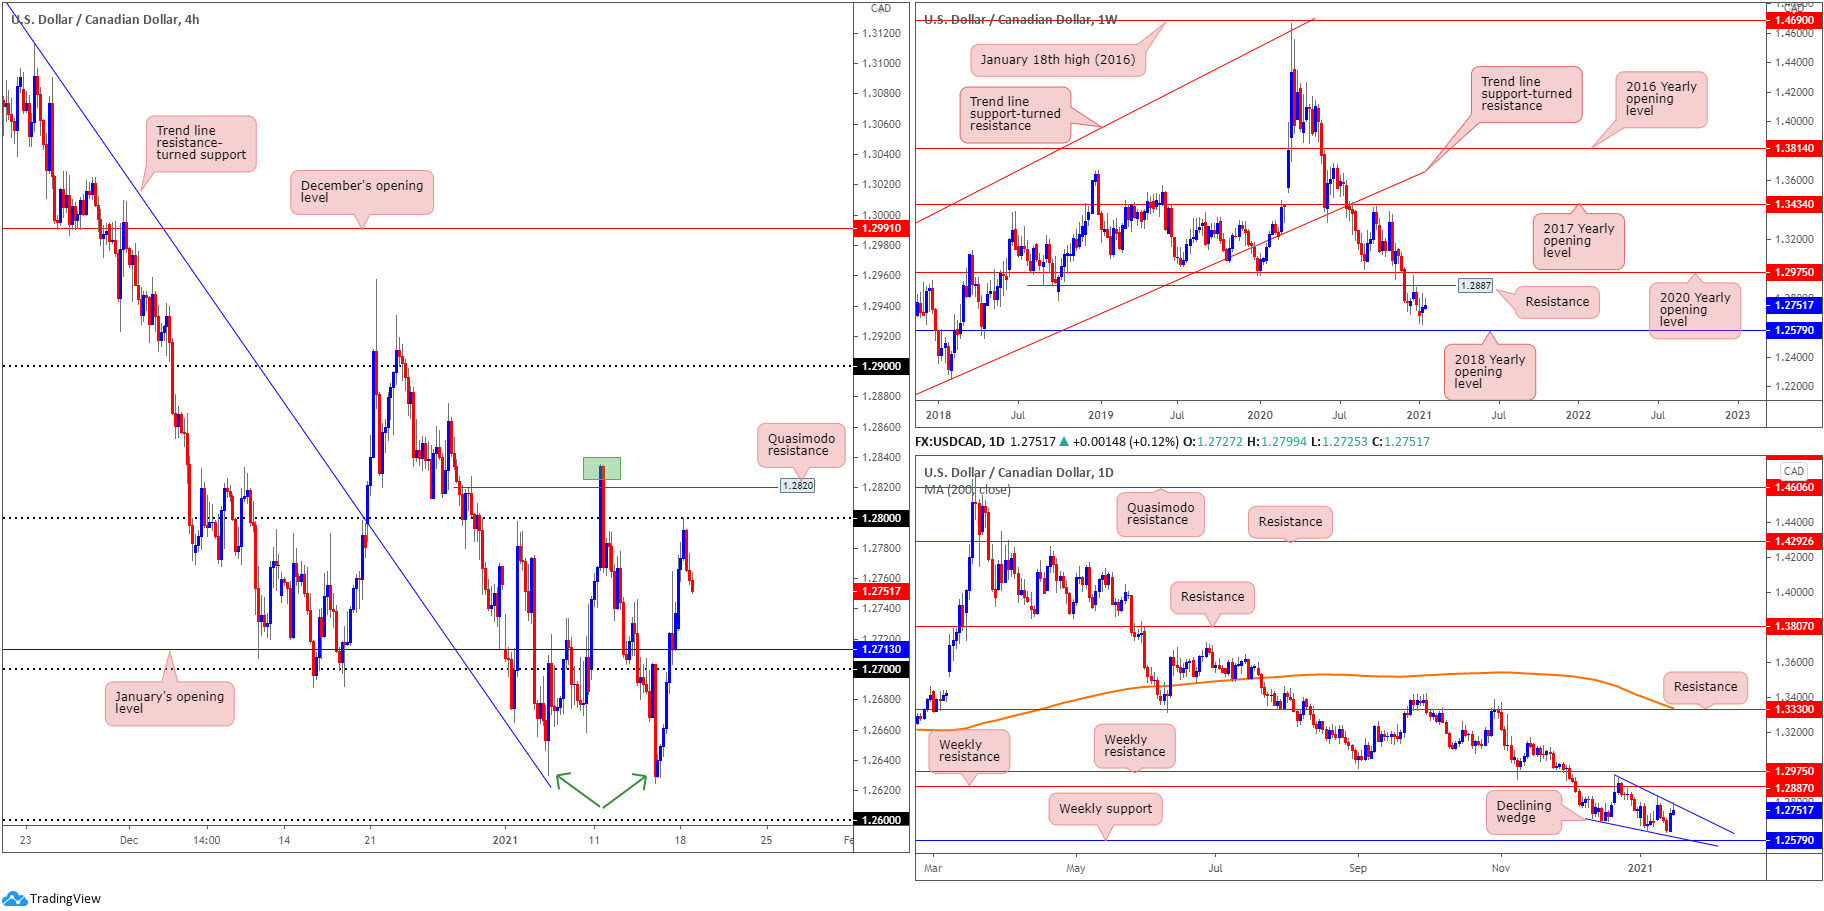
USD/CAD scraped the lower edge of 1.28 on Monday, ending the session considerably off session highs. Deprived of notable support, H4 action is eyeballing January’s opening value at 1.2713 and the 1.27 figure. It is also worth reminding ourselves the recent advance off multi-month troughs around the 1.2630 region (green arrows) formed the beginnings of a H4 double-bottom pattern. However, the buy signal is not seen until the pattern’s neckline is breached (green box) at 1.2835.
Further afield, the weekly timeframe remains south of resistance at 1.2887, a previous Quasimodo support. This seats the 2018 yearly opening value at 1.2579 in the firing line. Also, it is important to note long-term flow (trend) has been pointing lower since topping in March (2020).
Price action on the daily timeframe reveals Monday touched gloves with the upper edge of a declining wedge (1.2957/1.2688) and fashioned a shooting star candlestick pattern. A breakout higher, however, has weekly resistance at 1.2887 to target.
Areas of consideration:
- The declining wedge forming on the daily timeframe is a pattern that remains worth monitoring. A breakout to the upside—a reversal signal—could have buyers test weekly resistance at 1.2887.
- A bullish theme could emerge off 1.27 and January’s opening value at 1.2713 should the area welcome a retest, though bear in mind a retest here is against the current downtrend.
- Beyond 1.2630 (multi-month low), support targets in view are the 1.26 figure and the 2018 yearly opening value on the weekly timeframe at 1.2579.
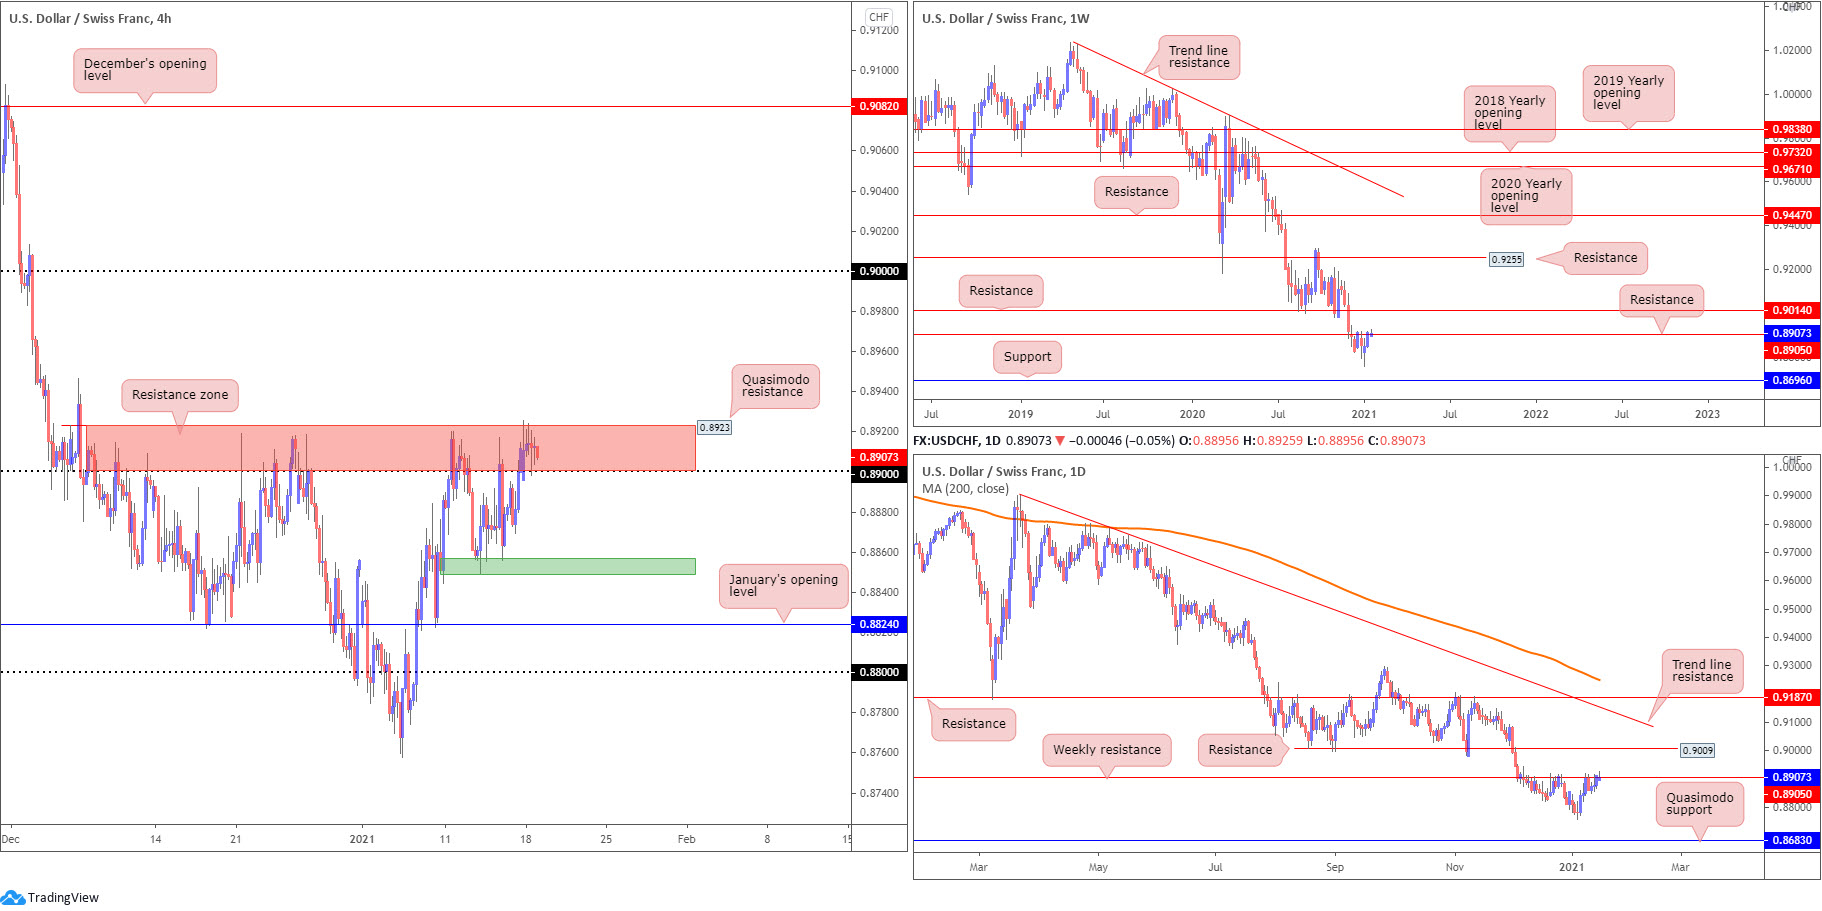
USD/CHF:
USD/CHF settled Monday unmoved amidst thin holiday trading.
H4 is seen touching gloves with a familiar resistance zone at 0.8923-0.89—a key base since early December. Monday, however, is the first time we have seen buyers attempt to hold an 0.89 retest. Therefore, a break of 0.8923 could stir additional bullish activity, aiming at the key figure 0.90. Downside targets, on the other hand, are seen at the 0.8850ish range, closely followed by January’s opening value at 0.8824 and the 0.88 figure.
The weekly timeframe shows not only has USD/CHF been entrenched within a downtrend since May 2019, the pair also remains loitering at the underside of resistance drawn from 0.8905. Because of this, despite modest buying over the past couple of weeks and a mild 0.8905 breach to the upside, sellers could maintain control in the coming weeks. Support on the weekly timeframe is not expected to make an appearance until 0.8696.
Similar to the weekly scale, the daily timeframe reveals weekly resistance at 0.8905 is a prominent base. However, Quasimodo support at 0.8683 serves as the next downside target on the daily chart, situated a touch beneath weekly support at 0.8696.
Areas of consideration:
- H4 resistance at 0.8923-0.89 is a key base.
- Having seen all three timeframes (H4, daily and weekly) respect resistance, in a market trending lower since April 2019, sellers could remain at the wheel. Consequently, a bearish scenario forming within H4 resistance at 0.8923-0.89 could be interesting.
- Should H4 buyers form a decisive close above 0.8923, a breakout theme could emerge, targeting 0.90. Conservative players are likely to seek at least a retest at 0.89-0.8923 before pulling the trigger.
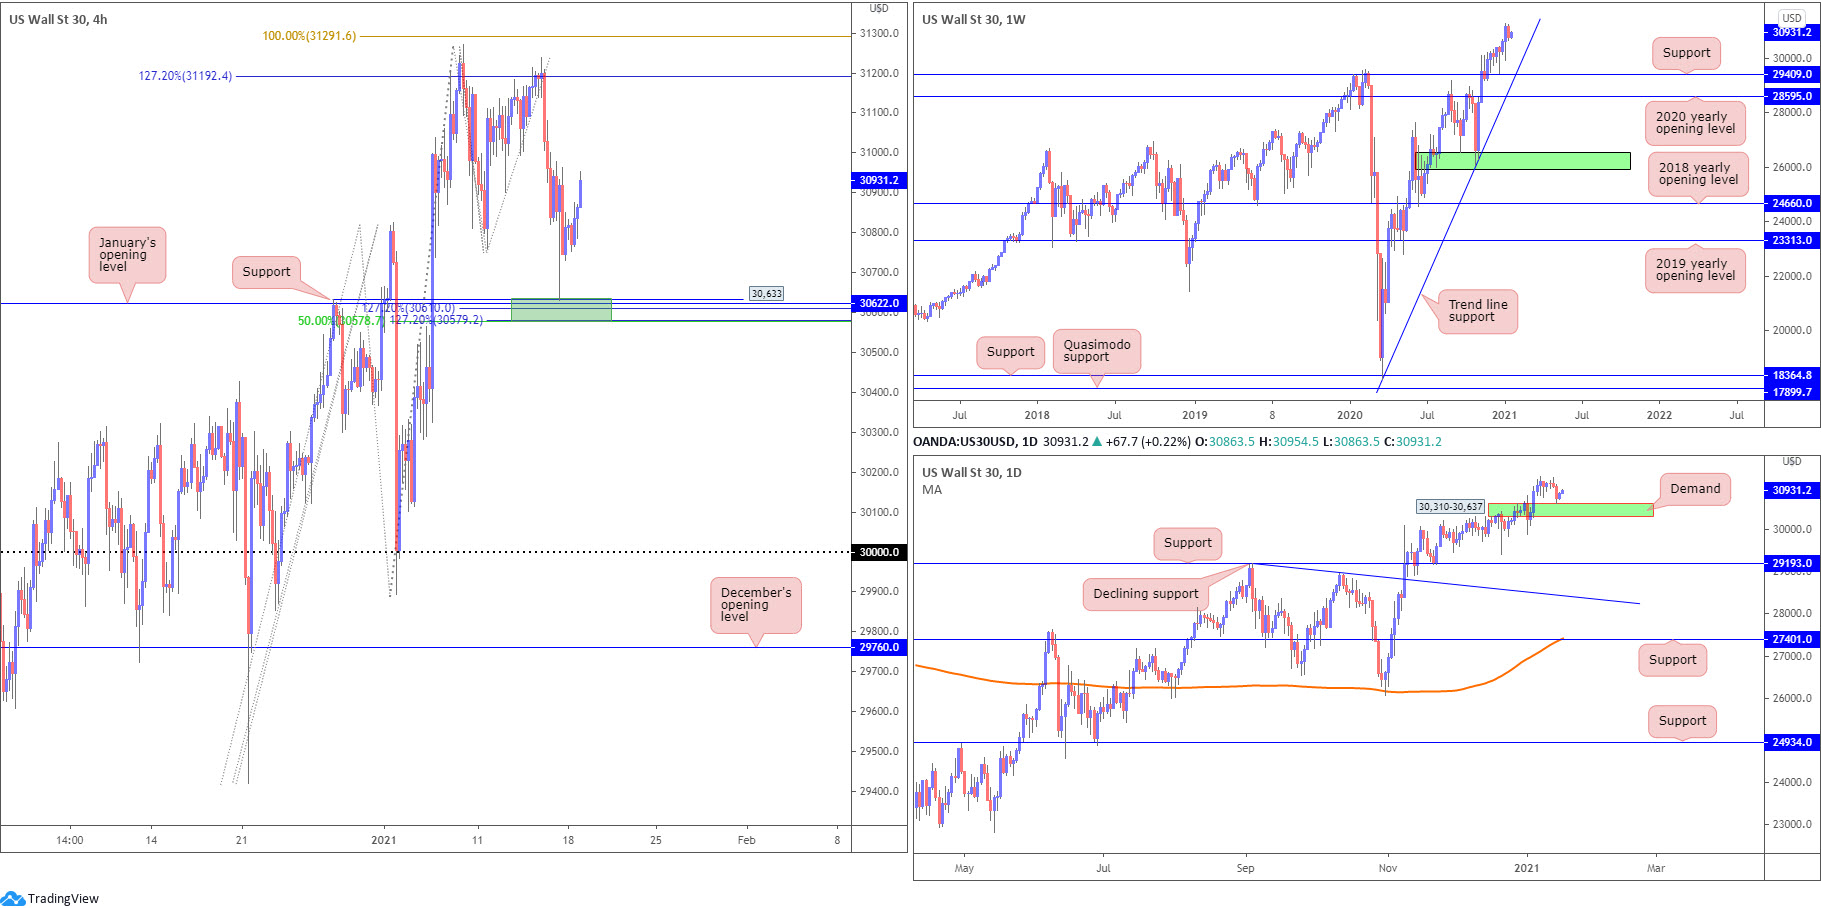
Dow Jones Industrial Average:
In light of US market’s closing in observance of the Martin Luther King Jr. holiday on Monday, limited movement was observed.
The technical position on the weekly timeframe shows price action hovering just ahead of 2021 highs at 31,271. As noted in previous analysis, the research team sees limited support in sight until trend line support, extended from the low 18,213. Another nearby support to be aware of is 29,409, a previous Quasimodo resistance.
A closer reading of price action on the daily timeframe reveals demand at 30,310-30,637 recently made its way into the spotlight. 30,310-30,637 holding suggests the benchmark may refresh all-time highs; the demand giving way, on the other hand, could spell trouble for buyers as (obvious) support is not seen until around the 29,193 range.
From a technical standpoint on the H4, support at 30,633 entered the fight Friday. Confluence surrounding this level is impressive. January’s opening value is seen at 30,622, while a touch beneath we can see a Fibonacci support zone present around 30,578-30,610. The rebound from 30,633 could reignite Fibonacci resistance (127.2% Fibonacci projection point at 31,192/100% Fibonacci extension point at 31,291).
Areas of consideration:
- H4 support at 30,633, along with January’s opening value at 30,622 and Fibonacci support around 30,578-30,610. What’s interesting is this H4 technical support area converges with daily demand at 30,310-30,637.
- H4 Fibonacci resistance (127.2% Fibonacci projection point at 31,192/100% Fibonacci extension point at 31,291).
- A H4 breakout above 31,291 potentially fuels a bullish breakout theme to refresh all-time peaks.
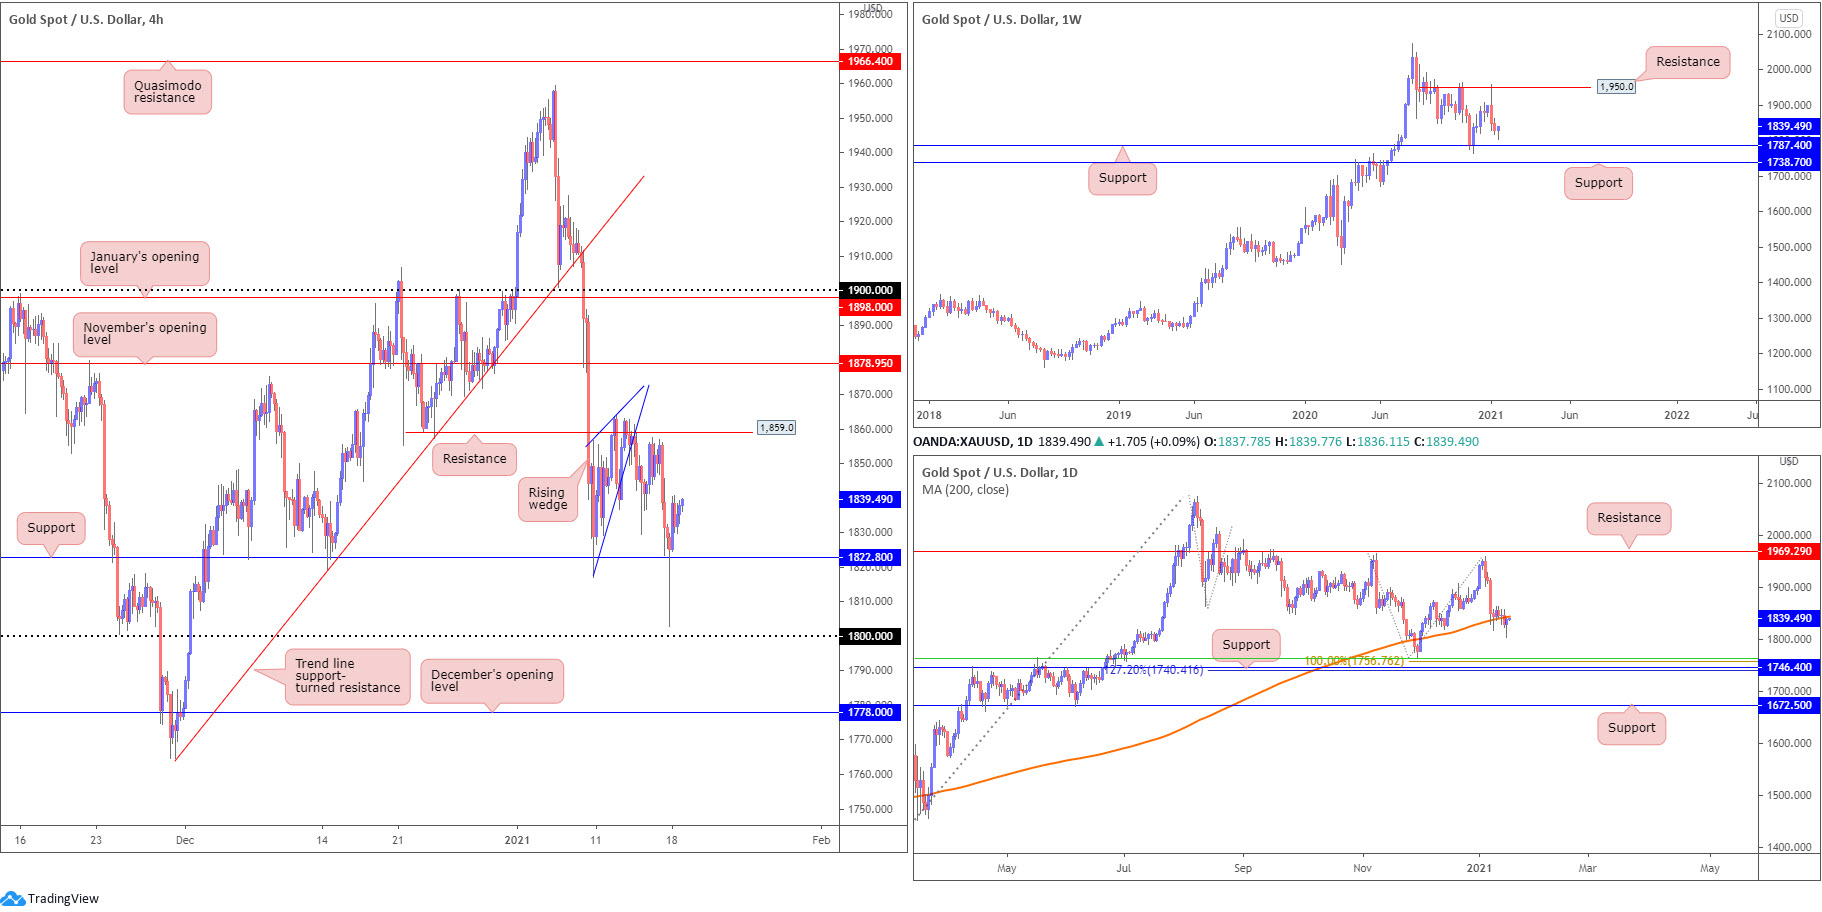
XAU/USD (GOLD):
H4 support at $1,822 withstood a somewhat aggressive spike on Monday, reaching as far south as $1,802 and forming a large hammer candle pattern. Resistance on the H4 timeframe is seen at $1,859, with a break exposing November’s opening value from $1,878.
From the weekly timeframe, support at $1,787 is close by—plotted just north of another layer of support at $1,738. Resistance can be found at $1,950. It is also worth noting that in terms of trend we’ve been actively trending higher since early 2016.
Traders will acknowledge the yellow metal formed a hammer candle pattern on the daily timeframe yesterday and took price to within touching distance of the 200-day SMA (orange – $1,843). Also notable on the daily timeframe is support priced in at $1,746 (merges with Fibonacci support around $1,740-$1,756).
Areas of consideration:
- The 200-day SMA support giving up its position last week may serve as resistance should the value welcome a retest today.
- H4 resistance at $1,859, having seen the level cap upside since early last week.
- H4 support at $1,822, given its history since December.
- Weekly support mentioned above at $1,787 resides between $1,800 and December’s opening value at $1,778 on the H4 scale.
The accuracy, completeness and timeliness of the information contained on this site cannot be guaranteed. IC Markets does not warranty, guarantee or make any representations, or assume any liability regarding financial results based on the use of the information in the site.
News, views, opinions, recommendations and other information obtained from sources outside of www.icmarkets.com.au, used in this site are believed to be reliable, but we cannot guarantee their accuracy or completeness. All such information is subject to change at any time without notice. IC Markets assumes no responsibility for the content of any linked site.
The fact that such links may exist does not indicate approval or endorsement of any material contained on any linked site. IC Markets is not liable for any harm caused by the transmission, through accessing the services or information on this site, of a computer virus, or other computer code or programming device that might be used to access, delete, damage, disable, disrupt or otherwise impede in any manner, the operation of the site or of any user’s software, hardware, data or property.


