
EUR/USD:
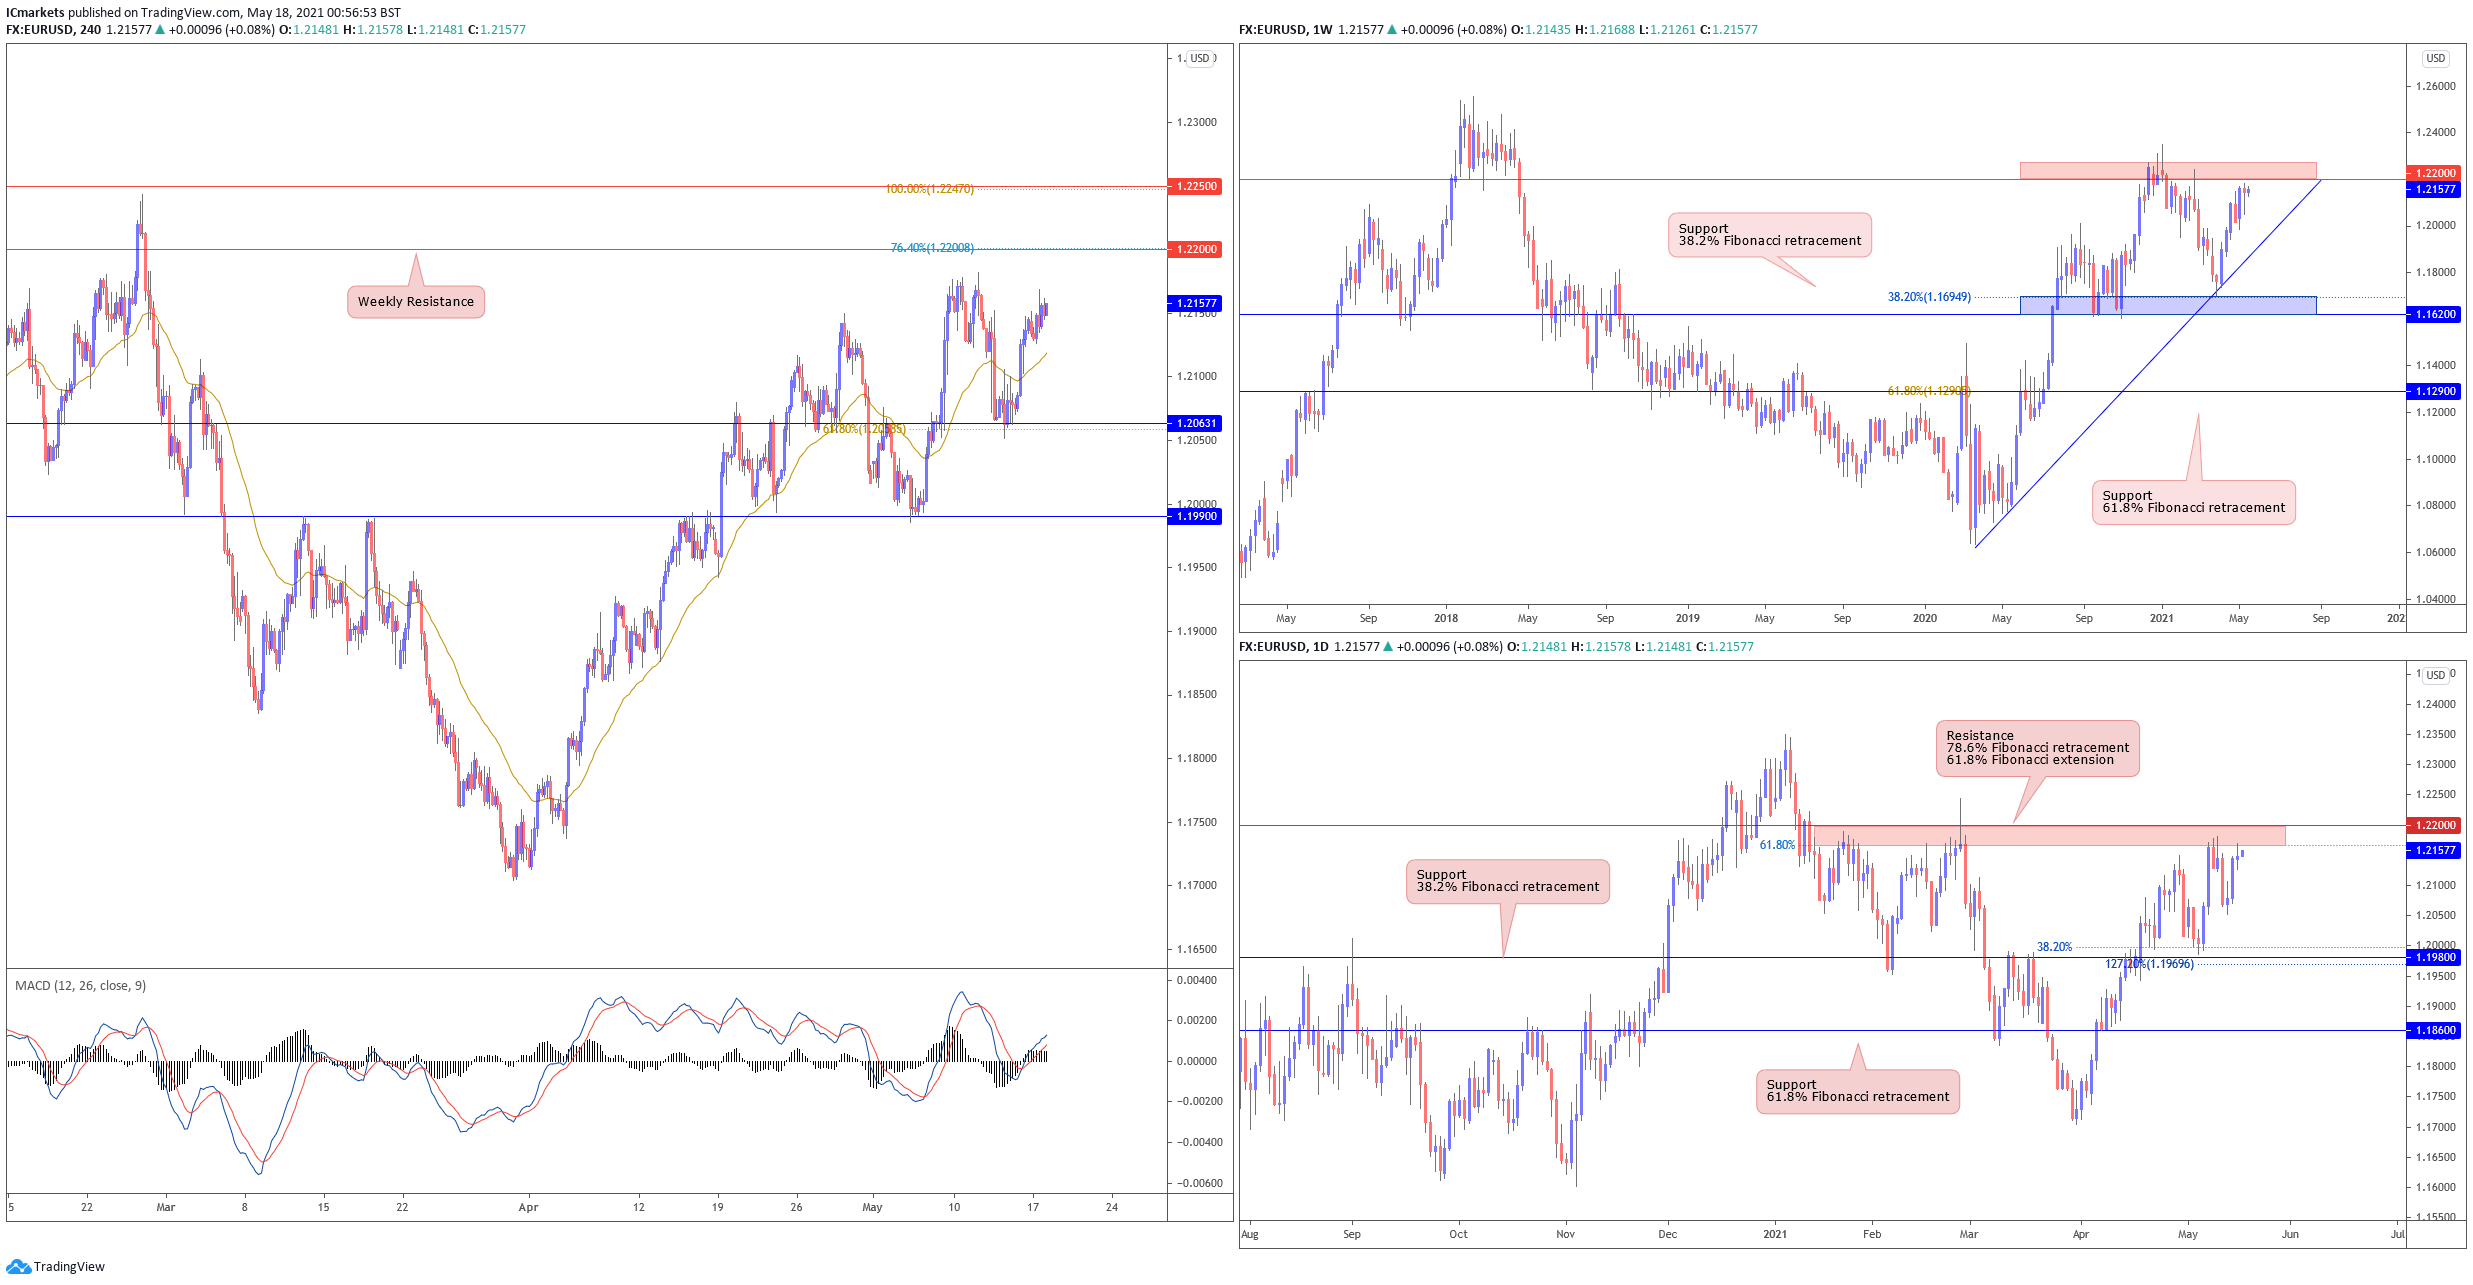
Looking at the weekly chart, we can see that prices are seeing further limited upside before it reaches our resistance area at 1.22000 – 1.22800. On the daily chart, prices are near our resistance area at 1.2200 where we could see a limited upside here.
On the H4 timeframe, prices are facing bullish pressure from our support level at 1.20631. Technical indicators are still showing room for further bullish momentum as well. We still see limited upside above this level, with 1.22000 as our next resistance target. Failure to hold above the 1.20631 support could see a swing towards our next support target at 1.19893.
Areas of consideration:
- 1.22000 resistance area found on H4 time frame
GBP/USD:
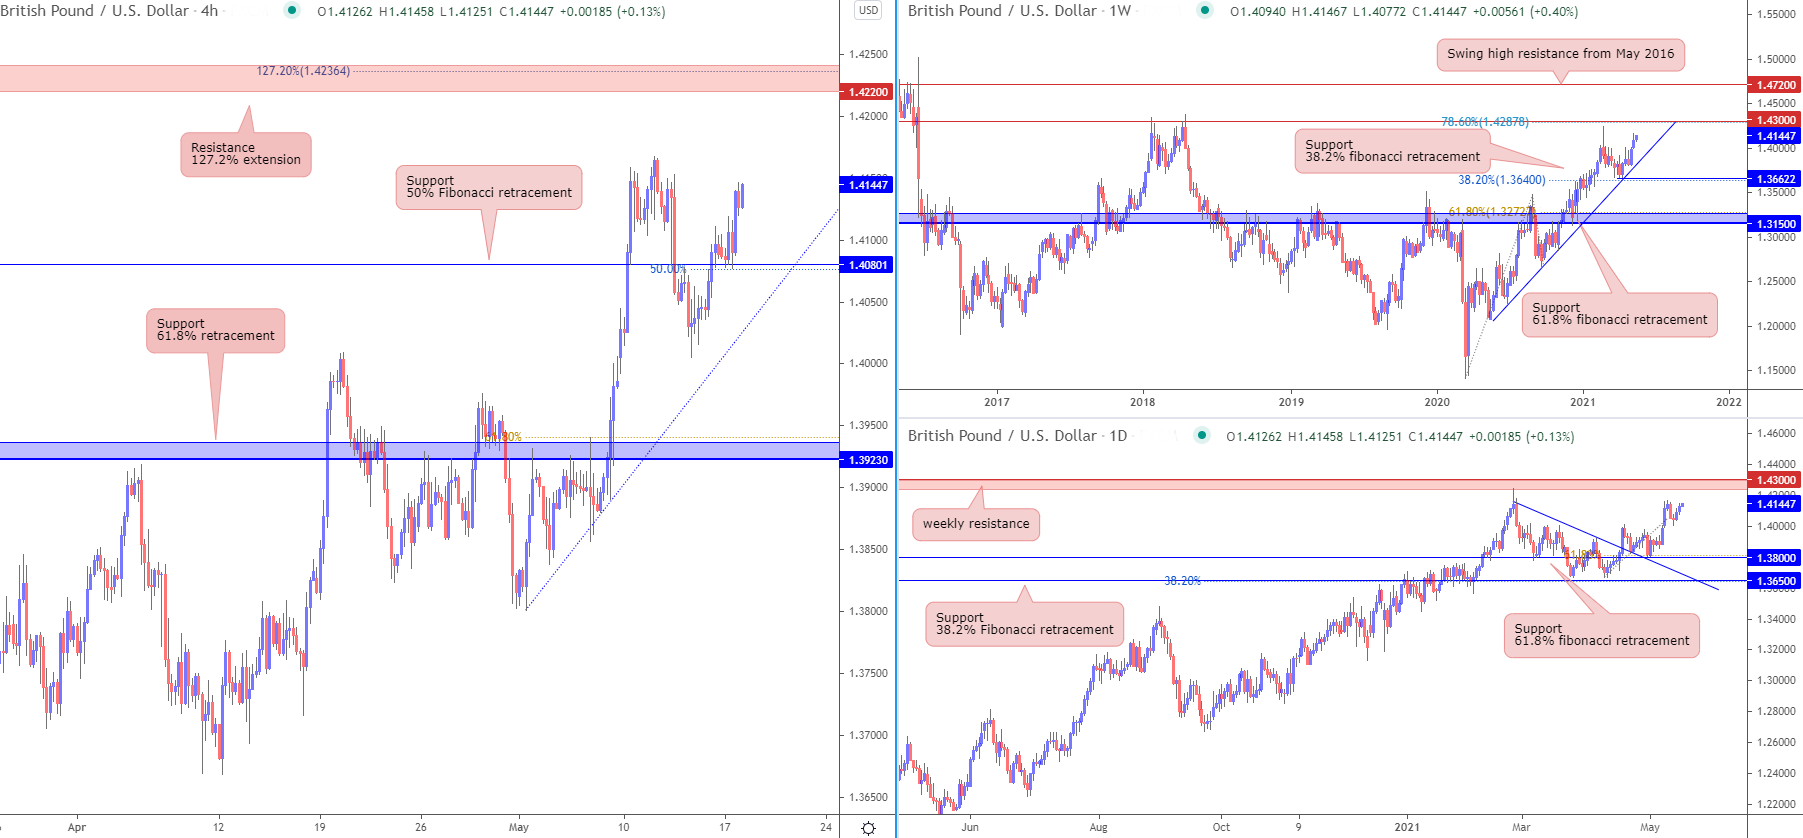
Looking at the weekly chart, we can see that prices are facing bullish pressure from our ascending trend line and support at 1.36622 where we could see a further upside above this level to our resistance target at 1.43000, in line with the 78.6% fibonacci extension. The daily time frame echoes the same bullish view as well where we could see a limited upside above our support level at 1.38000 with 1.43000 as our resistance target.
On the H4 timeframe, prices are facing bullish pressure from our support at 1.40801, in line with the 50% fibonacci retracement where we could see a further upside above this level with 1.42200 as our resistance level. Failure to hold above our support level at 1.40801 could see price swing towards our next support target at 1.39230.
Areas of consideration:
- 1.42200 resistance area found on H4 time frame
- 1.40801 support area found on H4 timeframe
AUD/USD:
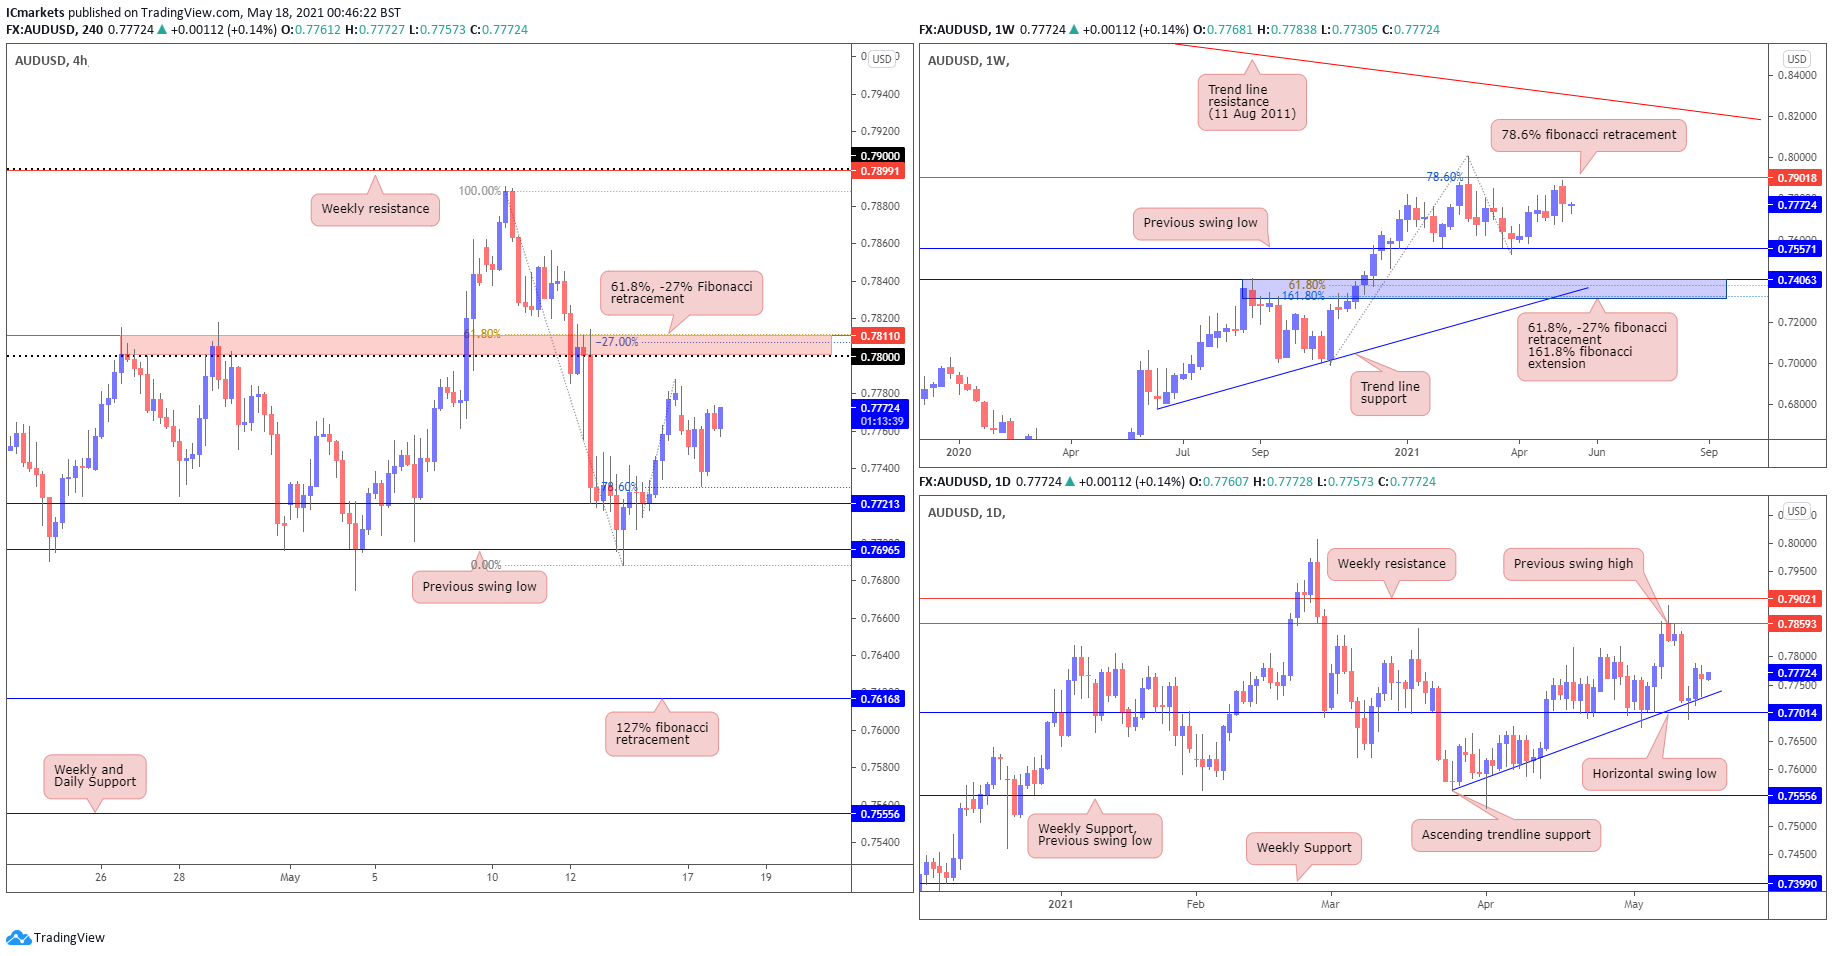
From the Weekly timeframe, price approached the resistance level at 78.6% fibonacci retracement level of 0.79018, before pushing away. From the daily timeframe, we see that price bounced from the horizontal swing low level at 0.77014. Therefore, both Weekly and Daily are showing that price is trending within this range of support and resistance.
On the H4 timeframe, we see price bounced from the 78.6% fibonacci retracement level and is making its way up towards the 0.78 major level, in line with 61.8%, -27% fibonacci retracement and horizontal graphical overlap.
Areas of consideration:
- H4 is returning to the 0.78 major level, in line with 61.8% and -27% fibonacci retracement.
- Daily and weekly time frames showing price trending between resistances and support areas.
USD/JPY
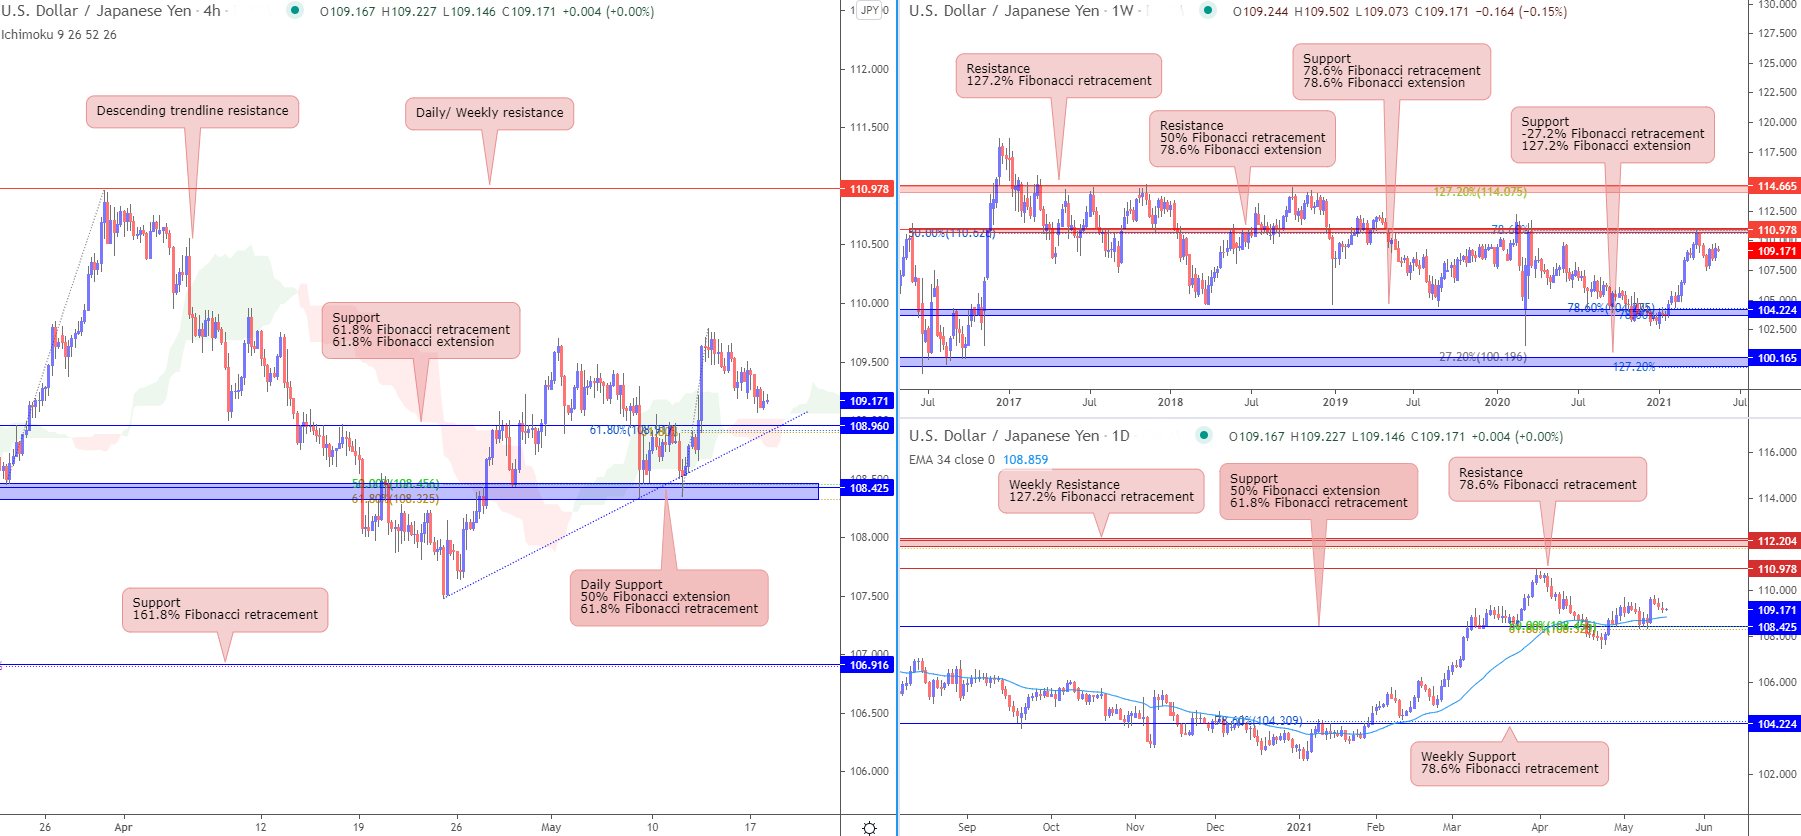
From the weekly timeframe, prices are facing resistance from horizontal swing high resistance which coincides with 50% Fibonacci retracement and 78.6% Fibonacci extension, taking support from 104.224 level which is in line with 78.6% Fibonacci retracement and 78.6% Fibonacci extension. On the daily time frame, prices are facing support from 108.425 level which coincides with 61.8% Fibonacci retracement and 50% Fibonacci extension. Prices might bounce towards daily resistance level 110.978 in line with 78.6% Fibonacci retracement. Daily EMA is also below prices, showing a bullish pressure for prices.
On the H4 timeframe, prices have broken out of descending trendline resistance and is currently taking support from ascending trendline support. Prices might take support on 108.960 support level in line with 61.8% Fibonacci retracement and 61.8% Fibonacci extension. Prices might push up towards daily resistance level of 110.978. Ichimoku cloud is also below prices, showing a bullish pressure for prices.
Areas of consideration:
- On the H4, prices might push up towards 110.978 daily resistance level
- 108.960 support level on the H4 timeframe
- 108.425 support level on the daily timeframe
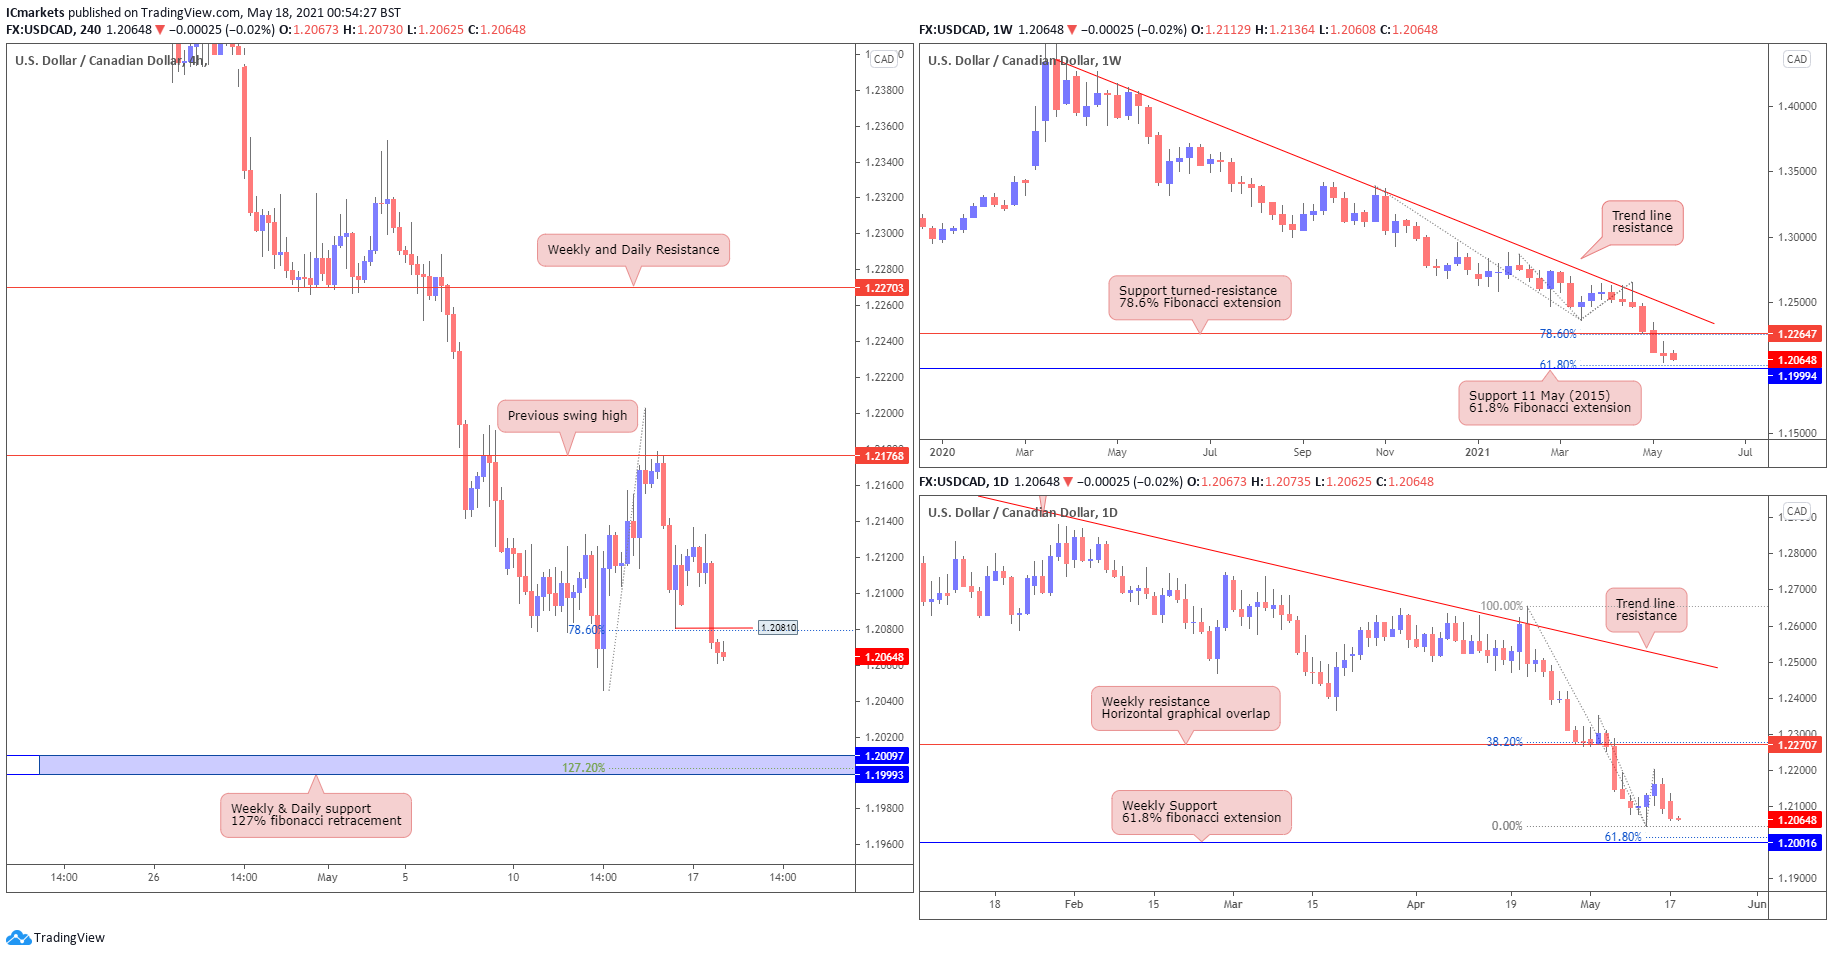
USD/CAD:
The weekly chart shows price breaking below the support level at 1.22647, in line with the 78.6% fibonacci extension. From here, we may see a further drop down towards the horizontal swing low from 11th May (2015).
In the daily time frame, we can see price making a push down towards the horizontal graphical overlap in line with weekly support at 1.20016, in line with 61.8% fibonacci extension.
The H4 timeframe we see that price has broken beneath the 78.6% fibonacci retracement level and may be heading lower towards 1.20097, in line with Weekly, Daily support and 127% fibonacci retracement.
Areas of consideration:
- The weekly and daily time frame shows a break in the strong support level and may continue its bearish momentum.
- On H4, price may retest the level of 1.20810 before pushing lower to 1.20097
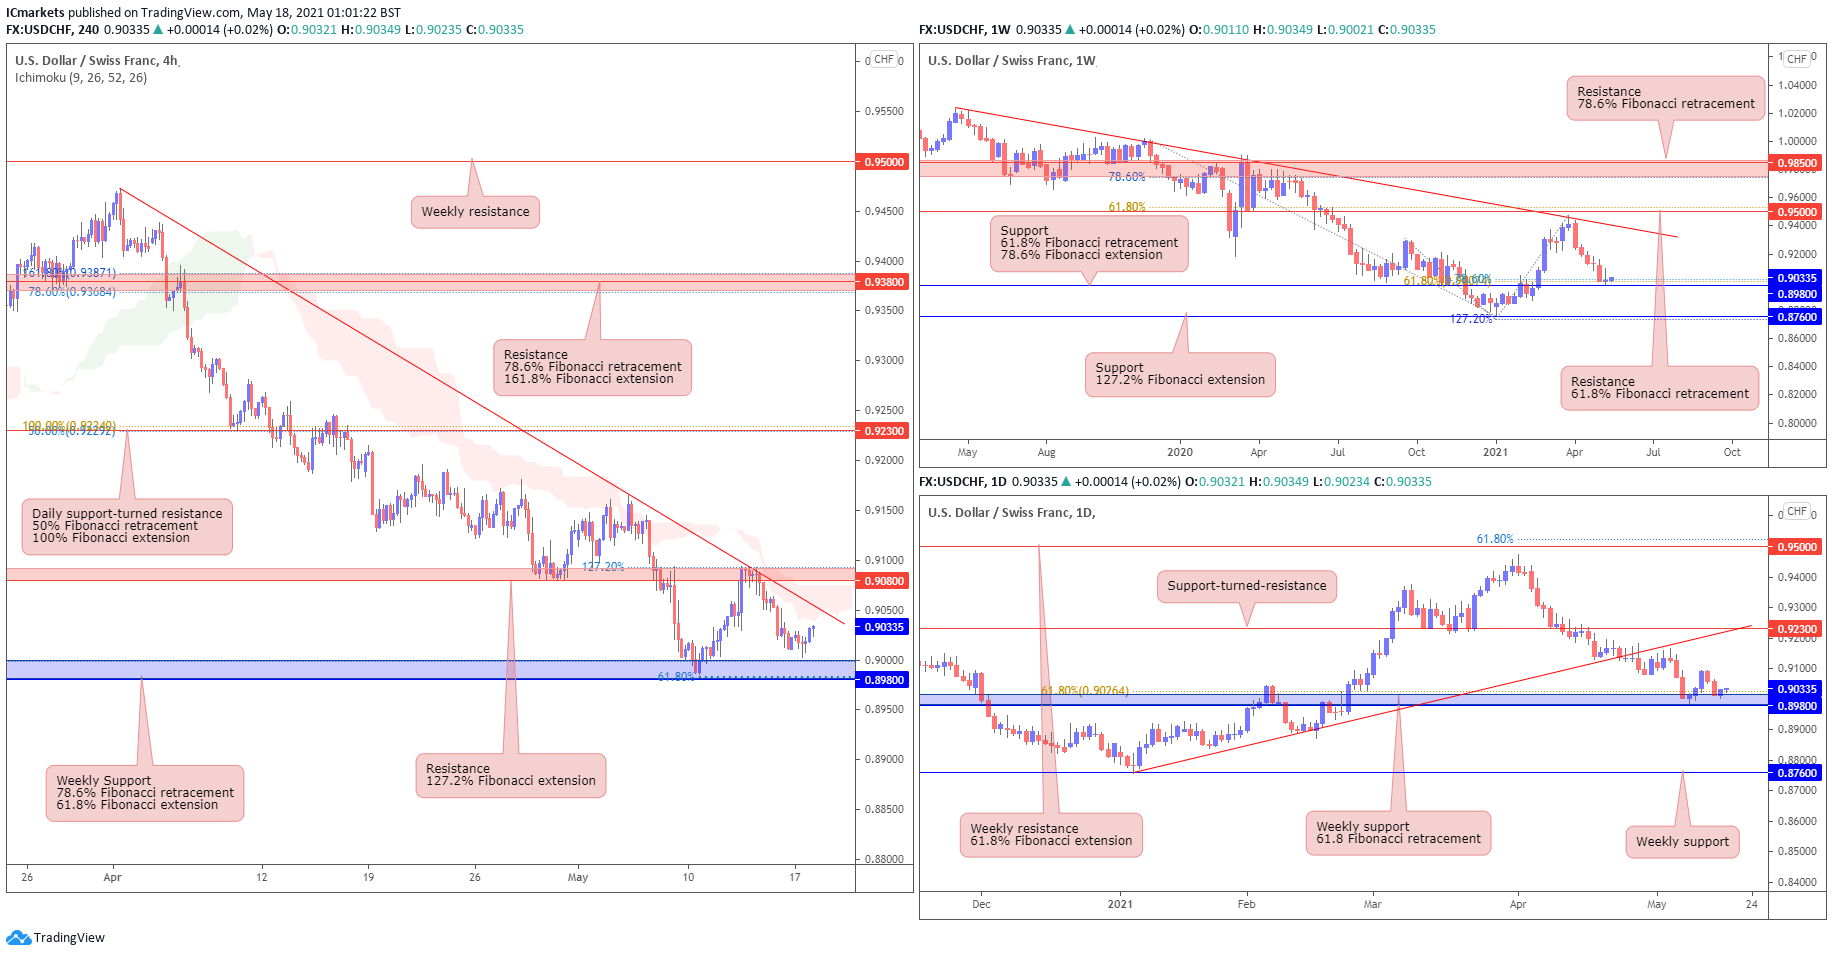
USD/CHF:
USD/CHF is now testing the weekly 0.89800 support, in line with 61.8% Fibonacci retracement and 78.6% Fibonacci extension. The daily chart shows that price is now holding below the key daily 0.92300 support-turned-resistance, and has also broken below the ascending trendline support-turned-resistance. The weekly 0.89800 support level is a key level to watch.
On the H4 chart, we can see that price has now pushed lower and bounced from the 0.89800 support, in line with 78.6% Fibonacci retracement and 61.8% Fibonacci extension. We also note that price is holding below the descending trendline resistance and Ichimoku cloud resistance, showing bearish pressure in line with our analysis. In this scenario, price could reverse from the descending trendline resistance and face further downside. Otherwise, we could see price pullback again to retest the 0.90800 resistance.
Areas of consideration:
- The 0.89800 weekly support is a key intraday level to watch.
- Price is facing bearish pressure as it holds below the Ichimoku cloud and descending trendline resistance.
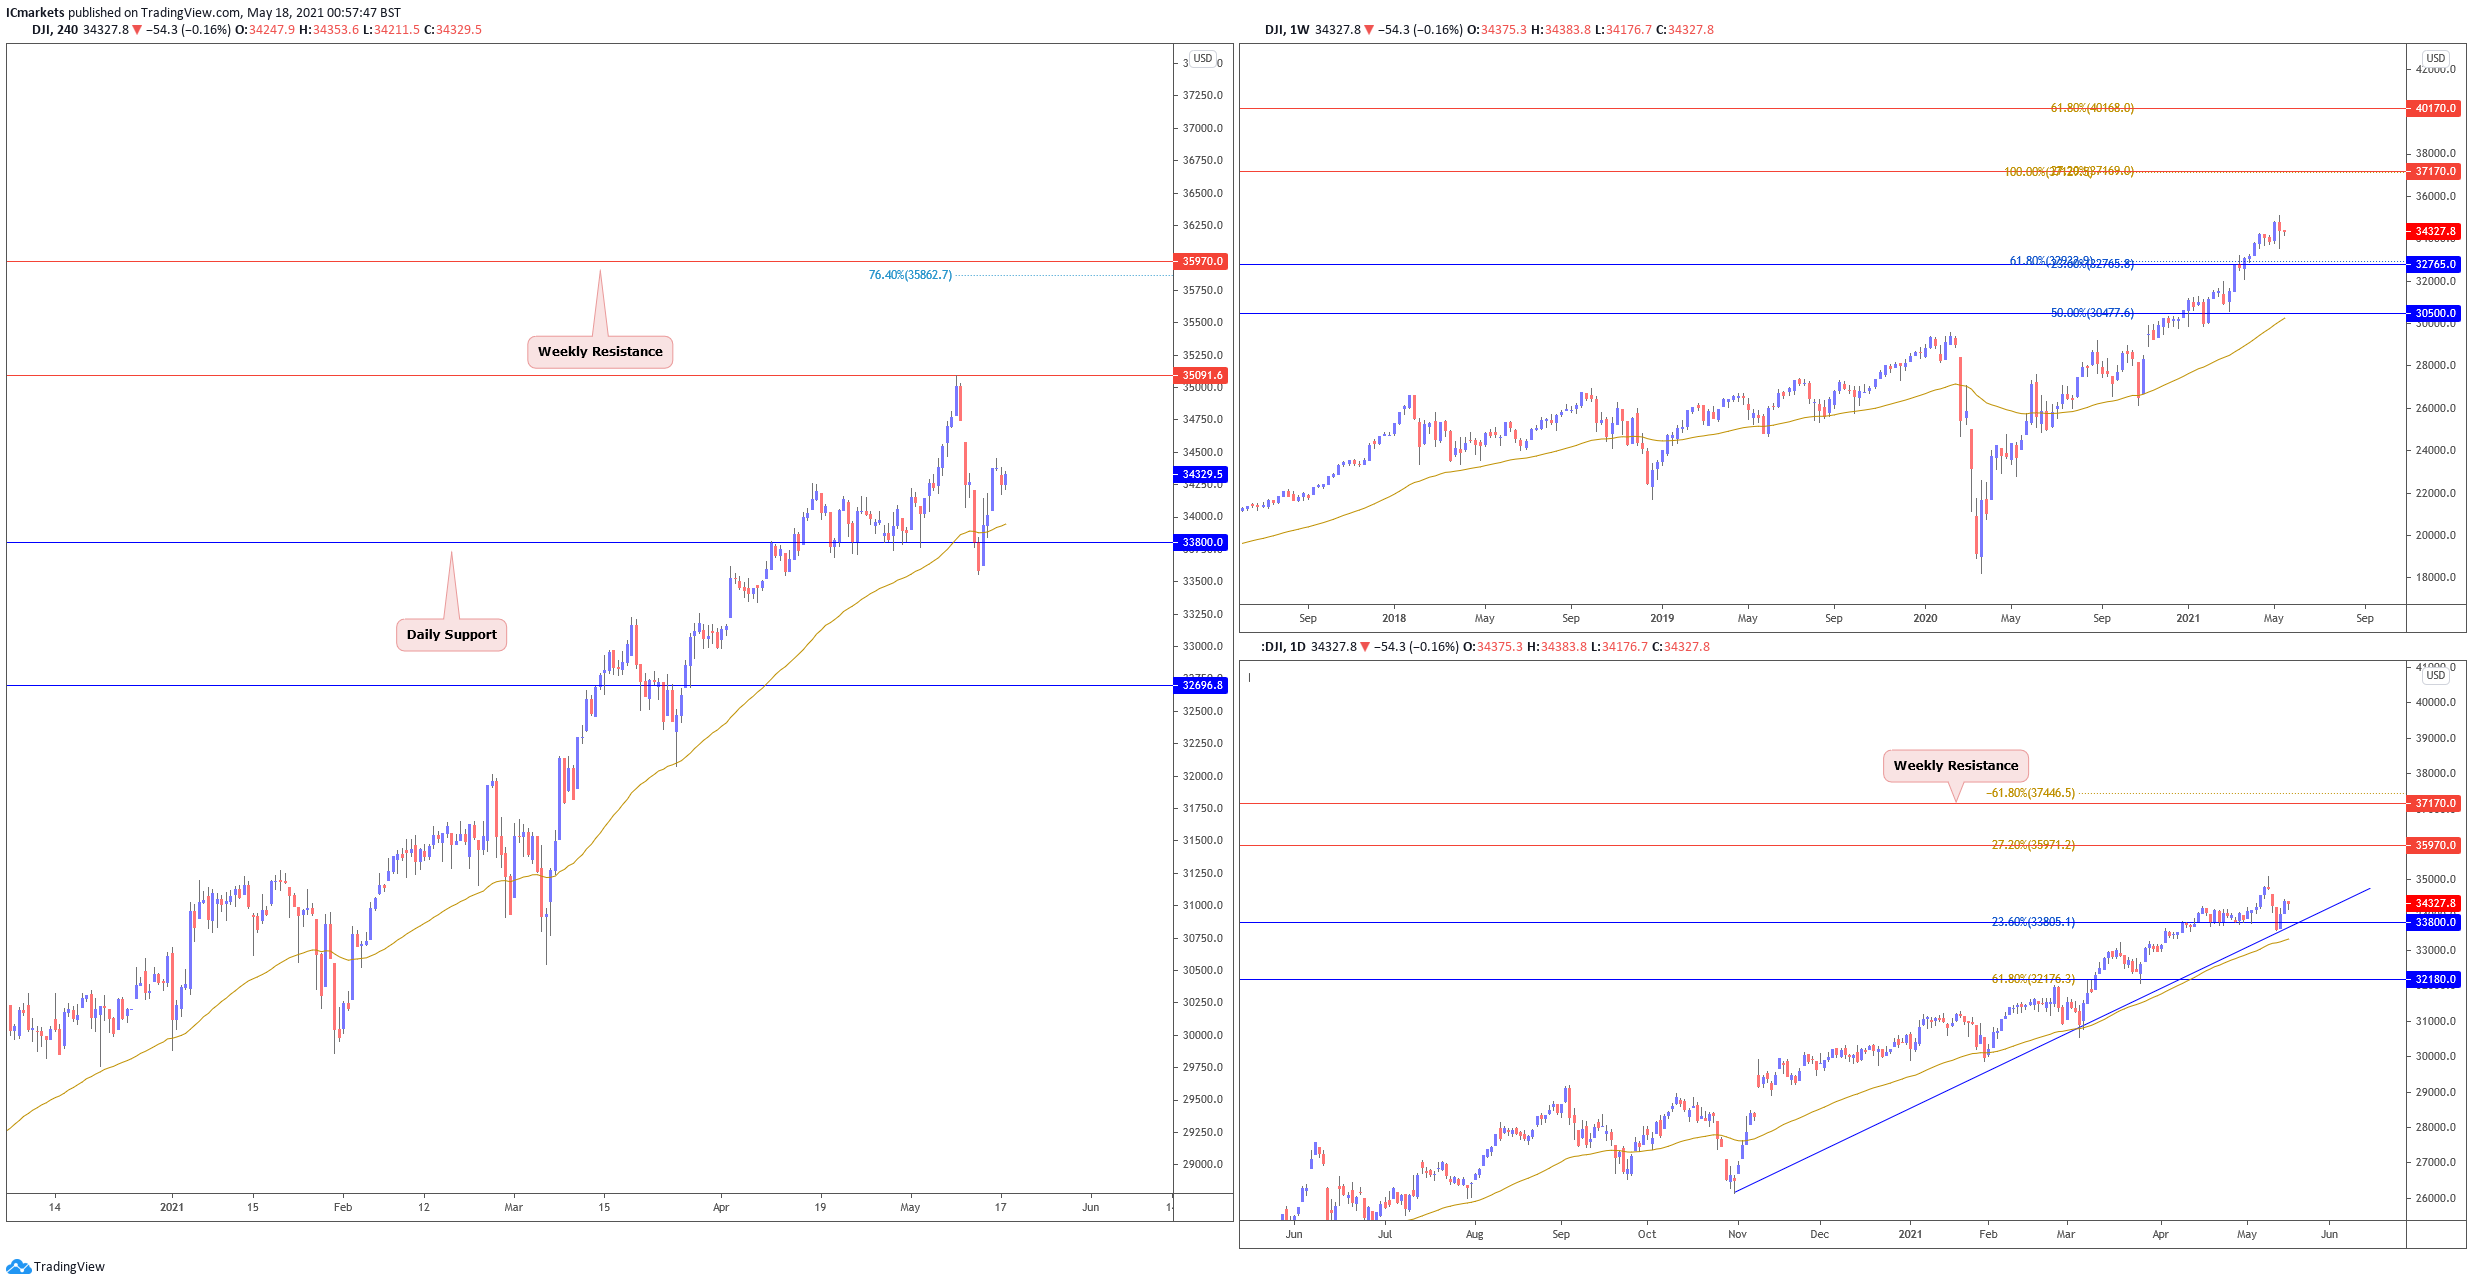
Dow Jones Industrial Average:
On the weekly chart, price traded sideways. With price holding above the long term moving average, we can expect further bullish pressure above 32765 support. On the daily chart, price pulled back lower and reacted above moving average and also above ascending trendline support. It is possible to see buyers add to their longs above 33800 support with upside target at 35970 resistance. Otherwise, price could also swing the other way towards 32180 support.
On the H4, prices have tested and bounced above moving average support. We see a medium probability bullish scenario where buyers could add to their longs with a limited upside push above 33800 support towards 35090 resistance. Otherwise, failure to hold above 33800 should see prices swing the other way towards 32696.
Areas of consideration:
- Technical indicators across all timeframes confirm bullish momentum
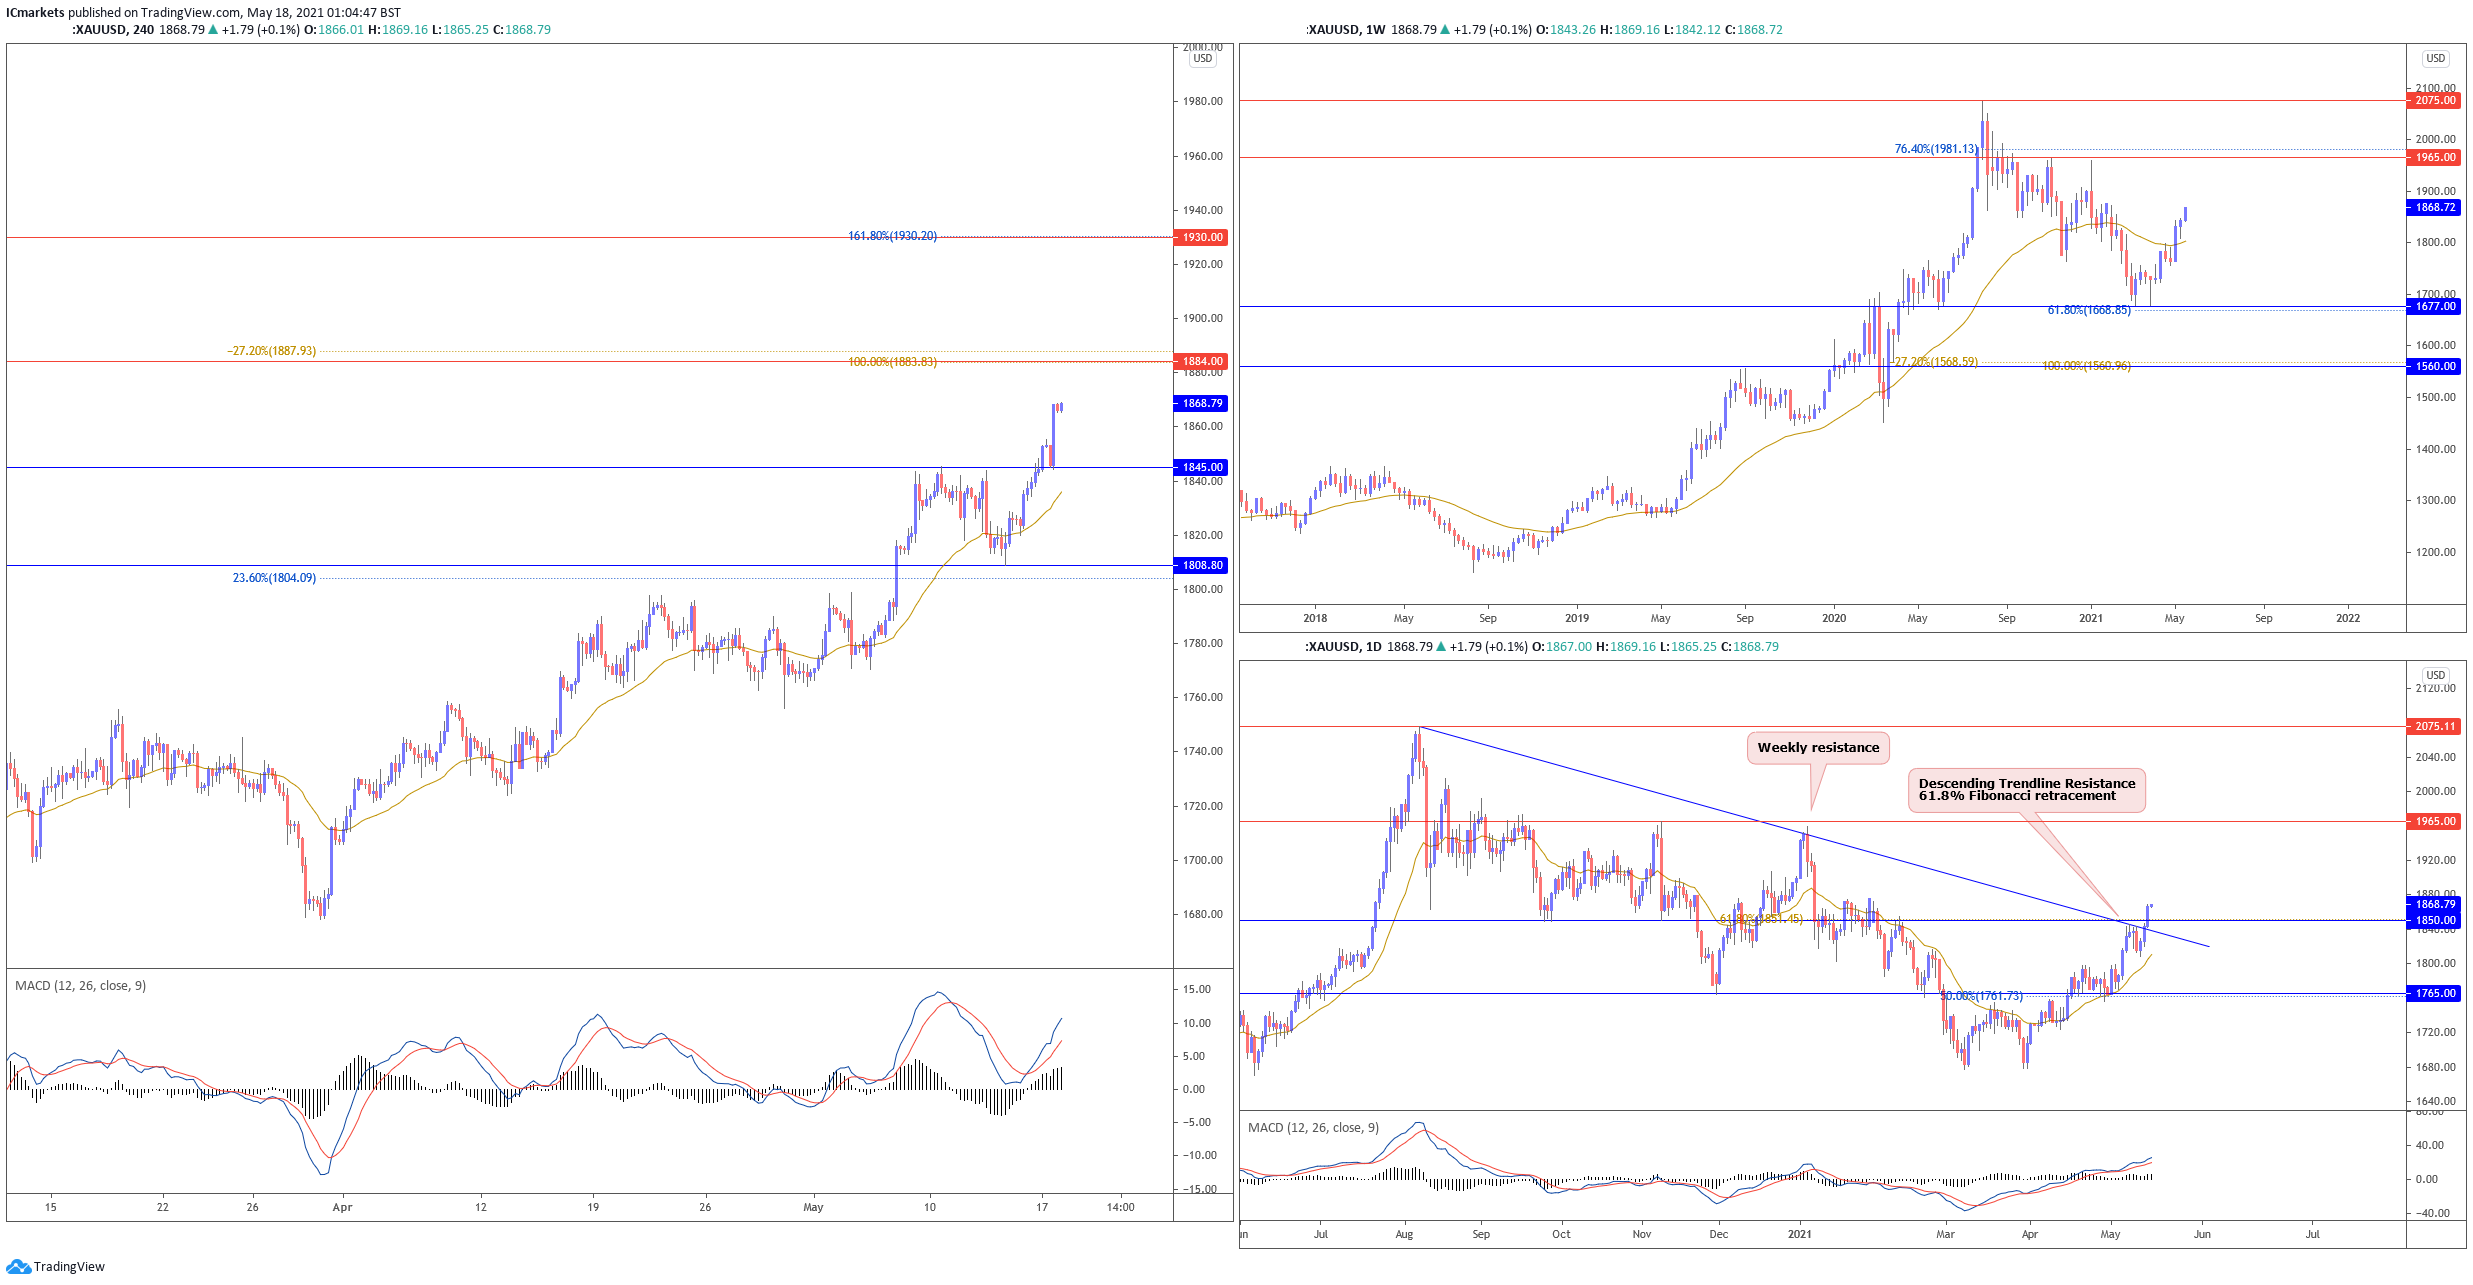
XAU/USD (GOLD):
On the weekly timeframe, price pushed higher, closing above previous weekly resistance. We could see renewed bullish pressure this coming week. On the daily, price broke and closed above descending trendline resistance (now support). There is now a greater probability of a bullish scenario above 1850 support with much room towards 1965 resistance. Otherwise, a break below 1850 support will see price re-intergrate previous trend.
On the H4, price pushed higher, surpassing previous resistances. While technical indicators show room for further bullish momentum, we do not see any good levels which offer a reasonable risk to reward ratio. We continue to watch 1884 resistance and 1845 support. A break and close above or below these levels will see price push in that direction.
Areas of consideration:
- 1884 resistance level on the H4 time frame
- 1845 support level on the H4 time frame
The accuracy, completeness and timeliness of the information contained on this site cannot be guaranteed. IC Markets does not warranty, guarantee or make any representations, or assume any liability regarding financial results based on the use of the information in the site.
News, views, opinions, recommendations and other information obtained from sources outside of www.icmarkets.com.au, used in this site are believed to be reliable, but we cannot guarantee their accuracy or completeness. All such information is subject to change at any time without notice. IC Markets assumes no responsibility for the content of any linked site.
The fact that such links may exist does not indicate approval or endorsement of any material contained on any linked site. IC Markets is not liable for any harm caused by the transmission, through accessing the services or information on this site, of a computer virus, or other computer code or programming device that might be used to access, delete, damage, disable, disrupt or otherwise impede in any manner, the operation of the site or of any user’s software, hardware, data or property.