
Key risk events today:
UK Average Earnings Index 3m/y; UK Claimant Count Change; UK Unemployment Rate; German ZEW Economic Sentiment; Canada Manufacturing Sales m/m.
(Previous analysis as well as outside sources – italics).
EUR/USD:
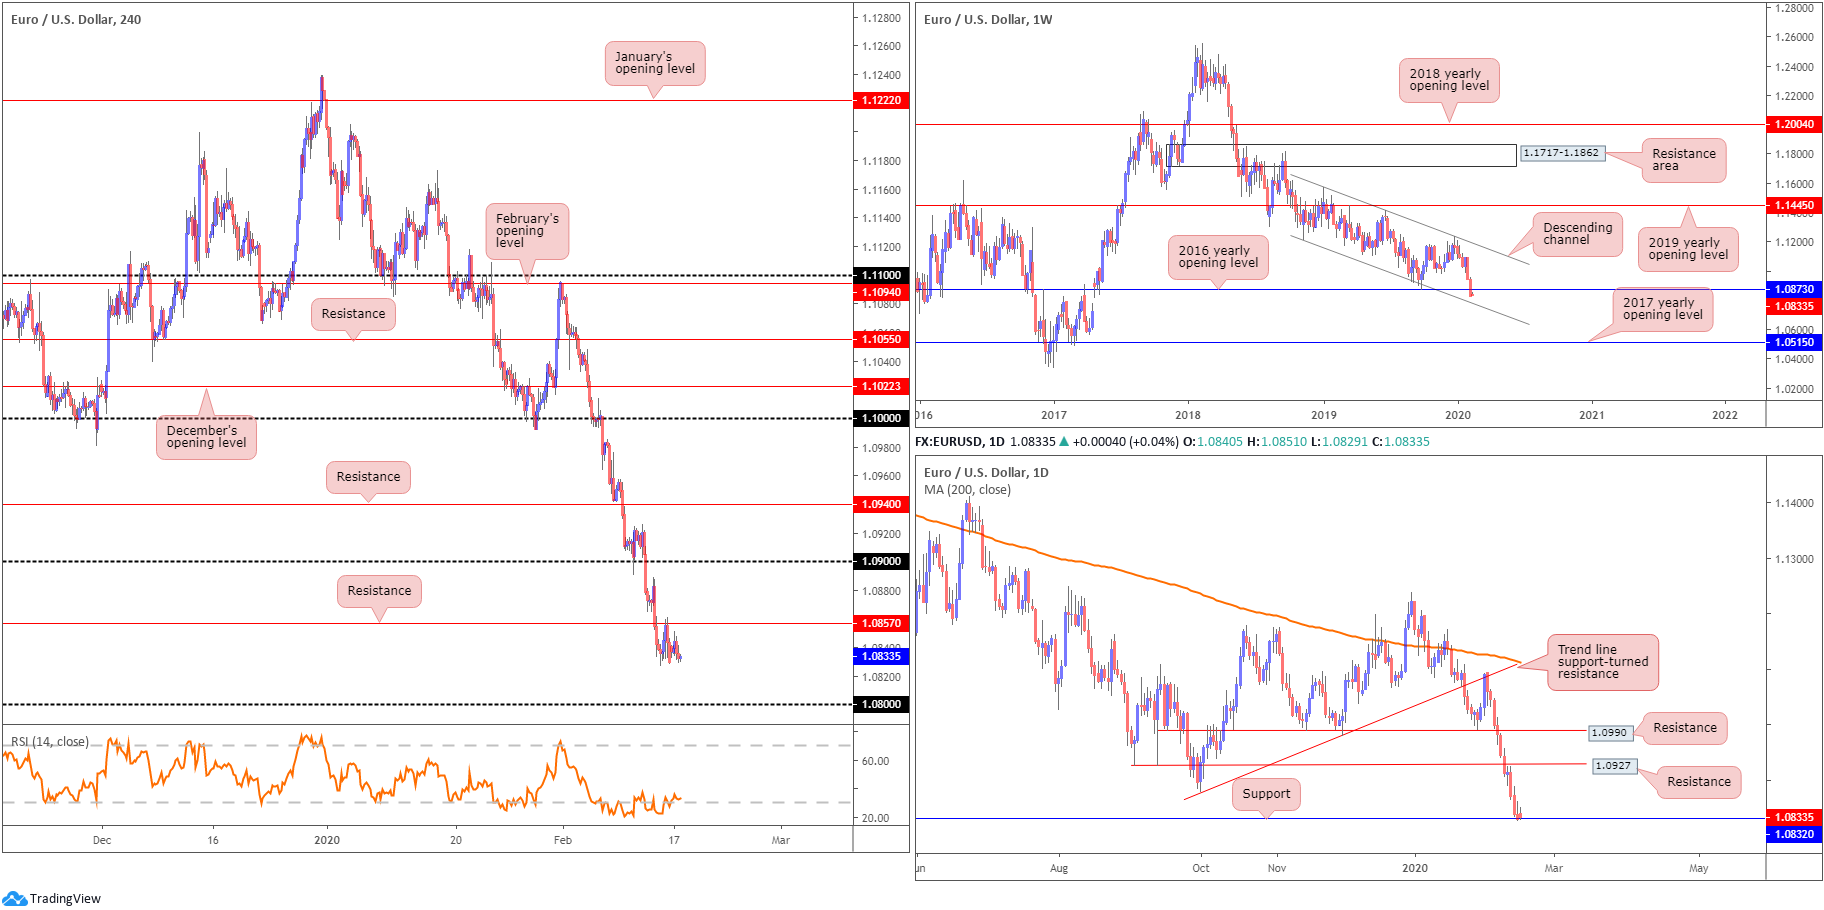
After refreshing multi-year lows at 1.0827 Friday, EUR/USD struggled to find direction Monday as US banks closed in observance of Presidents’ Day – confined within a tight range between 1.0851/1.0829. As a result of yesterday’s lacklustre response, much of the following report will echo thoughts aired in Monday’s technical briefing.
From the weekly timeframe, we can clearly see the pair held the bulk of its losses last week, down more than 1.00% at the close of trade. The 2016 yearly opening level from 1.0873 ceded ground, consequently exposing channel support, taken from the low 1.1109. Further supporting sellers is the primary trend, down since topping in early 2018, at 1.2555.
Following a near-retest at daily resistance drawn from 1.0927 on Wednesday, the pair retained a strong underlying offer into the week’s end. Daily support at 1.0832 entered the fight Friday, though failed to chalk up anything meaningful to the upside. Failure to hold off 1.0832 provides an early cue we’re likely heading for weekly channel support (1.1109) and, on the daily scale, invites an approach to a support level at 1.0612.
A closer reading of price action on the H4 timeframe has the unit holding south of resistance plotted at 1.0857, faced with the possibility of a run towards the key figure 1.08. Indicator-based traders might also be interested to note the EUR/USD’s relative strength index (RSI) has remained within oversold waters since February 6th, though is seen attempting to regain ground, as we write.
Areas of consideration:
With price crossing the 2016 yearly opening level at 1.0873, increased selling on the weekly timeframe is certainly a possibility, at least until we reach channel support around the 1.0780 region.
Daily support at 1.0832 could spark some interest, but given the euro’s softness over previous sessions, it’s a questionable level.
Traders may look for intraday bearish scenarios south of daily support 1.0832, in the event we push for lower ground this week, targeting the 1.08 handle on the H4. 1.08, while a downside target, is also a potential barrier of support, having seen channel support on the weekly timeframe coincide closely with the round number (1.0780).
GBP/USD:
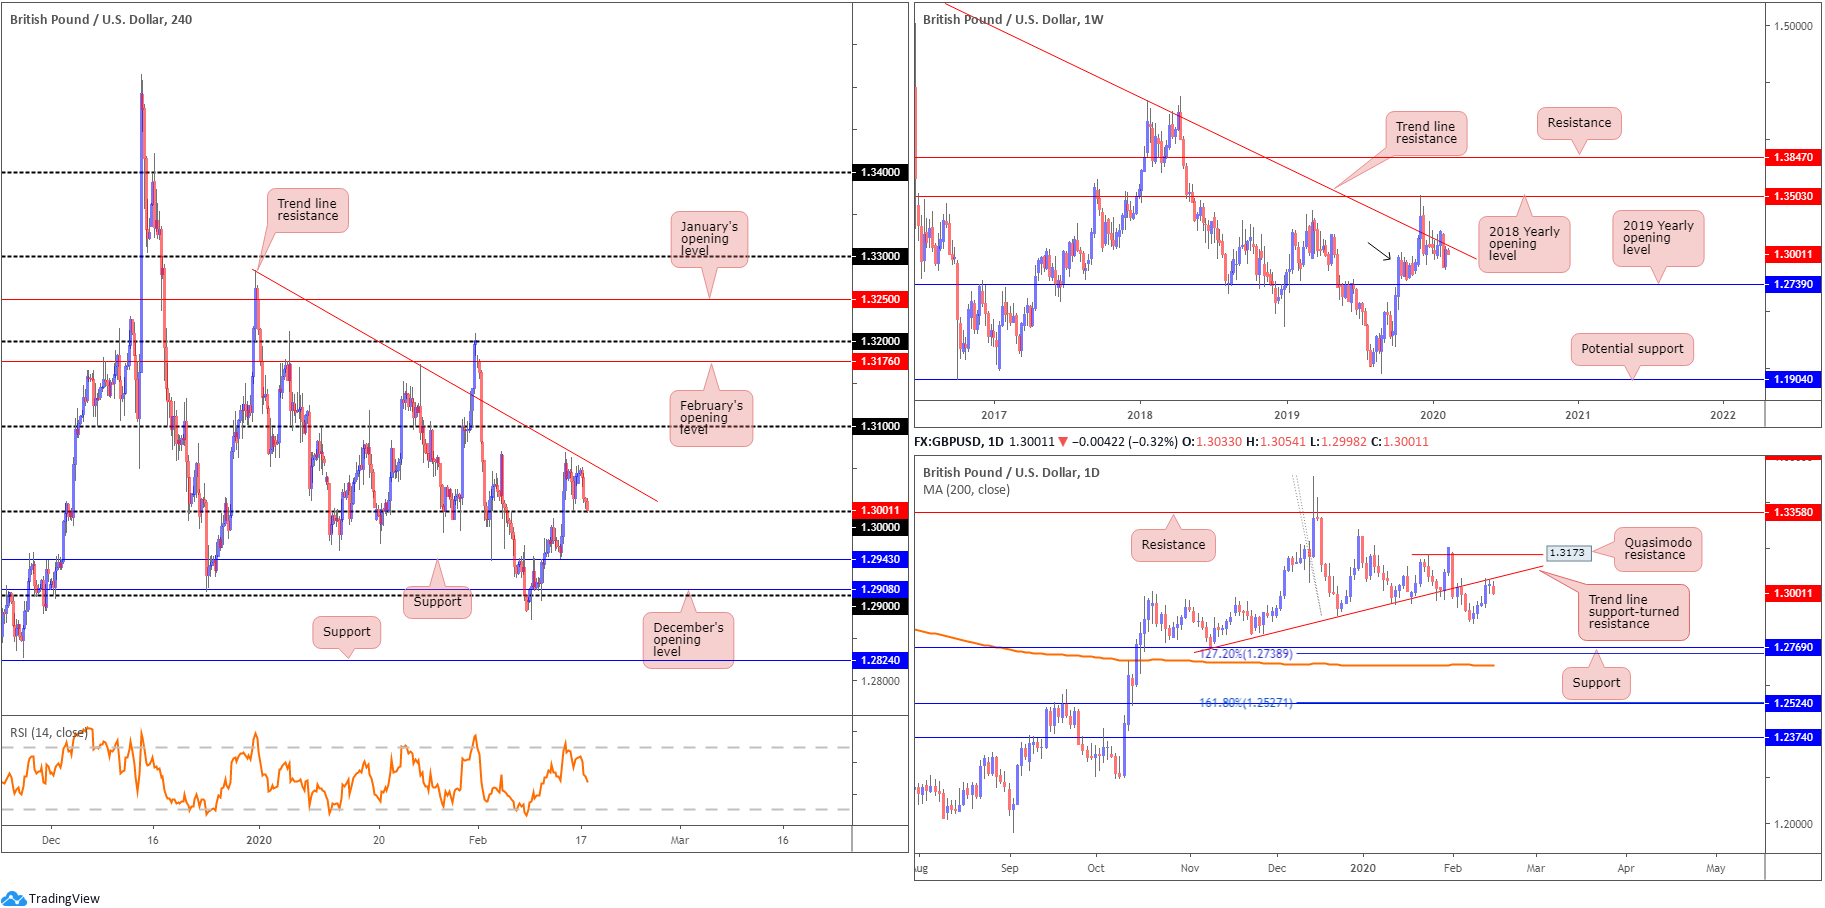
Despite wrapping up the week on firm footing, thanks to Thursday’s politically-driven bid higher, GBP/USD retreated Monday, down more than 0.30%. Reclaiming a portion of last week’s gains, the pair dipped a toe in waters south of the key figure 1.30, leaving H4 trend line resistance, extended from the high 1.3284, unchallenged. Beyond 1.30, key levels of support this week fall in at 1.2943, December’s opening level at 1.2908 and the 1.29 handle.
On a wider perspective, we have the weekly timeframe languishing beneath long-standing trend line resistance, pencilled in from the high 1.5930, though demand around the 1.2939 region is also still in motion (black arrow). Continued downside may imply a break of the said demand, tripping sell stops and testing the 2019 yearly opening level at 1.2739. A break higher, on the other hand, could see the 2018 yearly opening level enter the fight at 1.3503.
Last week’s movement on the daily timeframe ended at the underside of a trend line support-turned resistance, extended from the low 1.2768. Although sporting a half-hearted indecision candle Friday, sellers stepped in Monday and look poised to challenged lower levels. Aside from the 1.2872 February 10th low, further selling may set the stage for a run to support fixed at 1.2769, a 127.2% Fibonacci extension at 1.2738 and the 200-day SMA (1.2688). Note the said SMA has been flattening since mid-October 2019.
Areas of consideration:
In view of the higher-timeframe’s confluence, a move beneath 1.30 is in the offing, with potential to test the H4 supports highlighted above.
Therefore, a H4 close below 1.30 may serve as an entry trigger for some; others may require additional confirmation, such as a retest at 1.30, followed by a H4 bearish candlestick signal (entry and risk levels can be found on the back of the candlestick pattern’s structure).
AUD/USD:
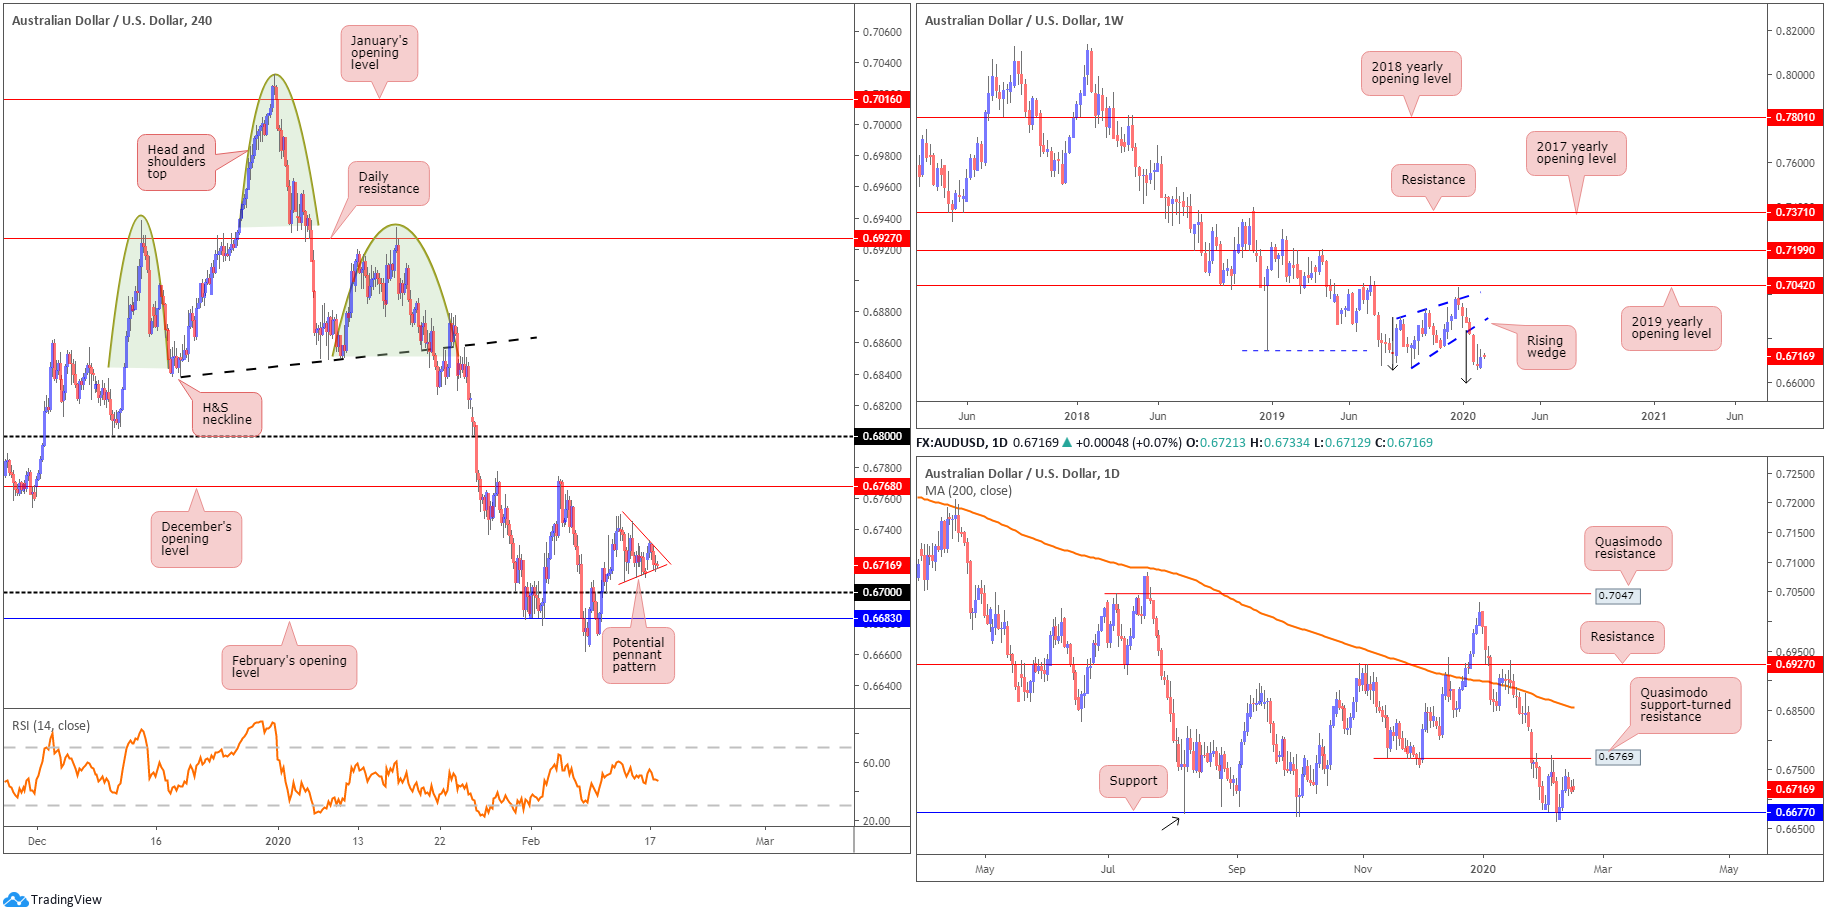
AUD/USD exhibited a reasonably tame opening session Monday, clocking highs of 0.6733 and a low plotted at 0.6713. In terms of technical structure, Most of Monday’s technical briefing remains actionable.
Since registering a bottom in late September at 0.6670 (2019), weekly price carved out a rising wedge formation, typically considered a continuation pattern within a trending environment. The past six weeks witnessed price decline back into the rising wedge and extend beyond the lower boundary. With the primary downtrend having been in full force since topping at 0.8135, in early 2018, further downside is possible, despite last week’s modest recovery. Assuming a close beneath the 0.6670 September 30th low, the rising wedge take-profit (black arrows – calculated by taking the height of the base and adding it to the breakout point) is seen at 0.6599, followed by support at 0.6359 (not visible on the screen).
The daily timeframe has buyers and sellers squaring off between support from 0.6677 and Quasimodo support-turned resistance at 0.6769. The next support target beyond 0.6677, in the event of further selling, falls in around 0.6508 (not visible on the screen). Traders may also want to note the 200-day SMA (orange – 0.6854), should we push for higher levels (trading lower since April 2018).
Since Wednesday last week, AUD/USD struggled to generate much by way of noteworthy price movement, fluctuating within a reasonably tight range in the shape of a pennant pattern (red lines – 0.6745/0.6707), ahead of the 0.67 handle. To the upside, the chart shows the possibility of a run forming to December’s opening level at 0.6768.
Areas of consideration:
Weekly price invites further selling, according to our chart studies. Daily price could, nonetheless, pop to 0.6769 before we navigate lower ground, as could H4 price to 0.6768.
Focus, therefore, remains around the 0.6768 region for potential shorting opportunities. An upside break out of the current H4 pennant formation could be taken as an early cue we’re heading for 0.6768.
The combination of H4 and daily resistance is likely to prompt a move lower, with the 0.67 handle on the H4 open as an initial downside target. Therefore, traders who plan on attempting a long out of the said pennant may want to take into account the said resistances.
USD/JPY:
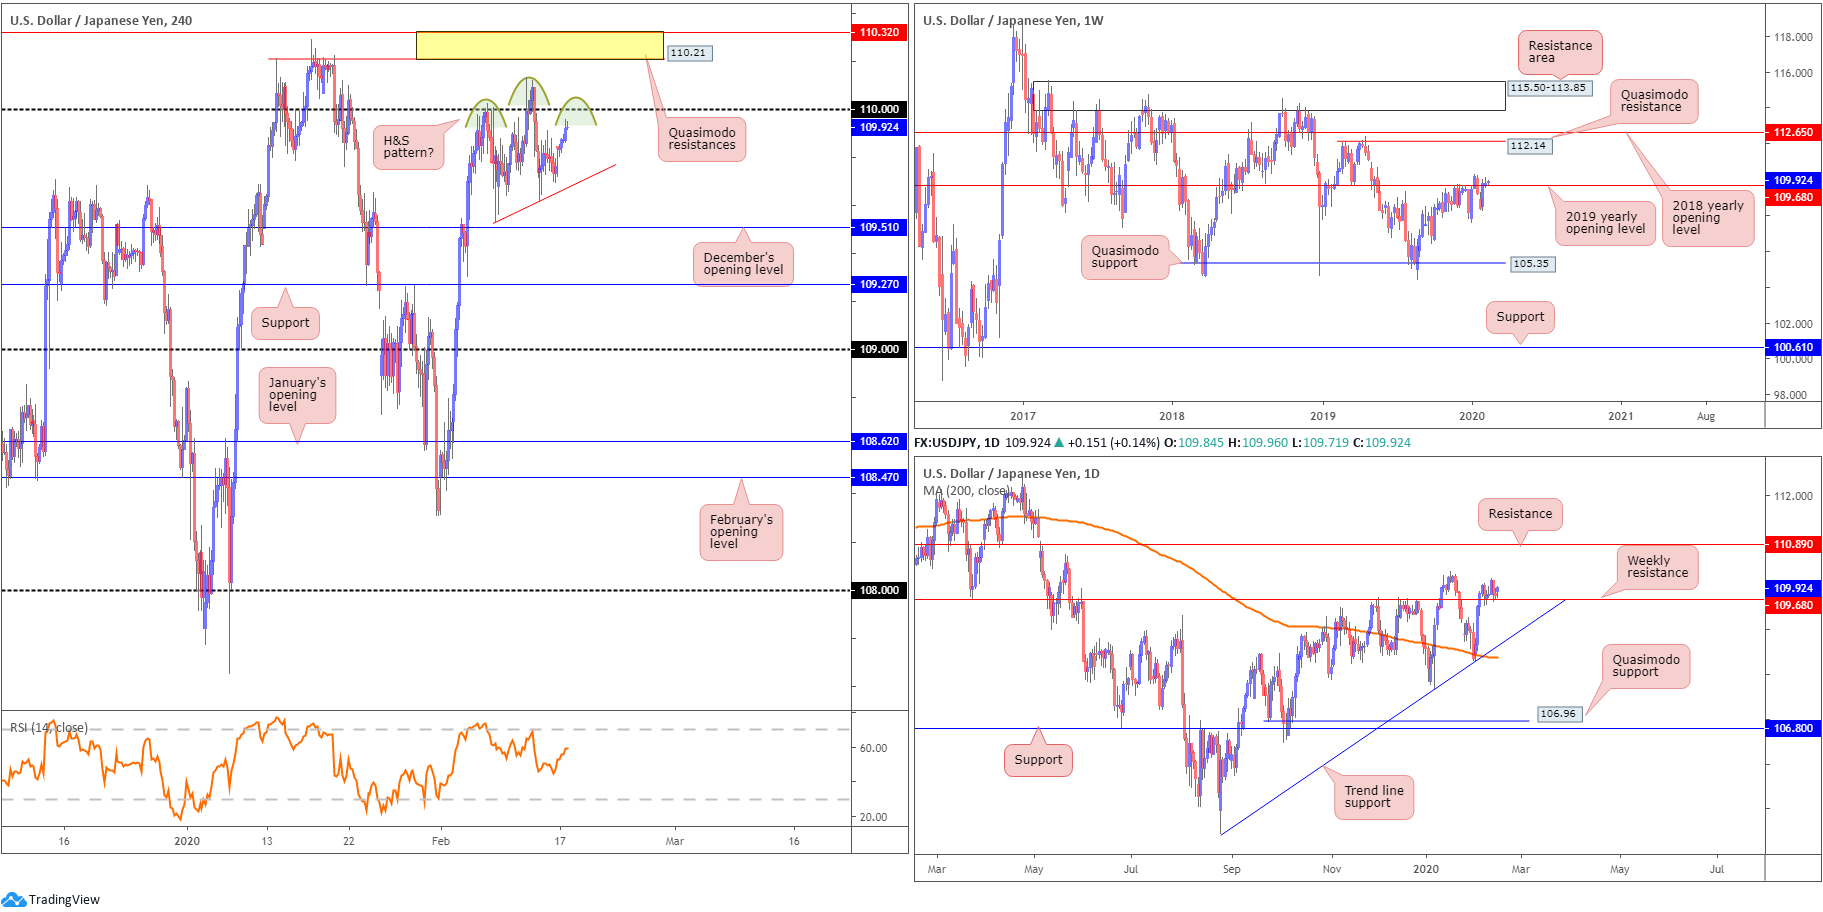
USD/JPY concluded Monday around the top edge of its daily range amid holiday-thinned trade, scoring highs just shy of the 110 handle. Should a retest at 110 hold today, this may turn price action lower and produce a right shoulder for a head and shoulder’s top (green arcs). The red line, assuming respect at 110, should act as the pattern’s neckline. Outside of this configuration, two layers of Quasimodo resistances are seen at 110.32 and 110.21 (yellow). Downside supports also remain located at December’s opening level drawn from 109.51, support at 109.27 and the 109 handle.
With respect to the weekly timeframe, the pair continues to hover a few points above the 2019 yearly opening level at 109.68. As evident from the weekly chart, though, buyers lacked enthusiasm last week. A decisive push north of the said barrier underlines a possible approach towards Quasimodo resistance at 112.14, closely followed by the 2018 yearly opening level at 112.65. A significant rejection, however, could entice moves to the 107.65 January 6th low. Beneath the aforementioned low, limited support is evident until reaching the 106.48 September 30th low, followed by Quasimodo support coming in at 105.35.
Price continued to retest the current weekly resistance as support on the daily timeframe last week. Failure to hold has trend line support, extended from the low 104.44, in view, followed by the 200-day SMA (orange – 108.38). Moves higher, on the other hand, could have resistance at 110.89 enter the mix. So far, we’ve yet to see much from price action suggesting buyer intent.
Areas of consideration:
Based on the weekly timeframe’s structure, the 2019 yearly opening level at 109.68 remains a probable resistance. Recent movement above the aforementioned level is not a cause for concern (for those with long-term shorts, that is) on the weekly timeframe given the close above the level is less than 10 points, and unlikely sufficient to excite breakout buying.
Daily price shows the unit retesting the weekly level as support, but has yet to pencil in anything of note to the upside, therefore pushing buyers to the sidelines for now.
This leaves H4 movement, which, as highlighted above, threatens a possible retest at 110 and formation of a right shoulder to a head and shoulder’s top. This, according to the pattern’s rules of engagement, is only active ONCE the neckline has been penetrated. Aggressive traders, nonetheless, may try to forecast the right shoulder and secure more favourable risk/reward.
USD/CAD:
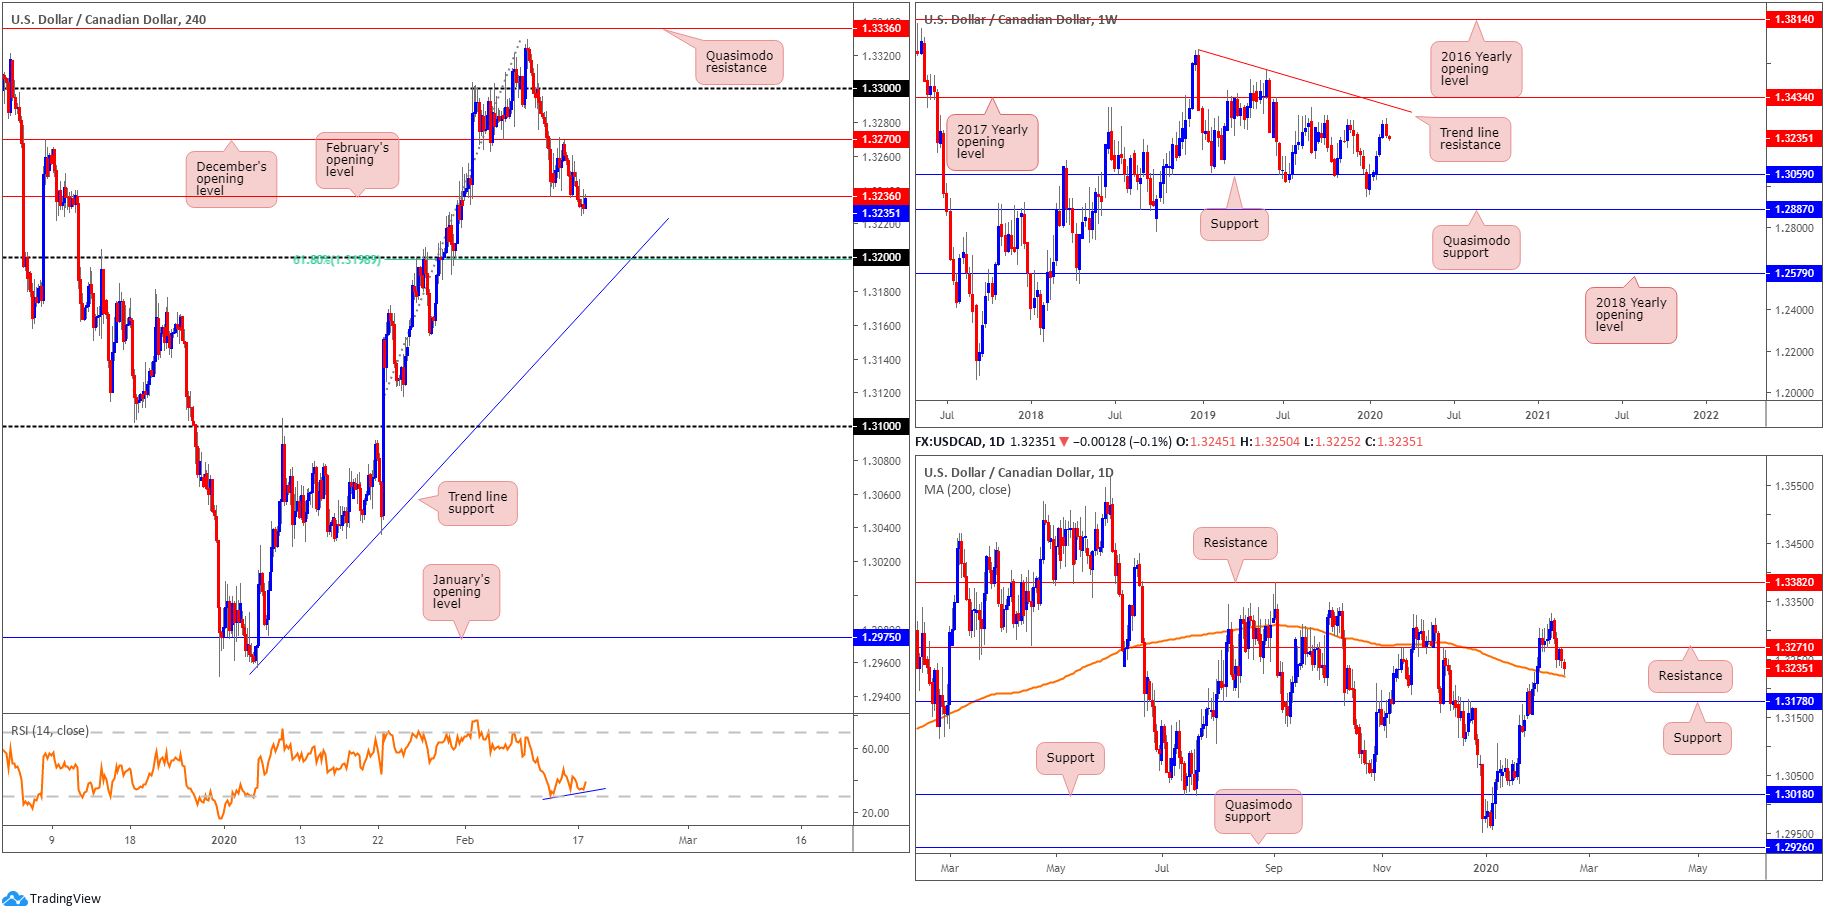
After snapping a five-week bullish phase last week, weighed by a stronger-than-expected recovery in oil prices, Monday witnessed reasonably subdued trade, marginally dipping a toe in waters south of February’s opening level at 1.3236. Assuming 1.3236 continues to represent resistance, this could potentially set the stage for an approach to the 1.32 handle today, which aligns closely with a 61.8% Fibonacci retracement at 1.3198 and a trend line support, taken from the low 1.2960. The relative strength index (RSI) is seen hovering ahead of its oversold value, currently producing bullish divergence.
Price on the weekly timeframe halted just south of tops around 1.3340 last week. Additional resistance resides at a trend line formation (1.3661) and the 2017 yearly opening level at 1.3434. Support can be found around the 1.3059 neighbourhood.
In conjunction with weekly flow, the daily timeframe recently overthrew support at 1.3271 and retested the level to-the-point as resistance on Thursday. Downside has the 200-day SMA (orange – 1.3220) as potential support, with a break perhaps unlocking the trapdoor to a well-rounded support from 1.3178.
Traders who read recent reports may recall the following pieces:
Well done to any readers short December’s opening level at 1.3270. Take-profit targets reside around the 200-day SMA (1.3221), shadowed by the 1.32 handle on the H4, followed by trend line support, pencilled in from the low 1.2957.
Areas of consideration:
Sellers off 1.3270 are likely watching H4 price to secure a position beneath 1.3236 today. A notable rejection by way of a bearish signal would likely be a welcomed view. Additionally, this could, given weekly price displaying room to the downside, be an area sellers look to get involved, either fresh shorts, or traders looking to pyramid current shorts, with the expectation of the unit shaking hands with at least the 1.32 handle.
USD/CHF:
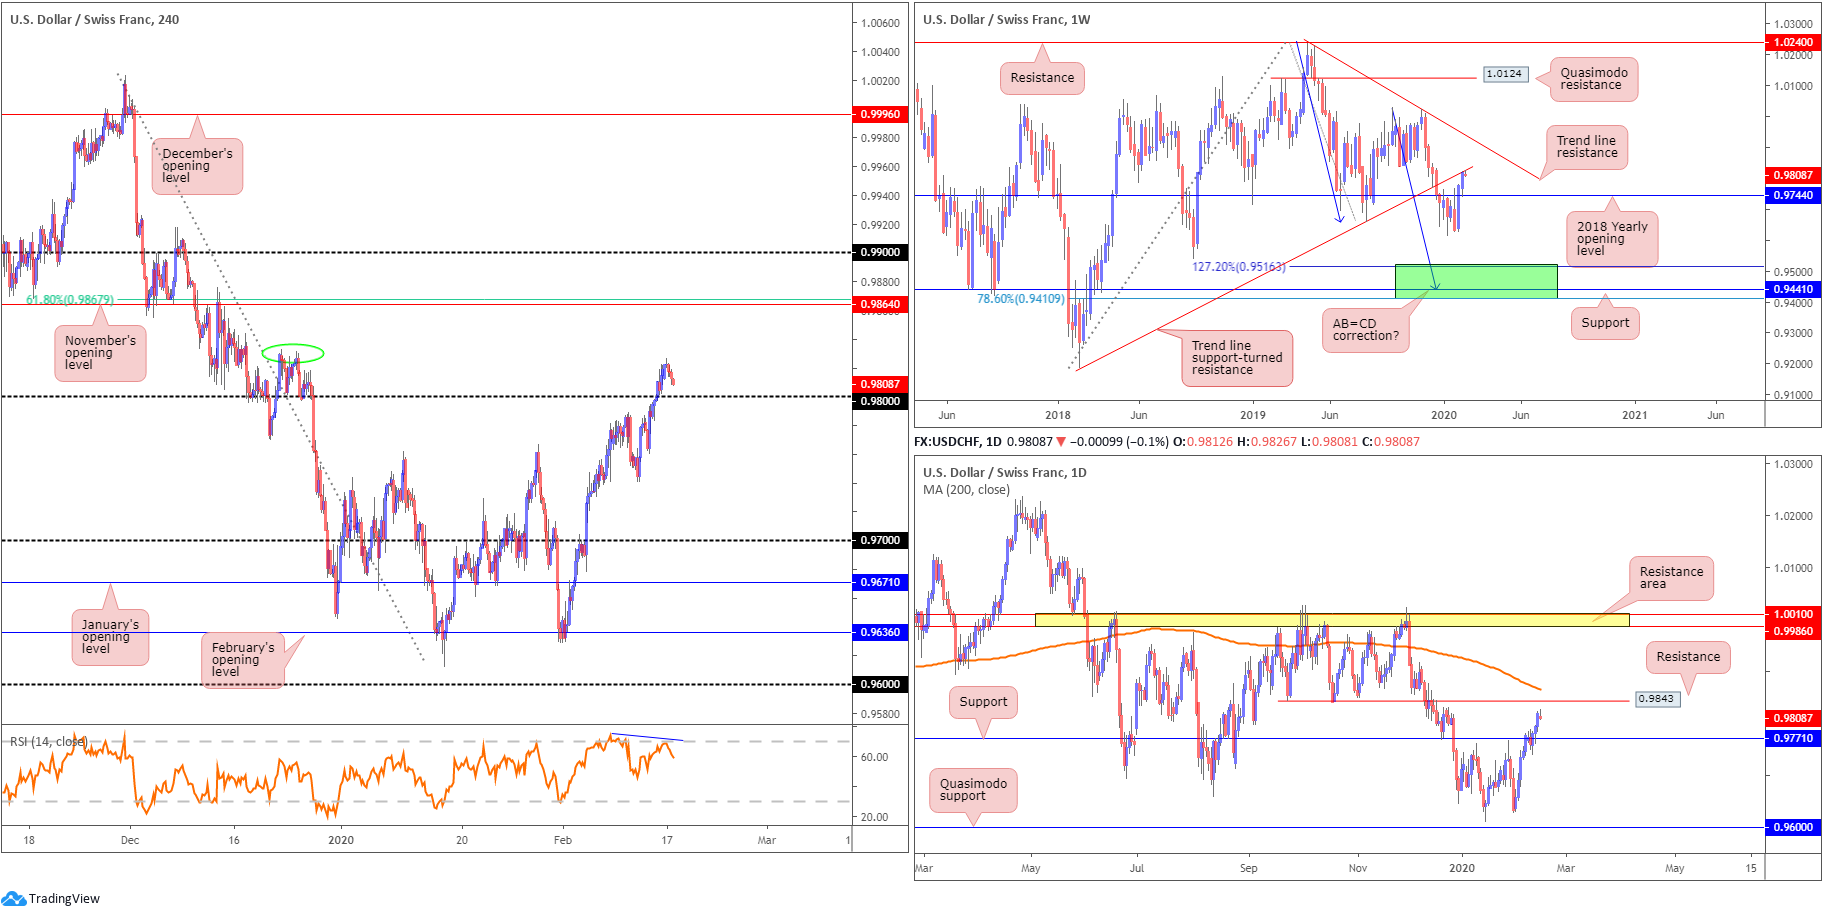
USD/CHF failed to capitalise on recent bidding, amid subdued holiday-thinned movement Monday. The US dollar wrapped up the session a touch lower against the Swiss franc by 0.10%.
Kicking off with a look at the weekly timeframe, we can see price fading a trend line support-turned resistance, drawn from the low 0.9187, perhaps prompting an additional retest at 0.9744, the 2018 yearly opening level. Trend line resistance, etched from the high 1.0236, is next in line in terms of long-term resistance targets this week.
USD/CHF buyers entered a strong offensive phase north of support at 0.9771 last week, positioning the candles within striking distance of resistance at 0.9843 and the 200-day SMA (orange – 0.9865). Continued bidding through the said resistances may encourage more US dollar upside to a resistance area coming in at 1.0010/0.9986.
The violation of the 0.98 handle on the H4 timeframe has local tops to contend with around 0.9830 (green oval), with a break possibly clearing the path for a run to November’s opening level at 0.9864. What’s interesting here is this level also comes with a 61.8% Fibonacci retracement at 0.9867 and the said 200-day SMA. Indicator-based traders may also wish to acknowledge the relative strength index (RSI) is seen chalking up bearish divergence.
Areas of consideration:
Breakout buyers above 0.98 (likely filled at 0.9810, with a protective stop loss order positioned just beneath the breakout candle’s lower shadow at 0.9797) may start to panic in view of Monday’s minor pullback. Other traders are likely honing in on the 0.98 level today for a possible retest setup to enter long.
While longs may very well work in favour, given both the H4 and daily timeframes show room to extend north, the problem is the weekly timeframe recently crossing paths with trend line resistance. Therefore, breakout buyers may consider reducing risk to breakeven at this point, as weekly sellers could absorb bids residing around 0.98 today. Those who feel a retest long entry off 0.98 is still in the offing, waiting for additional candlestick confirmation might be worth considering. Not only will this help identify buyer intent off the round number, it’ll provide clear entry and risk levels to work with.
Dow Jones Industrial Average:
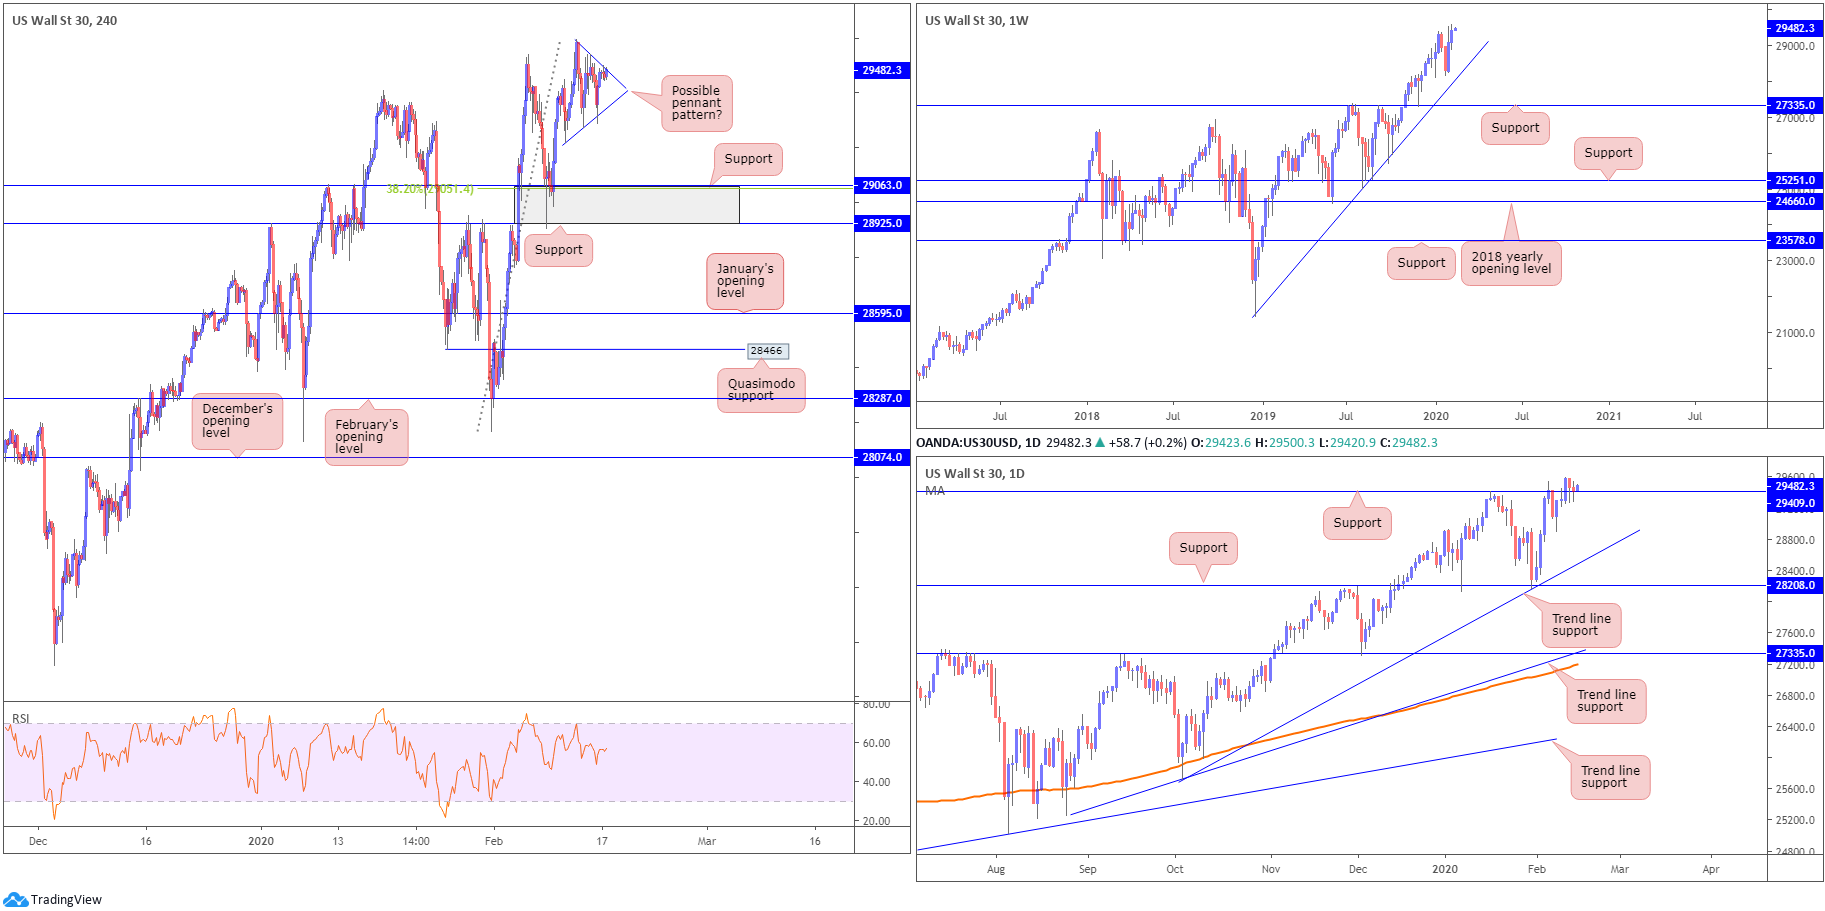
Since early last week, the H4 candles have been carving out a potential pennant pattern (blue – 29219/29595) around fresh all-time highs of 29595. The area marked in grey between 28925/29063 also remains particularly attractive as it holds a 38.2% Fibonacci value at 29051 within.
Further afield, the weekly candles remain in a healthy position north of trend line support, taken from the low 21452. Outside of the aforementioned trend line, support rests at 27335.
Closer analysis of the daily timeframe has current price attempting to defend support at 29409. Should the current candle close by way of a bullish candlestick signal, such as a hammer pattern, longs on the back of this formation will likely materialise.
Areas of consideration:
A decisive H4 close out of the current pennant pattern likely confirms bullish intent off daily support mentioned above at 29409, and will possibly encourage further upside to fresh all-time highs.
Conservative traders may wish to see a retest at the top edge of the broken pennant line before pulling the trigger; others may consider the breakout of the pennant itself to be enough to confirm buyer intent off daily support to justify a long at the close of the breakout candle. Protective stop-loss orders can either be positioned beneath the breakout candle’s lower shadow or south of the pennant’s lower edge.
XAU/USD (GOLD):
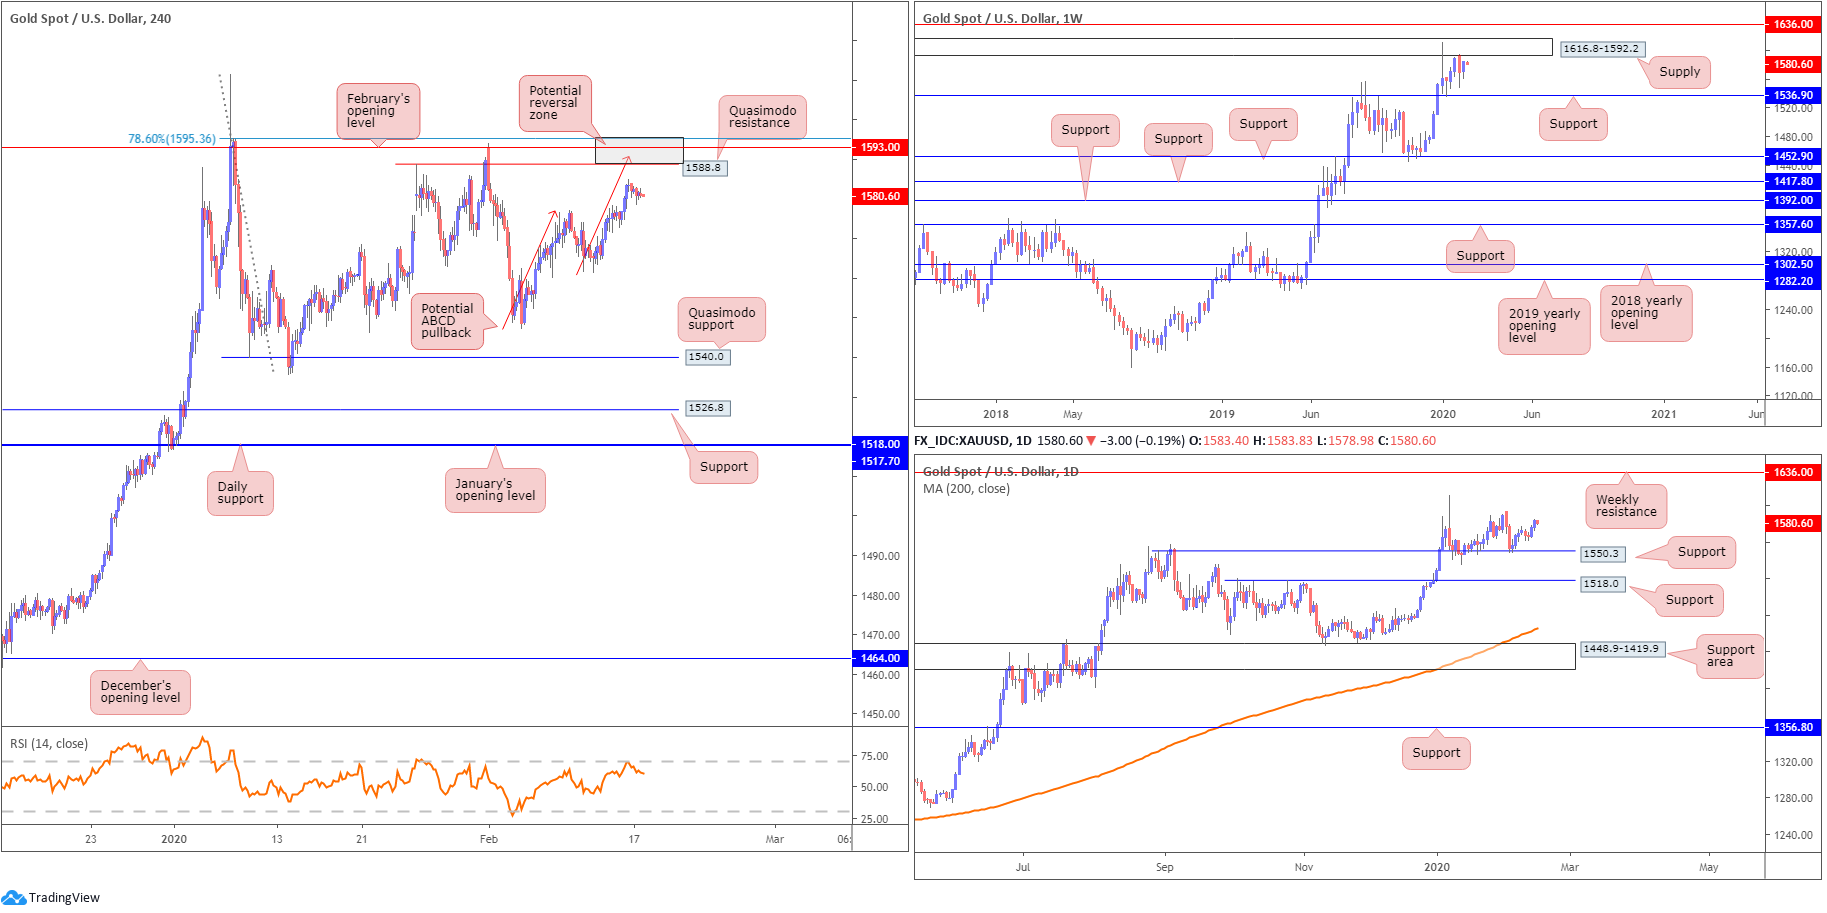
Last week’s stronger-than-expected recovery, lifting bullion more than 0.80%, is seen currently consolidating just south of weekly supply coming in at 1616.8-1592.2 following Monday’s lacklustre session. Since the beginning of the year, longer-term candles on the weekly timeframe have been confined to a range between the said supply and support at 1536.9. Areas outside of this consolidation can be seen at resistance from 1636.0 and support fixed at 1452.9.
Closer analysis of price action on the daily timeframe has the unit extending recovery gains off support at 1550.3, fixed north of another layer of support at 1518.0. Aside from the 1611.3 January 8th high, held by an area of supply drawn from mid-February 2013, the next level of resistance falls in on the weekly timeframe mentioned above at 1636.0.
Thanks to Friday’s upside, the H4 candles are poised to complete an ABCD pullback (red arrows) just north of Quasimodo resistance at 1588.8. What’s also noteworthy from a technical stance is a 78.6% Fibonacci retracement value at 1595.3 and February’s opening level at 1593.0 are positioned close by. Collectively, therefore, we have a potential reversal zone to work with between 1595.3/1588.8. Further supporting this zone, we can see the lower border of weekly supply at 1592.2 is stationed within our H4 resistance base.
Areas of consideration:
Keeping things simple, the research team feels 1595.3/1588.8 is worthy of attention and may cap upside in the event of a test. Aggressive traders will enter as per the structure of the reversal zone, with protective stop-loss orders likely sited a few points above 1595.3; conservative traders, however, may opt to wait for additional confirmation to form before pulling the trigger.
As for downside targets, traditional ABCD patterns usually favour the 38.2% and 61.8% Fibonacci retracements of legs A-D. Plotting this is only possible once the ABCD formation completes.
The accuracy, completeness and timeliness of the information contained on this site cannot be guaranteed. IC Markets does not warranty, guarantee or make any representations, or assume any liability regarding financial results based on the use of the information in the site.
News, views, opinions, recommendations and other information obtained from sources outside of www.icmarkets.com.au, used in this site are believed to be reliable, but we cannot guarantee their accuracy or completeness. All such information is subject to change at any time without notice. IC Markets assumes no responsibility for the content of any linked site.
The fact that such links may exist does not indicate approval or endorsement of any material contained on any linked site. IC Markets is not liable for any harm caused by the transmission, through accessing the services or information on this site, of a computer virus, or other computer code or programming device that might be used to access, delete, damage, disable, disrupt or otherwise impede in any manner, the operation of the site or of any user’s software, hardware, data or property.


