
Key risk events today:
RBA Monetary Policy Meeting Minutes.
(Previous analysis as well as outside sources – italics).
EUR/USD:
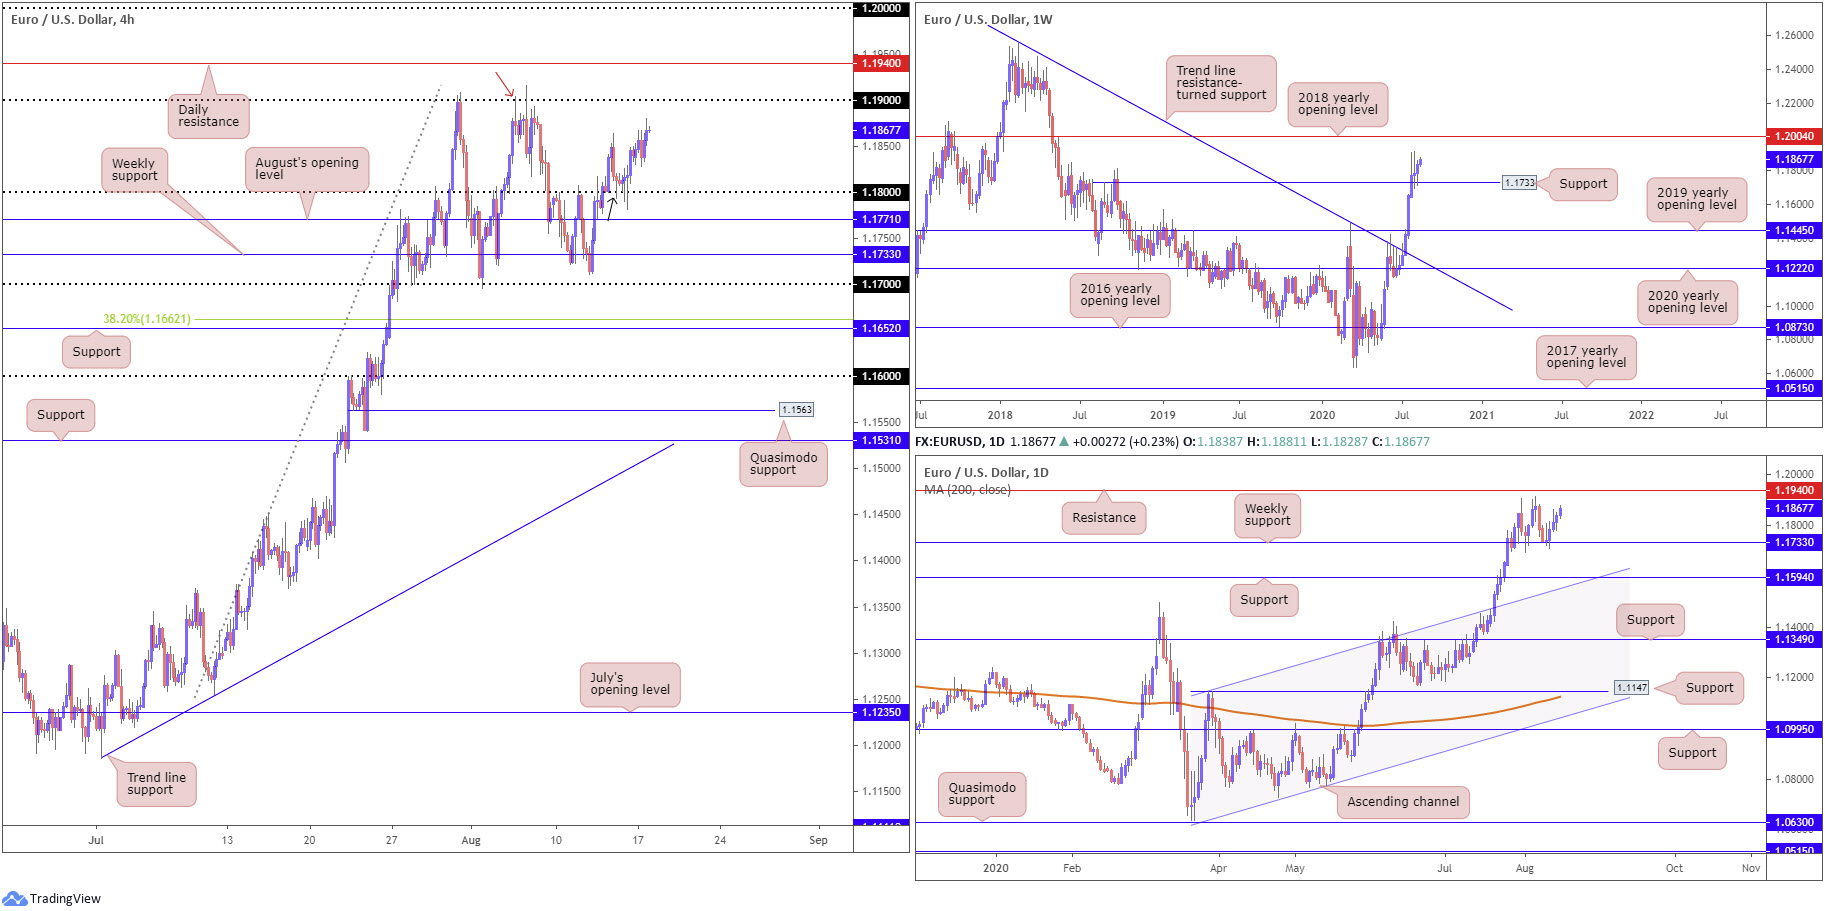
EUR/USD retained an underlying bid Monday, kicking off the week in reasonably strong fashion as the US dollar index snapped the 93.00 handle to the downside.
Following Friday’s 1.18 retest on the H4 timeframe, EUR/USD bulls extended recovery gains in recent trading, breaking last Thursday’s peak at 1.1864 and throwing the 1.19 handle in the pot as potential resistance (note Quasimodo resistance also lies at 1.1904 – red arrow), followed by daily resistance registered at 1.1940. Also worth highlighting is local Quasimodo support positioned around the 1.18 neighbourhood (1.1793 – black arrow).
Further afield, weekly price remains buoyed off support at 1.1733, a prior Quasimodo resistance level. Recent movement, alongside mid-July engulfing trend line resistance, taken from the high 1.2555, positions buyers in a healthy location, targeting the 2018 yearly opening level at 1.2004.
Since closing out July, EUR/USD entered into a phase of consolidation on the daily timeframe, braced by the current weekly support level and peaks around 1.1907. Resistance on the daily chart is parked at 1.1940, with a break largely exposing weekly resistance mentioned above at 1.2004 (2018 yearly opening level). Beyond 1.1733 (on the daily chart) could draw attention to daily support at 1.1594, a level connected closely with channel resistance-turned support, taken from the high 1.1147.
Areas of consideration:
Traders long from either 1.1733, the 1.18 breakout or the retest of 1.18 (all noted setups in previous reports) will likely be watching 1.19 as an initial target, followed by daily resistance at 1.1940 and then possibly weekly resistance at 1.2004 (and key figure 1.20 on the H4). Therefore, a break of 1.19 will likely be interpreted as a cue to seek bullish scenarios to at least daily resistance. Likewise, penetrating 1.1940 may also ignite bullish themes to weekly resistance.
GBP/USD:
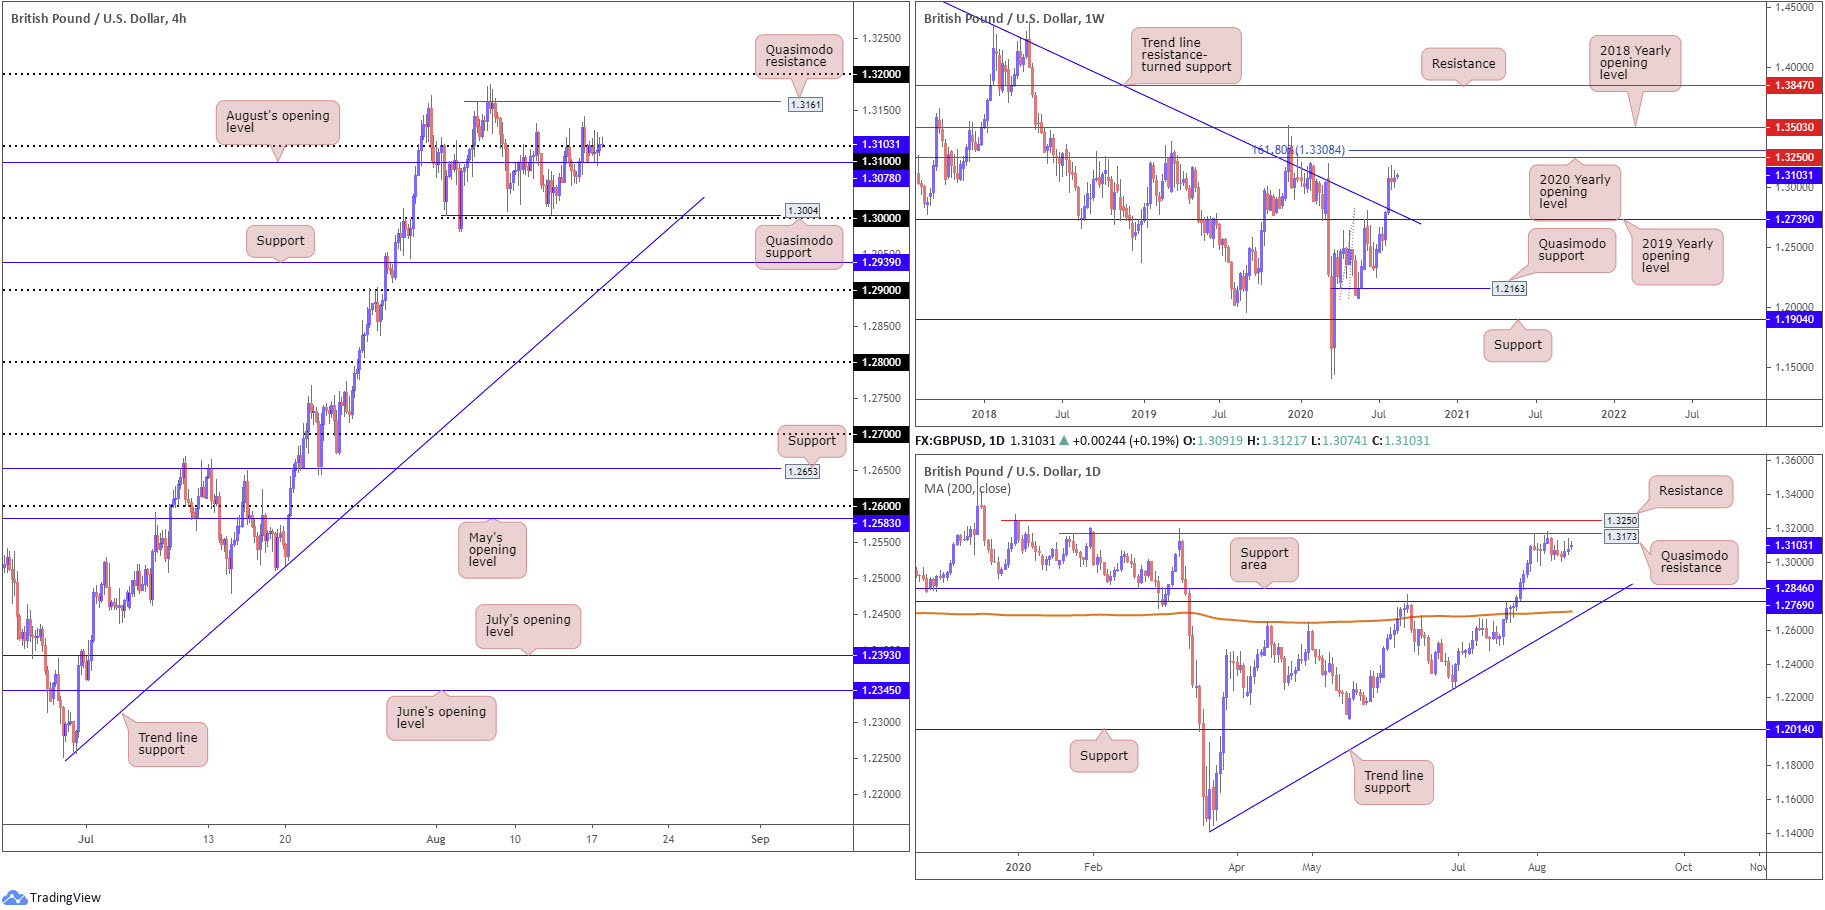
Overall, Monday offered a somewhat muted session, with price action narrowly confined between the 1.31 handle and August’s opening level at 1.3078 on the H4 timeframe. Quasimodo resistance at 1.3161 may call for attention in the event of a break above 1.31, whereas a dip sub 1.3078 shifts technical focus to the 1.30 key figure, a widely watched level that converges with Quasimodo support from 1.3004.
From the weekly timeframe, the July 27 trend line resistance (1.5930) break has likely stirred long-term bullish themes. Fresh resistance is seen by way of the 2020 yearly opening level at 1.3250, closely stalked by a 161.8% Fibonacci extension point at 1.3308. Leaving said resistances unchallenged and retreating south this week could call for a retest of the 2019 yearly opening level drawn from 1.2739 (dovetails closely with the recently broken trend line).
Quasimodo resistance at 1.3173 elbowed its way into the spotlight as July came to an end, and remains prominent structure on the daily timeframe. Interestingly, the level is located just south of 1.3250 resistance, a barrier sharing the same space with resistance on the weekly timeframe, the 2020 yearly opening level. An extension to the downside this week rolls a support area between 1.2769/1.2846 into focus, positioned ahead of the 200-day SMA (orange – 1.2710) and trend line support, taken from the low 1.1409.
Areas of consideration:
Outlook unchanged due to Monday’s lacklustre movement.
The weekly chart does not seem to be throwing up any red flags in terms of resistance until 1.3250, while daily activity pencils in clear resistance around 1.3173. This alone, may persuade bulls to extend upside north of 1.31, initially targeting H4 Quasimodo resistance at 1.3161.
However, before buyers step in, another potential scenario to consider is a retracement to the 1.30 region to collect fresh bids. A H4 bullish candlestick formed off the round number may be sufficient to encourage conservative buyers to pull the trigger.
AUD/USD:
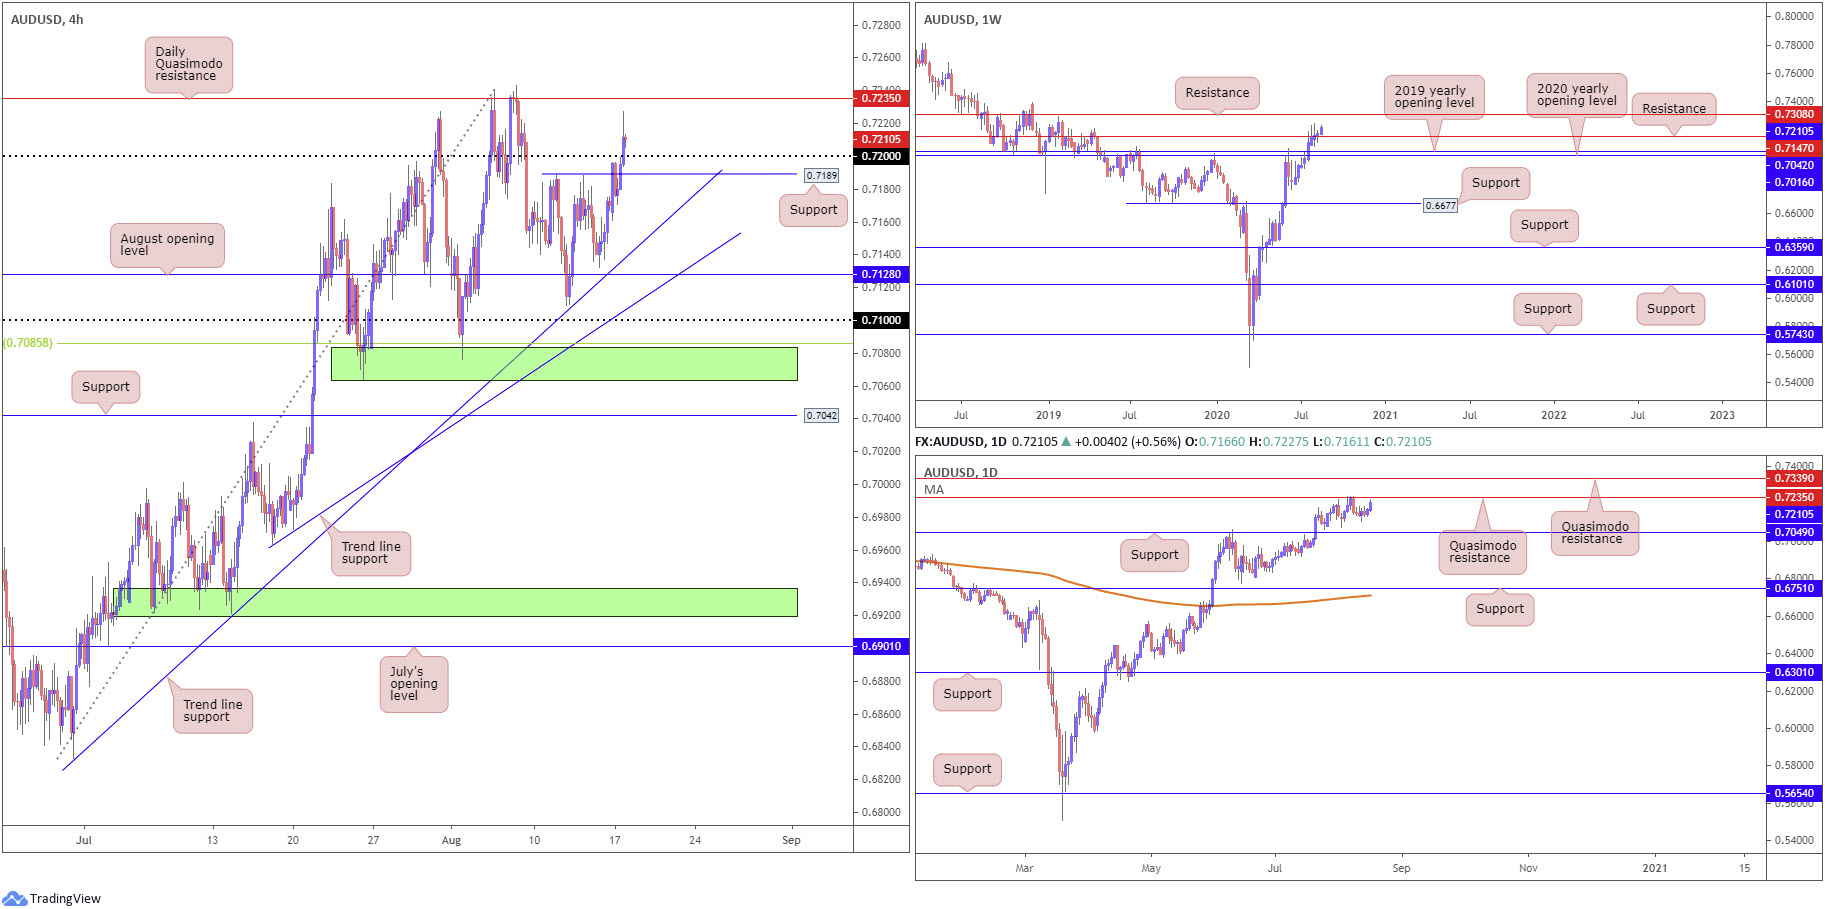
The Australian dollar outperformed Monday amidst a slump in US Treasury yields and a depreciating greenback. This witnessed H4 candles overwhelm offers residing around resistance at 0.7189 (now labelled support) and the 0.72 handle, a move that underlined daily resistance at 0.7235 as the next port of call. In terms of technical structure north of 0.7235 on the H4 timeframe, limited (obvious) resistance is seen until the 0.73 handle.
Price action, based on the weekly timeframe, appears to be finally making some headway above resistance at 0.7147, swerving moves to resistance at 0.7308 into the realm of possibility.
Technical structure on the daily timeframe, on the other hand, recently dropped Quasimodo resistance at 0.7235 in play, modestly capping upside since August 5. Support can be seen at 0.7049, while stepping above 0.7235, given the current trend facing north since March 19, emphasises the likelihood of perhaps crossing swords with Quasimodo resistance at 0.7339.
Areas of consideration:
Intraday buyers may already be long this market following yesterday’s 0.72 violation. Conservative players are likely to seek a retest at 0.72 before pulling the trigger. Regardless of the entry technique, daily Quasimodo resistance at 0.7235 rests as an initial upside target, with a break potentially unshackling things to the 0.73ish neighbourhood (the 0.73 handle on the H4 and weekly resistance at 0.7308).
As an aside, traders watching for a 1.32 retest are urged to pencil in the possibility of a fakeout through the round number (tripping sell-stop liquidity) to H4 support at 0.7189 before buyers make an appearance. A H4 close back above 0.72, off 0.7189, will, therefore, likely be considered a bullish signal.
USD/JPY:
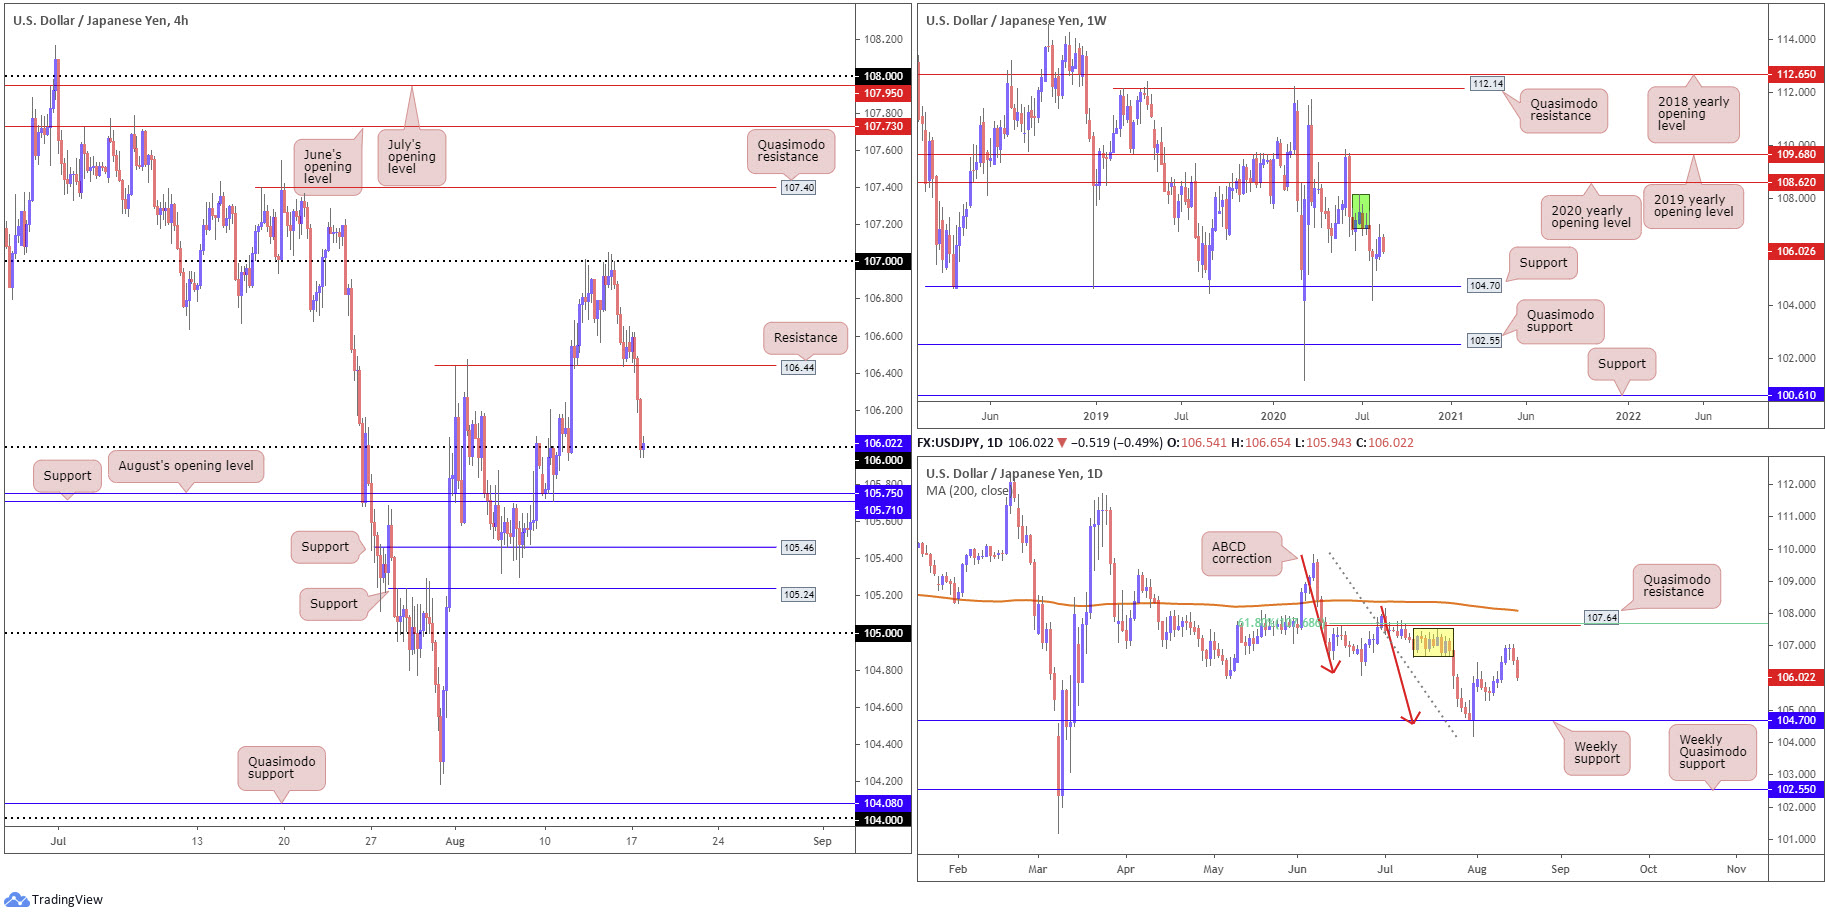
Amidst sliding US Treasury yields and the US dollar index softening through the 93.00 base, USD/JPY engulfed H4 support at 106.44 Monday (now a serving resistance) and shook hands with the 106 handle. Overrunning 106 today brings light to August’s opening level placed at 105.75, closely shadowed by H4 support at 105.71.
The story on the higher timeframes is interesting. Longer-term traders recently responded to the hammer pattern on the weekly timeframe, established off support at 104.70. Just as buyers appeared to be finding their stride, however, supply at 106.88-108.16 (green) is proving a tough nut to crack. Similarly, on the daily timeframe, supply at 107.54-106.67 (yellow), an area glued to the lower base of the aforementioned weekly supply, also made a show Friday. Downside targets on the daily timeframe can be seen at the 105.30 August 6 low, with a break exposing a possible revisit to weekly support at 104.70.
Areas of consideration:
There’s little evidence suggesting buyers will maintain 106 as support, both locally (on the H4) and on the higher timeframes. This implies an intraday bearish focus sub 106 today, targeting August’s opening level at 105.75/H4 support at 105.71, followed by a possible breach to H4 support at 105.46 (a prior Quasimodo resistance level). In order to take advantage of moves under 106, this may entail drilling down to the lower timeframes to secure reasonable risk/reward to 105.75 (at least 1:1 to be able to reduce risk to breakeven comfortably).
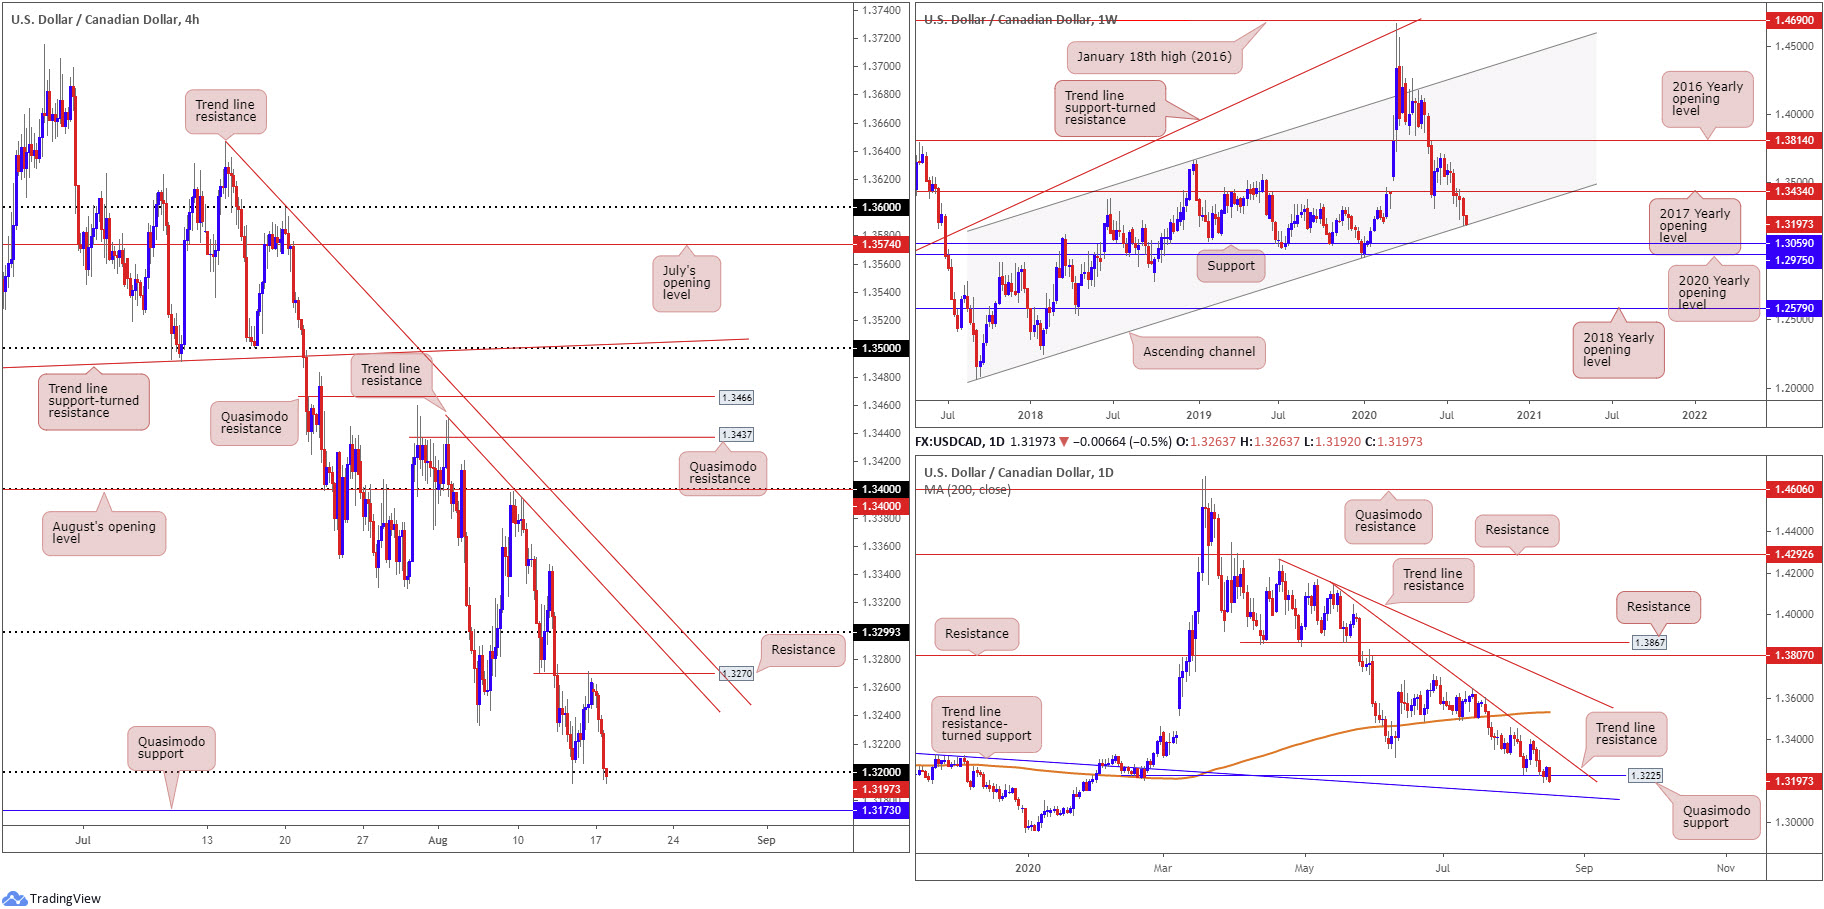
USD/CAD:
In the shape of a near-full-bodied daily bearish candle, USD/CAD reclaimed Friday’s gains in recent trading on the back of WTI nearing highs at $43.00 a barrel and the US dollar index forcing through 93.00 amid a slump in US Treasury yields.
Sellers strengthened their grip from levels just south of H4 resistance at 1.3270 Monday, dropping to test orders around 1.32, which, as you can see, appears fragile, at the time of writing. This could see the candles knock on the door of H4 Quasimodo support at 1.3173 today, extended from late January (2020).
While the immediate downtrend clearly remains in force, channel support, extended from the low 1.2061 on the weekly timeframe, recently arrived after forming a fifth consecutive weekly loss. A recovery from here swings the 2017 yearly opening level at 1.3434 back into view as viable resistance, whereas splitting the channel formation moves support at 1.3059 in sight as a possible downside target.
Quasimodo support at 1.3225 on the daily timeframe, a level dovetailing closely with weekly channel support, also made its way into the fight in the second half of last week. As things stand, buyers appear feeble, suggesting a continuation to visit trend line resistance-turned support, extended from the high 1.3344. Breaking here places weekly support at 1.3059 in the firing range.
Areas of consideration:
While sellers made a strong comeback Monday, buyers still have a hand in this fight thanks to weekly channel support. However, before buyers make a stand, H4 Quasimodo support at 1.3173 may emerge, as might trend line resistance-turned support on the daily timeframe around 1.3140ish, as of current price.
For that reason, intraday sellers seeking bearish strategies under 1.32 (despite in line with the current downtrend) may find weekly buyers halt downside attempts, therefore trade with caution.
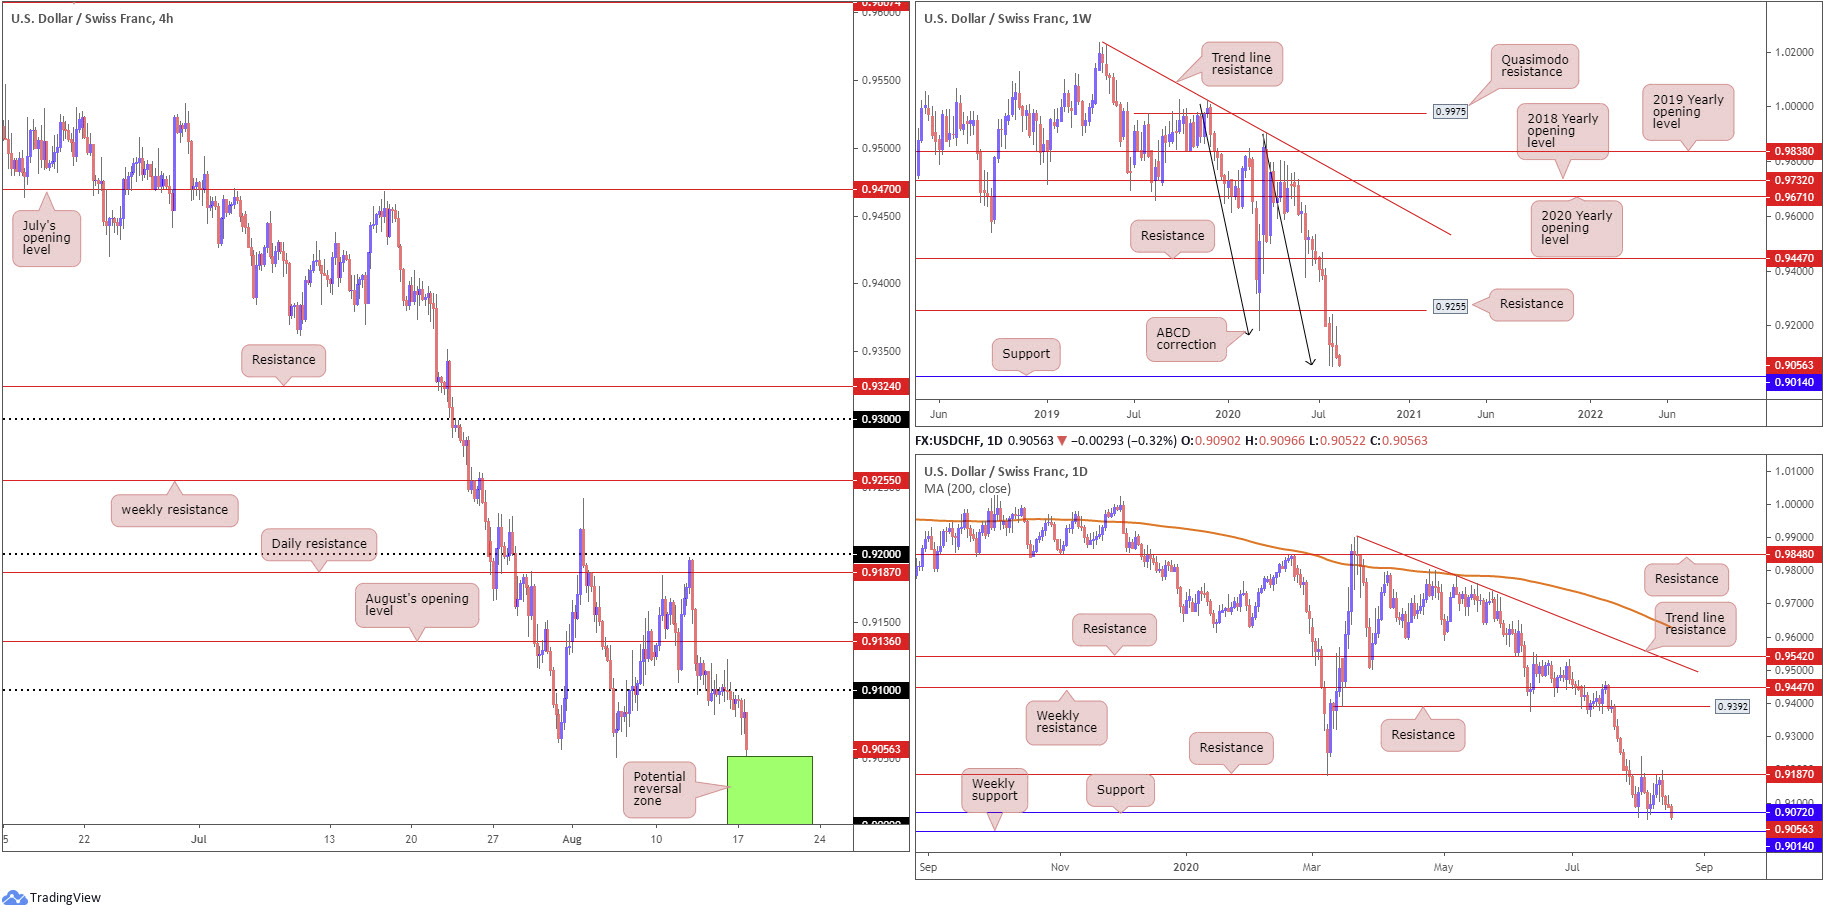
USD/CHF:
Pressured lower, in line with the US dollar index splitting the 93.00 handle, USD/CHF extended its retracement slide from daily resistance priced in at 0.9187 Monday, down 0.2%.
Leaving 0.91 unchallenged on the H4 timeframe and defeating daily support at 0.9072, the candles now trade within striking distance of an interesting area of support established between 0.90/0.9051 (green), formed by way of the 0.90 key figure on the H4 timeframe, weekly ABCD support at 0.9051 (black arrows) and weekly support coming in from 0.9014.
Areas of consideration:
Keeping things simple this morning, although sentiment remains to the downside, sellers are nearing incredibly potent support between 0.90/0.9051 (green – H4). While the area may not stimulate a major reversal, it is still a base that could prompt a recovery back to at least the 0.91 vicinity, enough to perhaps cause short-term sellers to cover positions.
For that reason, countertrend traders are likely to watch H4 price behaviour within 0.90/0.9051 closely today for signs of bullish intent, targeting 0.91 as an initial take-profit zone.
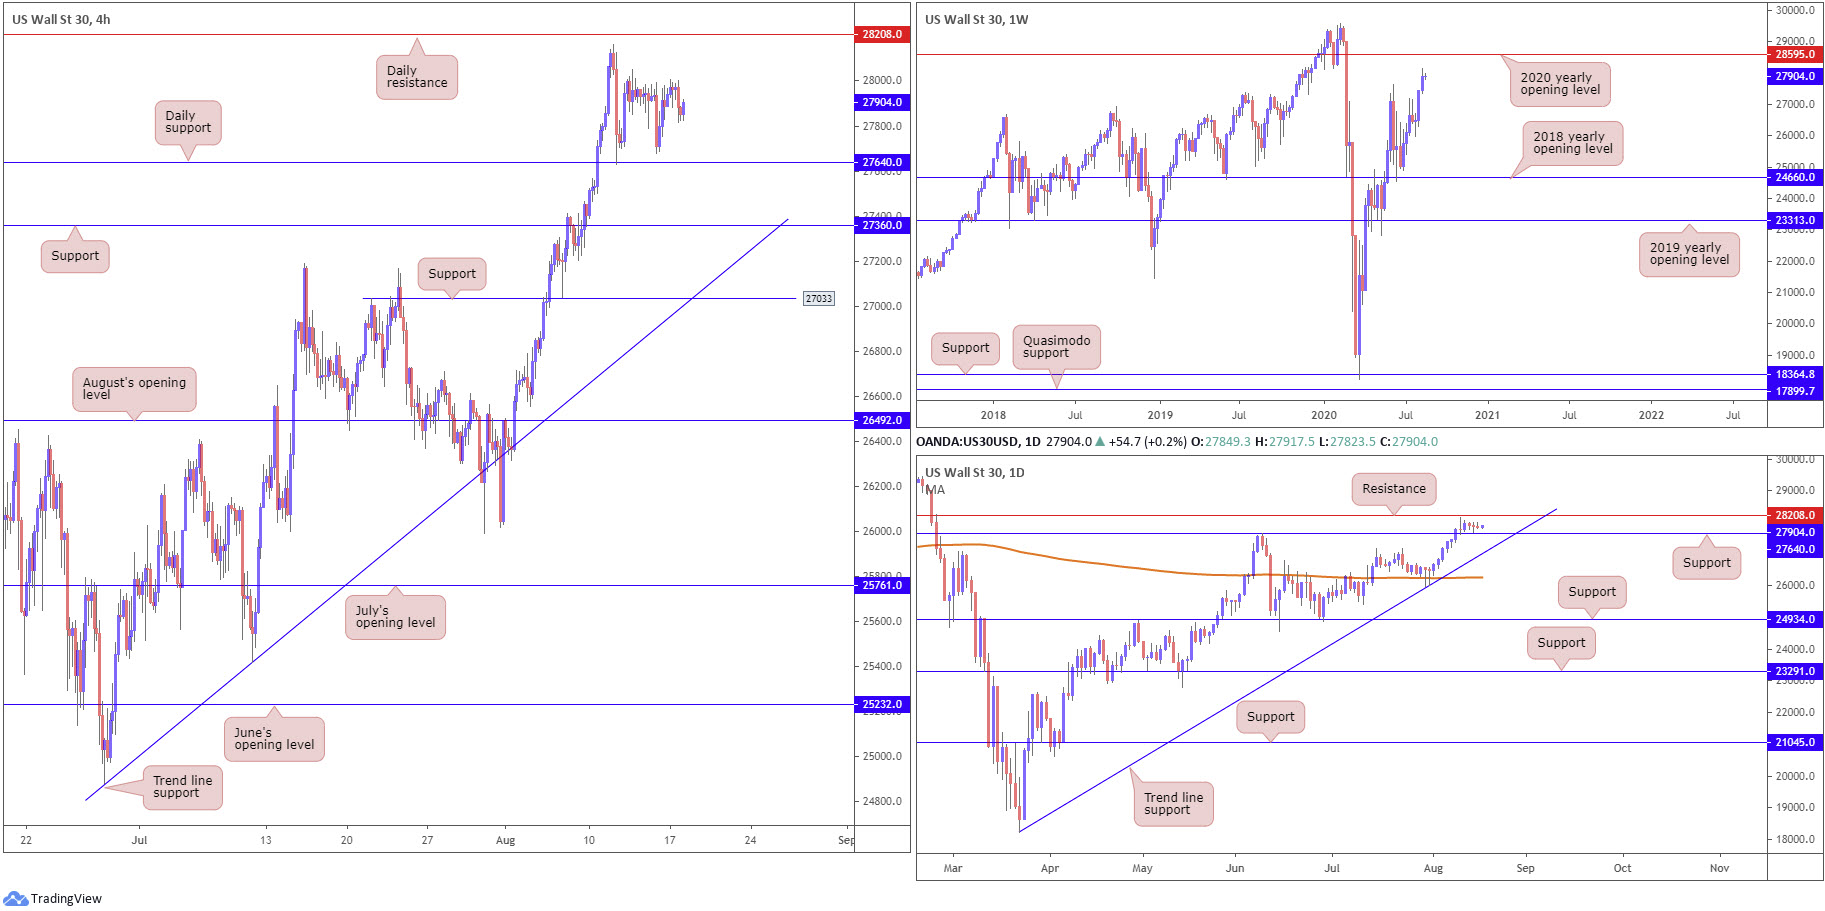
Dow Jones Industrial Average:
Major US equity benchmarks settled mostly higher Monday amid a rally in technology companies. The Dow Jones Industrial Average declined 86.11 points, or 0.31%; the S&P 500 rallied 9.14 points, or 0.27% and the tech-heavy Nasdaq 100 traded higher by 124.12 points, or 1.11%.
Taking into consideration that price movement was limited Monday, much of the following report will echo thoughts aired in Monday’s technical briefing.
From the weekly timeframe:
US equities traded strong last week, extending the prior week’s 3.5% advance and overthrowing the 27638 high. Although a 27638 retest could develop this week, the unit is poised to make a run for the 2020 yearly opening level at 28595.
Daily timeframe:
A closer examination of price action on the daily timeframe reveals resistance is seen at 28208, with support placed at 27640. Breaking resistance could have action make its way towards the 2020 yearly opening level on the weekly timeframe at 28595, while tunnelling through support has trend line support, extended from the low 18213, to contend with.
H4 timeframe:
Activity on the H4 timeframe established position off daily support at 27640 last Wednesday and closed a touch off session peaks. Candle action, as you can see, has remained pretty much stationary since then, albeit spiking to a low at 27678 Friday.
Areas of consideration:
An additional test of daily support at 27640 may form, perhaps drawing out dip-buying strategies. Failure to hold, nevertheless, brings light to H4 support at 27360.
Traders who managed to secure a long entry from daily support at 27640 (a noted move to watch for in recent reports) last Wednesday will likely have daily resistance at 28208 marked as a valid take-profit target, with a break, as highlighted above, likely pushing for weekly resistance at 28595, the 2020 yearly opening level.
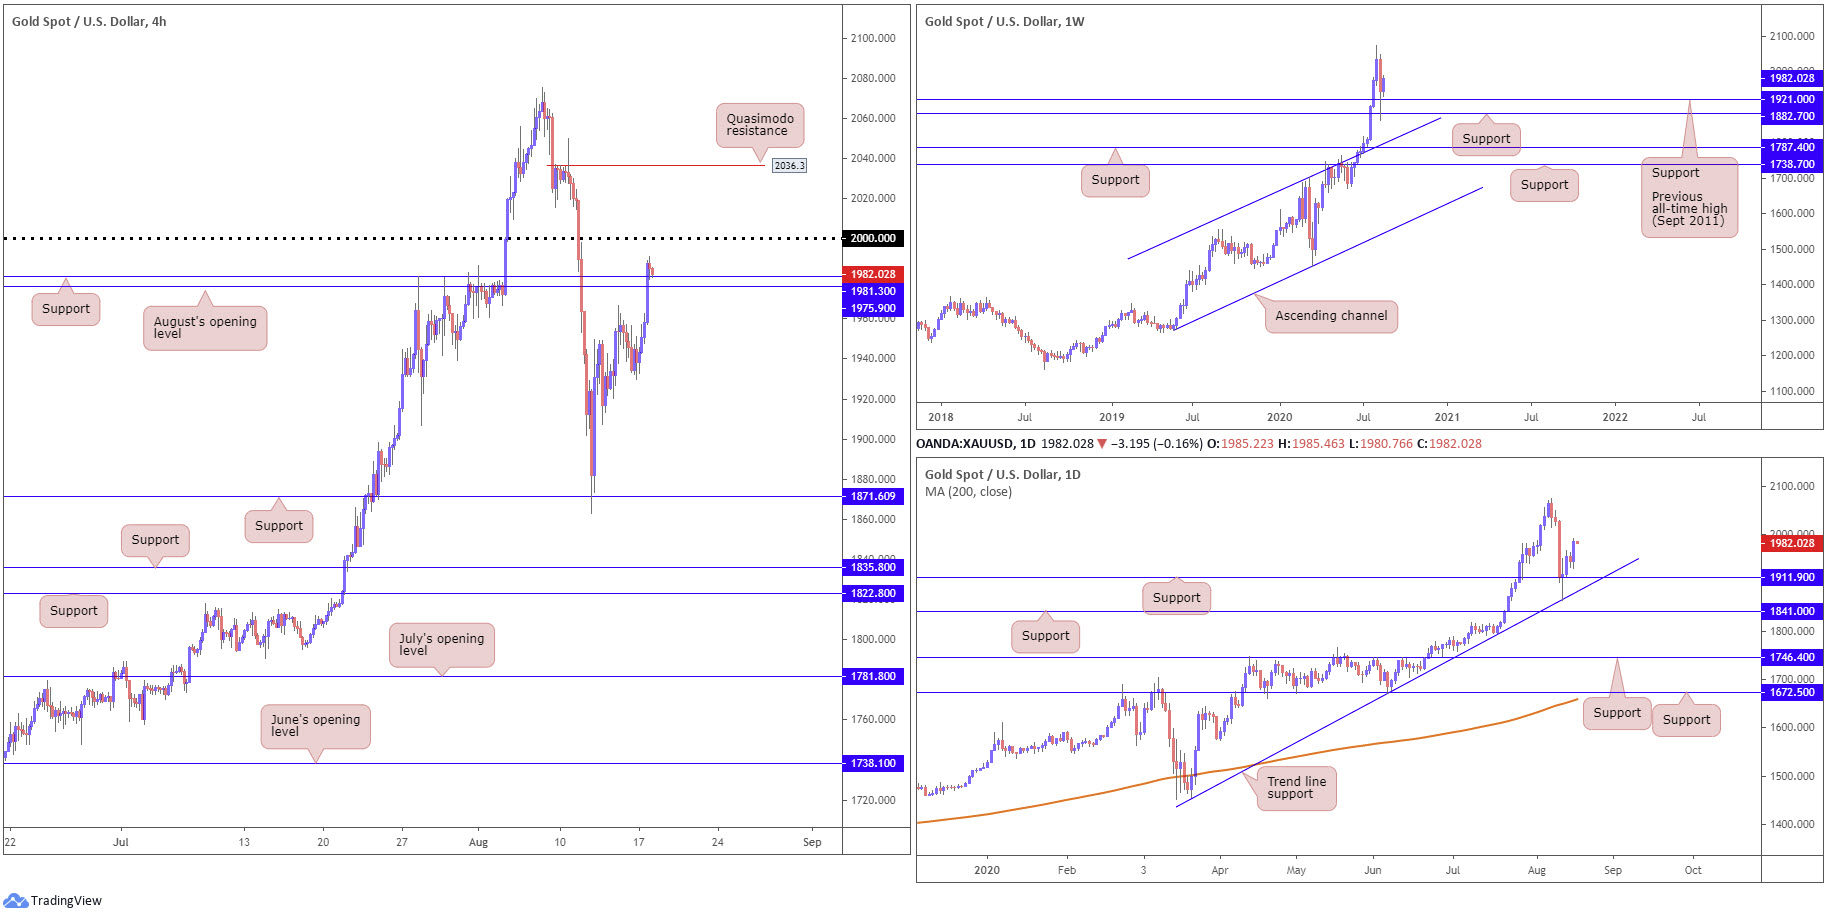
XAU/USD (GOLD):
Spot gold kicked off the week in fine form, rallying more than 2% against the buck. After delivering its largest weekly percentage fall since March last week, the rebound, technically speaking, is not a surprise.
Last week’s retreat found demand from $1,921.00, the previous all-time high (September 2011), as well as weekly support coming in at $1,882.70. Traders will also acknowledge daily price shook hands with trend line support last Wednesday, extended from the low $1,455.32, along with converging support from $1,911.90.
Recent buying observed H4 candles reclaim August’s opening level at $1,975.90, followed by resistance at $1,981.30 (both now representing supports), shining today’s spotlight on the key figure $2,000.00.
Areas of consideration:
According to chart studies, this remains a buyers’ market – even more so should we brush aside $2,000.00.
Most conservative buyers will want to see $2k consumed before committing, potentially setting the technical stage for an approach to at least H4 Quasimodo resistance at $2,036.30. A retest at $2k might also add conviction, particularly if the retest forms in the shape of a H4 bullish candlestick signal.
Other traders, however, those who feel upside pressure derived from higher timeframe supports is adequate to bolster further buying, may look to trade any retest off $1,975.90/$1,981.30 on the H4 today, in hope of a $2k break to the upside.
The accuracy, completeness and timeliness of the information contained on this site cannot be guaranteed. IC Markets does not warranty, guarantee or make any representations, or assume any liability regarding financial results based on the use of the information in the site.
News, views, opinions, recommendations and other information obtained from sources outside of www.icmarkets.com.au, used in this site are believed to be reliable, but we cannot guarantee their accuracy or completeness. All such information is subject to change at any time without notice. IC Markets assumes no responsibility for the content of any linked site.
The fact that such links may exist does not indicate approval or endorsement of any material contained on any linked site. IC Markets is not liable for any harm caused by the transmission, through accessing the services or information on this site, of a computer virus, or other computer code or programming device that might be used to access, delete, damage, disable, disrupt or otherwise impede in any manner, the operation of the site or of any user’s software, hardware, data or property.


