
DXY:
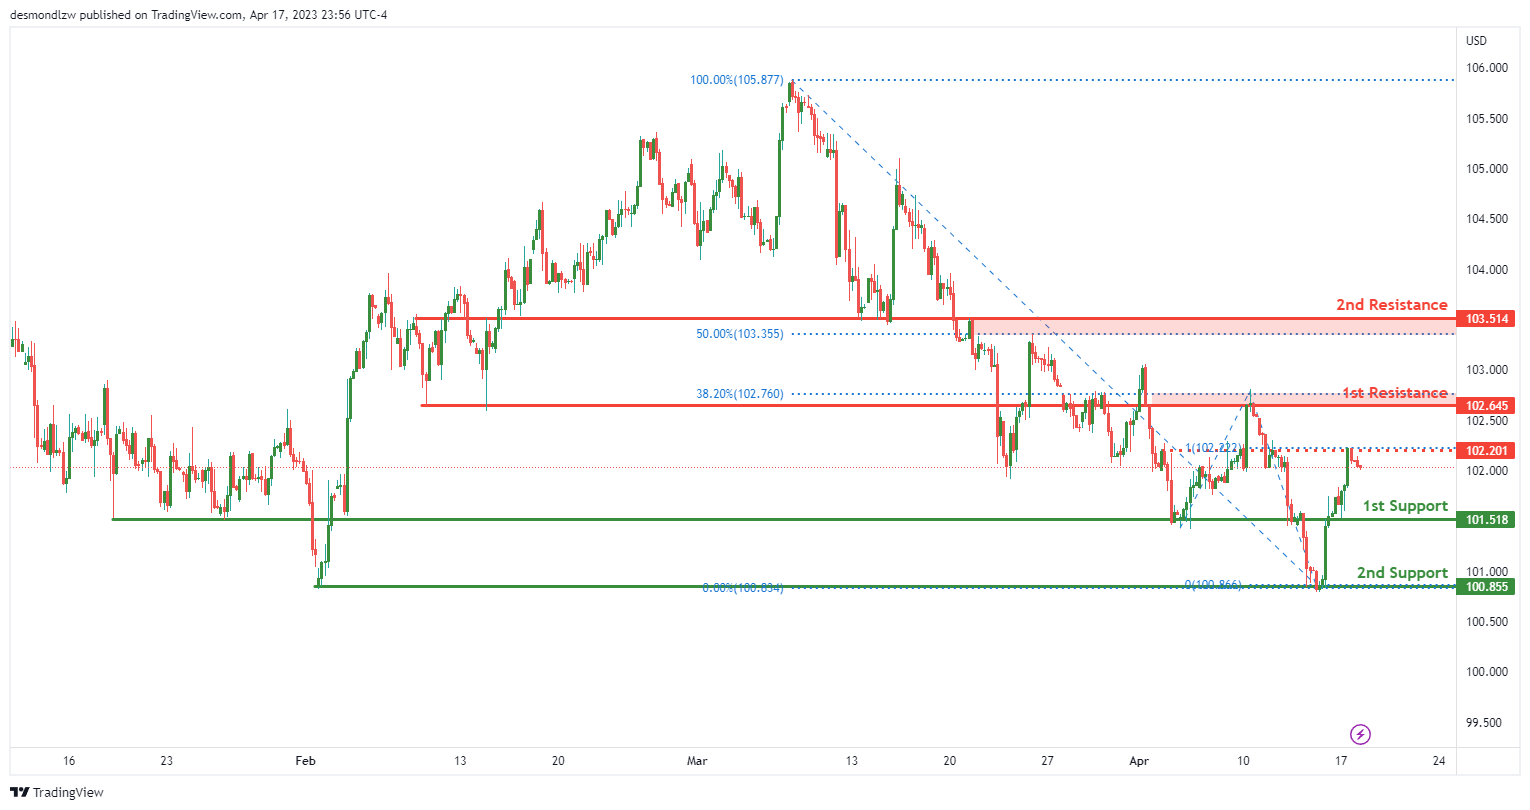
The DXY chart has a bearish momentum overall, with a potential short-term rise towards the 1st resistance before reversing and dropping towards the 1st support.
The 1st support level is at 101.51, which is an overlap support. This level has been tested multiple times in the past and has shown to provide strong support. The 2nd support level is at 100.85, which is a swing low support. This level has also been tested multiple times in the past and has shown to provide a strong support zone for price.
The 1st resistance level is at 102.64, which is an overlap resistance and coincides with a 38.20% Fibonacci retracement. This resistance level has also been tested multiple times in the past and has shown to provide strong resistance to price. There are also two intermediate resistance levels to watch out for. The first intermediate resistance level is at 103.51, which is an overlap resistance and coincides with a 50% Fibonacci retracement. The second intermediate resistance level is at 102.20, which is an overlap resistance.
It’s important to keep an eye on the support and resistance levels as they have been tested multiple times in the past and have shown to provide strong support and resistance zones for price.
EUR/USD:
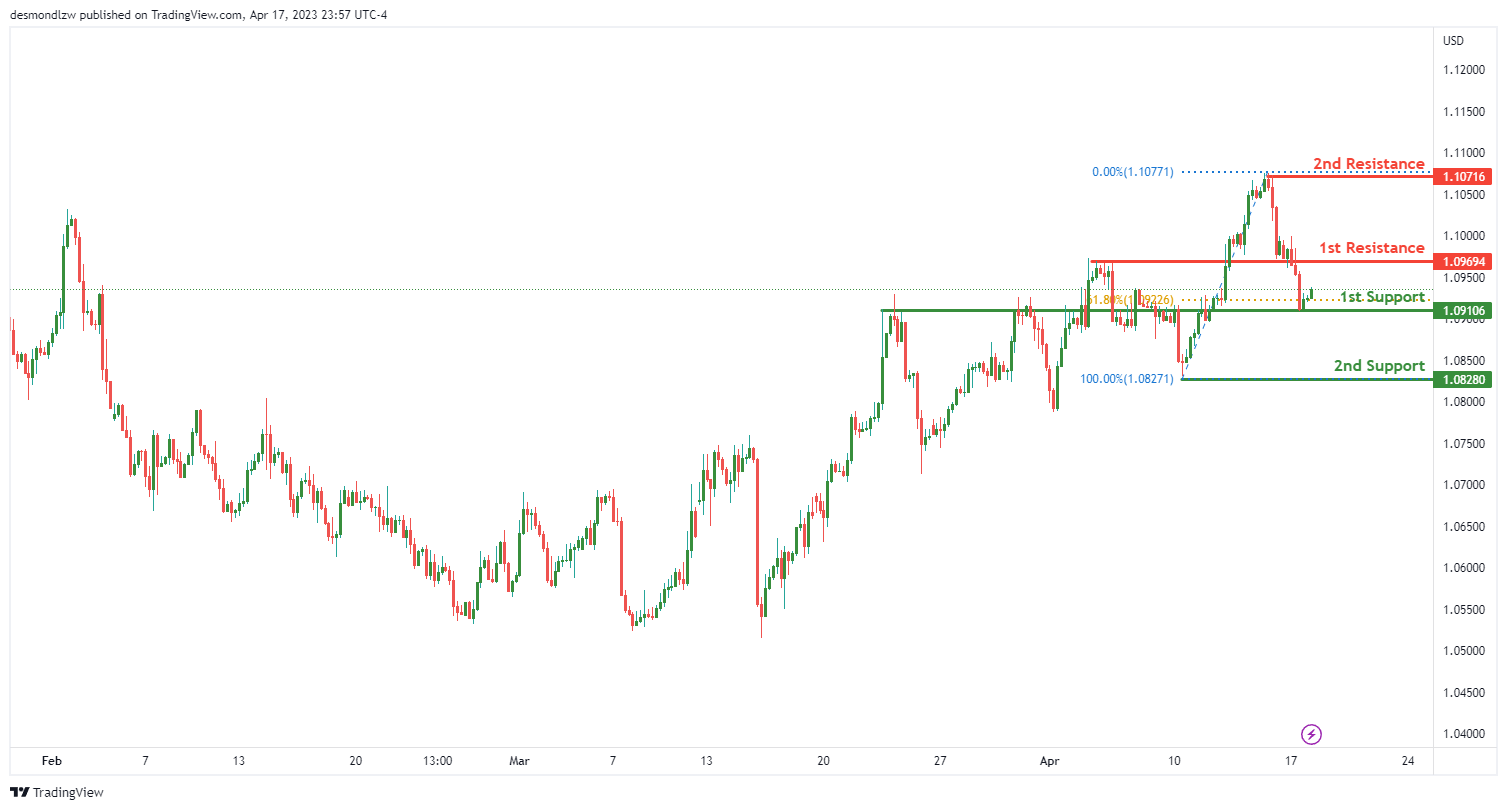
The EUR/USD chart has an overall bullish momentum. There is a potential for a bullish continuation towards the 1st resistance.
The 1st support level is at 1.0910, which is a swing low support and coincides with a 61.80% Fibonacci retracement. This level has shown to provide strong support for price in the past.
The 2nd support level is at 1.0828, which is also a swing low support. This level has also been tested multiple times in the past and has shown to provide a strong support zone for price.
The 1st resistance level is at 1.0969, which is a pullback resistance. This level has shown to provide strong resistance to price in the past.
There is also the 2nd resistance level at 1.1071, which is a multi-swing high resistance. This level has been tested multiple times in the past and has shown to provide a strong resistance zone for price.
GBP/USD:
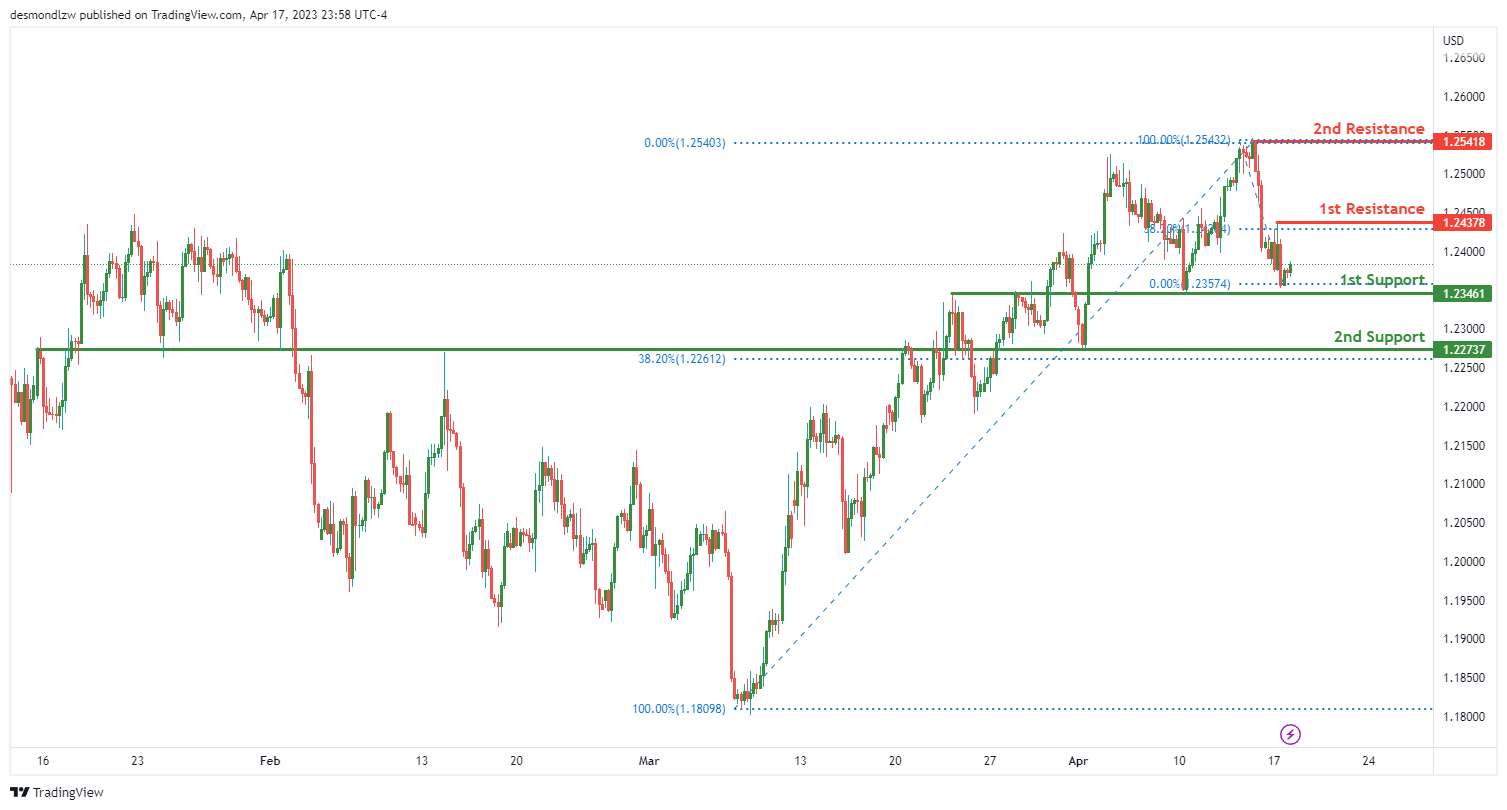
The GBP/USD chart has an overall bullish momentum, with a potential for a bullish continuation towards the 1st resistance.
The 1st support level is at 1.2346, which is an overlap support. This level has been tested multiple times in the past and has shown to provide strong support for price.
The 2nd support level is at 1.2273, which is also an overlap support and coincides with a 38.20% Fibonacci retracement. This level has also been tested multiple times in the past and has shown to provide a strong support zone for price.
The 1st resistance level is at 1.2437, which is a swing high resistance. This level has shown to provide strong resistance to price in the past.
There is also a 2nd resistance level at 1.2541, which is a multi-swing high resistance. This level has been tested multiple times in the past and has shown to provide a strong resistance zone for price.
USD/CHF:
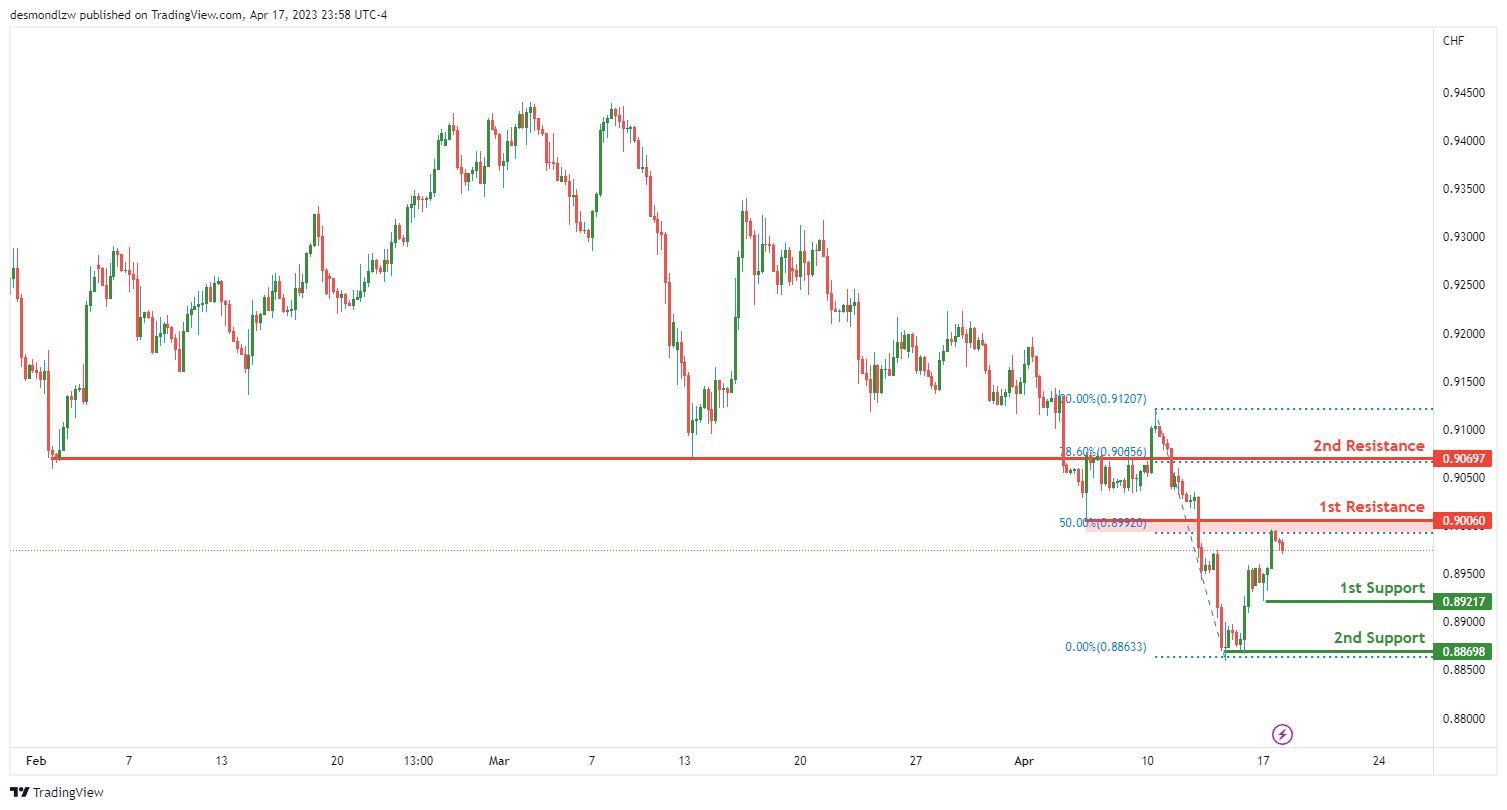
The USD/CHF chart has an overall bearish momentum, with a potential for a bearish continuation towards the 1st support.
The 1st support level is at 0.8921, which is a swing low support. This level has been tested multiple times in the past and has shown to provide strong support for price.
The 2nd support level is at 0.8869, which is a multi-swing low support. This level has also been tested multiple times in the past and has shown to provide a strong support zone for price.
The 1st resistance level is at 0.9006, which is a pullback resistance and coincides with a 50% Fibonacci retracement. This level has shown to provide strong resistance to price in the past.
There is also a 2nd resistance level at 0.9069, which is a pullback resistance and coincides with a 38.20% Fibonacci retracement. This level has also shown to provide strong resistance to price in the past.
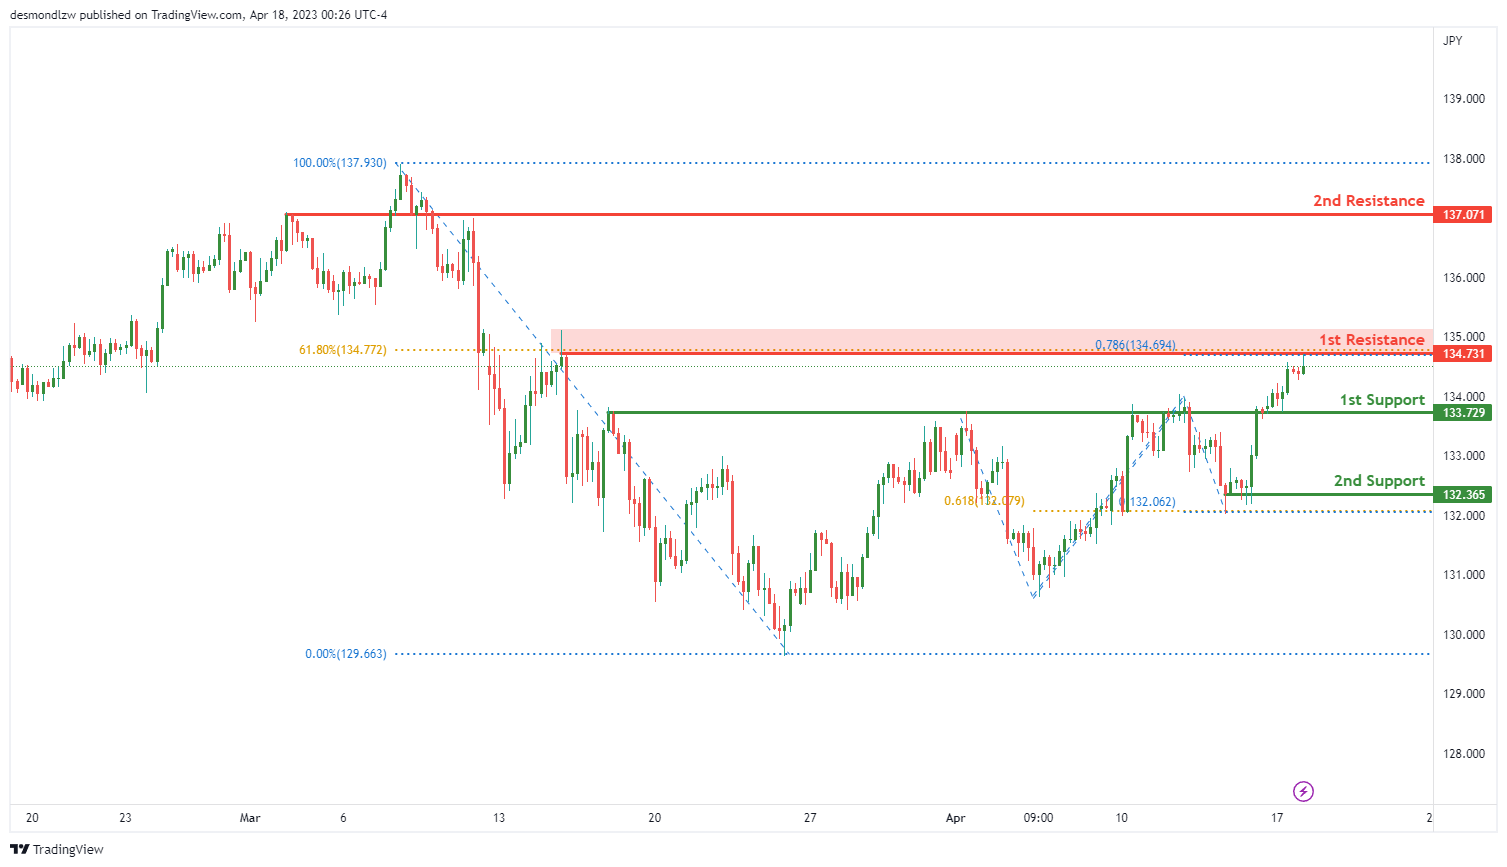
USD/JPY:
The USD/JPY chart has an overall bearish momentum, with a potential for a bearish reaction off the 1st resistance and drop to the 1st support.
The 1st support level is at 133.720, which is an overlap support and coincides with a 78.60% Fibonacci projection. This level has shown to provide strong support to price in the past.
The 2nd support level is at 132.360, which is a multi-swing low support and coincides with a 61.80% Fibonacci projection. This level has also shown to provide a strong support zone for price in the past.
The 1st resistance level is at 134.730, which is a swing high resistance and coincides with a 61.80% Fibonacci retracement. This level has shown to provide strong resistance to price in the past.
There is also a 2nd resistance level at 137.070, which is an overlap resistance. This level has been tested multiple times in the past and has shown to provide a strong resistance zone for price.
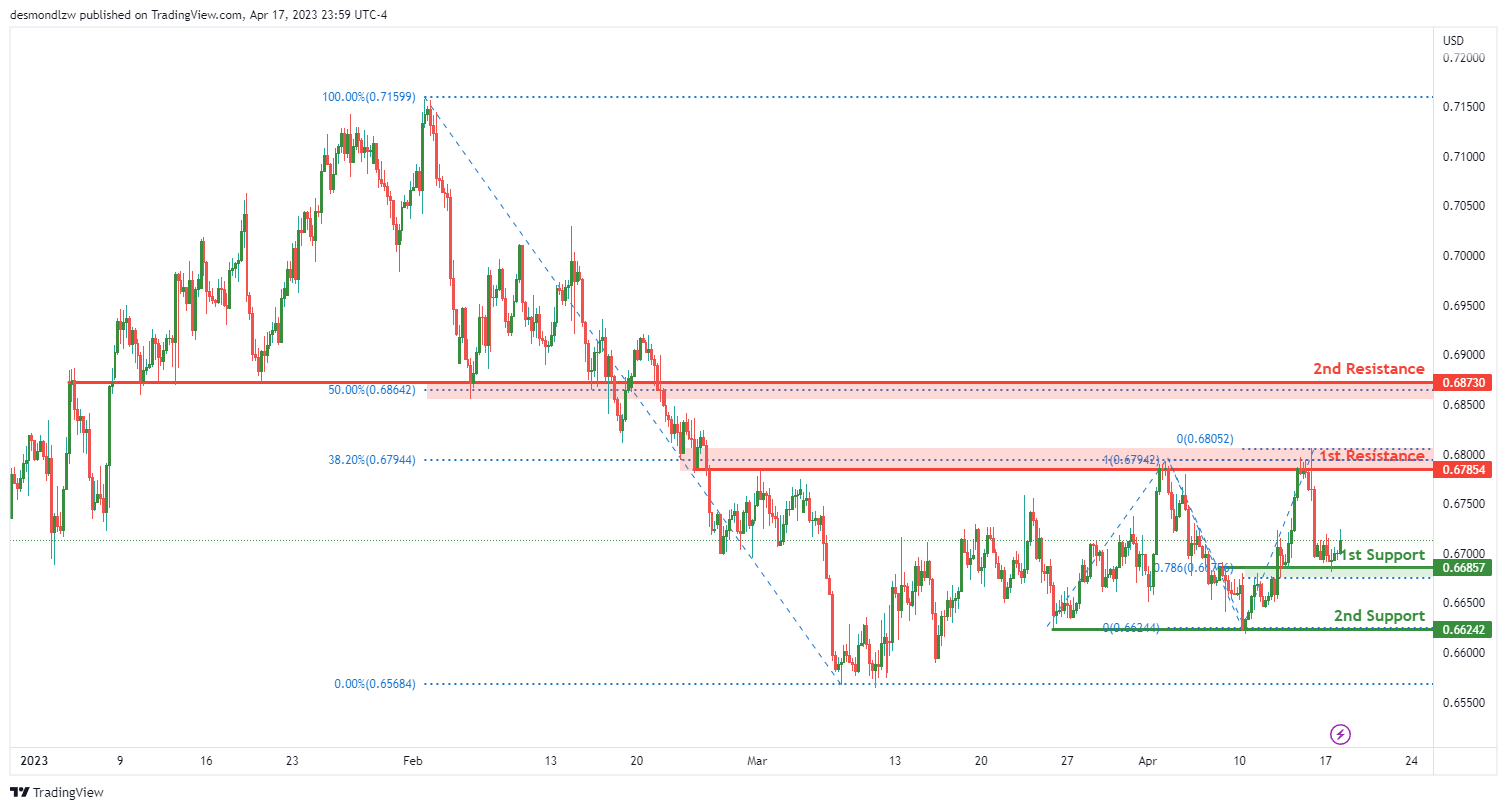
AUD/USD:
The AUD/USD chart has an overall bullish momentum, with potential for a bullish continuation towards the 1st resistance level at 0.6785. The price is currently trading above the Ichimoku cloud, which is a positive sign indicating bullish momentum.
The first support level is at 0.6685, which is an overlap support level and coincides with a 78.60% Fibonacci projection. This level has held as support in the past and could potentially provide a bounce for the price.
If the price were to bounce from the first support level, it could rise towards the first resistance level at 0.6785. This level is a pullback resistance level and coincides with a 38.20% Fibonacci retracement, adding to its strength as a resistance level.
Further up, there is a second resistance level at 0.6873, which coincides with a 50% Fibonacci retracement and is also a pullback resistance level. If the price were to break through the first resistance level, it could potentially rise towards this level.
However, if the price were to break below the first support level at 0.6685, the next level it could drop to is the second support level at 0.6624. This level is a multi-swing low support level and could potentially provide a bounce for the price.
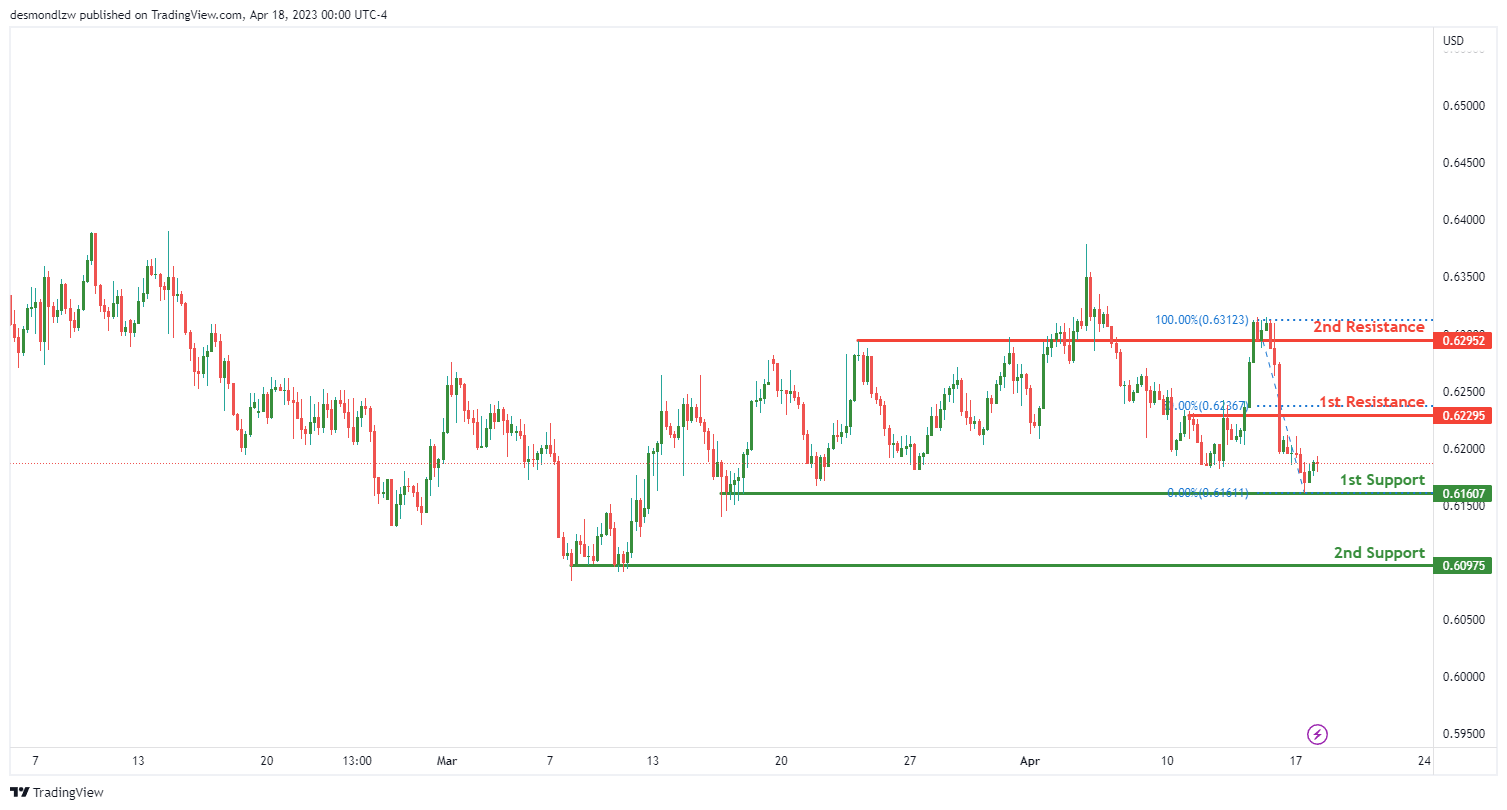
NZD/USD:
The NZD/USD chart is showing strong bullish momentum with potential for a continuation towards the 1st resistance. Price is currently trading above both the Ichimoku cloud and an ascending support line, indicating a bullish bias.
The 1st support level is at 0.6160 and is a multi-swing low support level. The 2nd support level is at 0.6097 and is also a multi-swing low support level. These levels could provide a buying opportunity for traders looking to take advantage of the bullish momentum.
On the resistance side, the 1st resistance is at 0.6229 which coincides with a 50% Fibonacci retracement level and a pullback resistance. A break above this level could potentially trigger a strong bullish acceleration towards our 2nd resistance at 0.6295, which is an overlap resistance level.
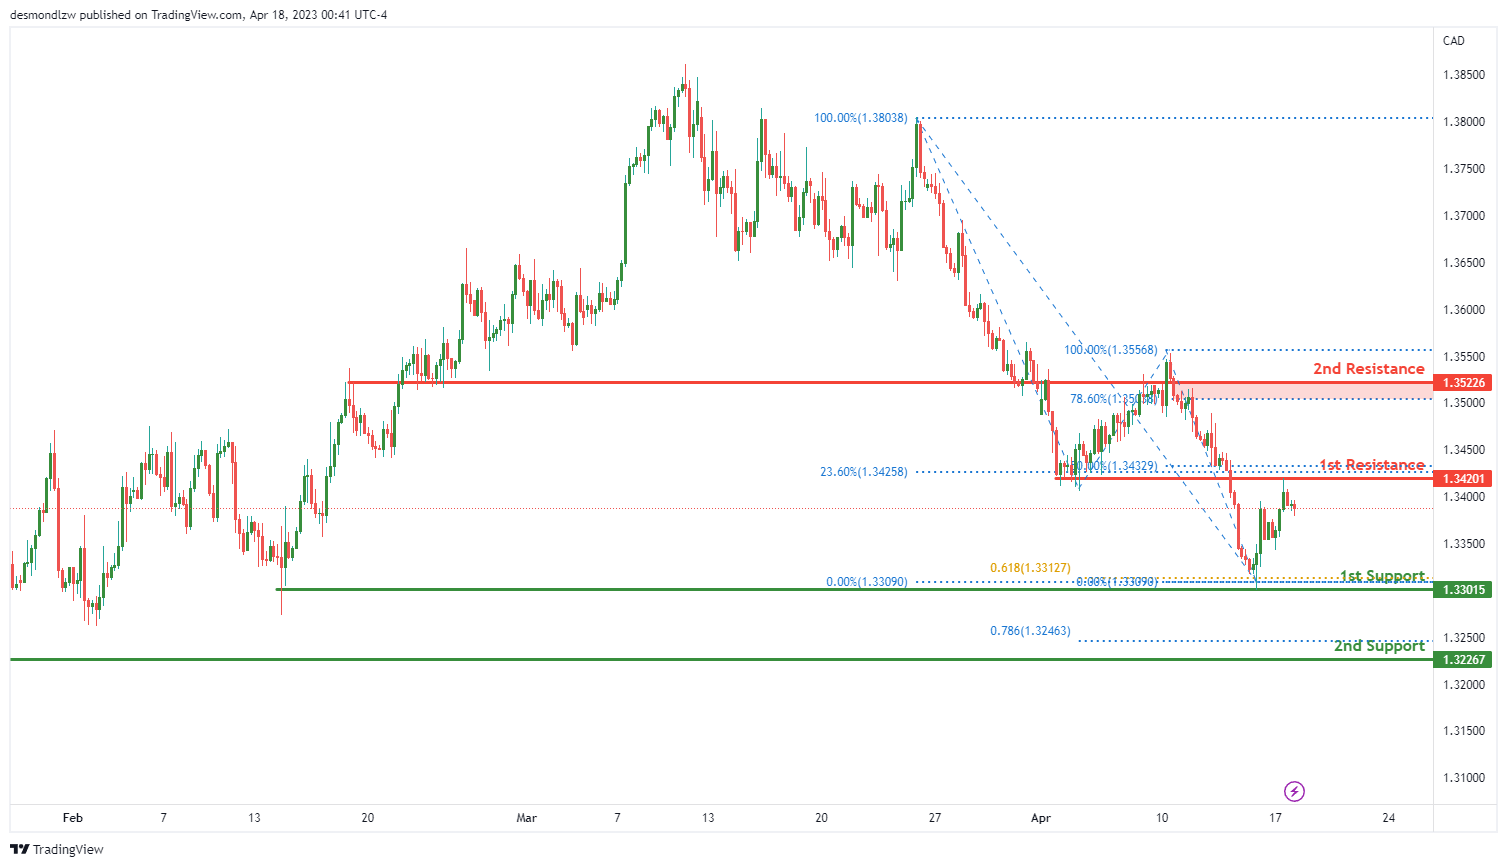
USD/CAD:
The USD/CAD pair has been seeing a bearish momentum overall, with price potentially making a bearish continuation towards the 1st support level.
Currently, the pair is trading below the Ichimoku cloud, which suggests bearish momentum. In addition, there is a descending trendline in play, which also suggests possible further bearish momentum.
Looking at the support and resistance levels, we can see that the 1st support level is at 1.3301, which is a multi-swing low support level and coincides with a 61.80% Fibonacci projection. If price were to break below this support level, the next level it could drop to is the 2nd support level at 1.3226, which is a swing low support.
On the other hand, the 1st resistance level is at 1.3420, which is an overlap resistance and coincides with a 23.60% Fibonacci retracement. If price were to rise towards this resistance level, it could potentially reverse off it and drop towards the 1st support level. The 2nd resistance level is at 1.3522, which is also an overlap resistance and coincides with a 78.60% Fibonacci retracement.
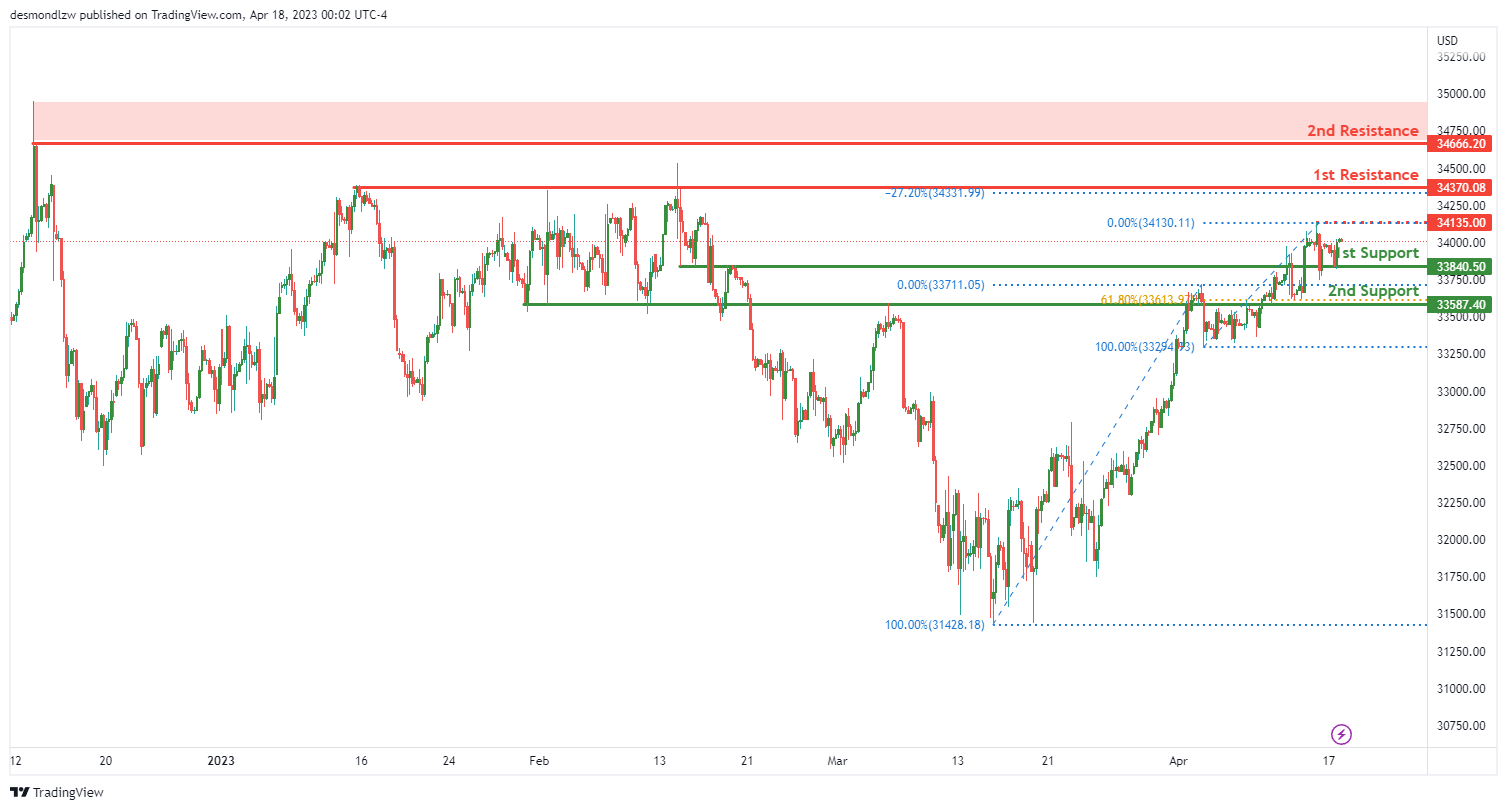
DJ30:
The DJ30 index appears to be showing strong bullish momentum, with potential for a continuation towards the first resistance level at 34370.08. Currently, price is sitting above both the first support level at 33840.50 and the second support level at 33587.40, both of which are overlap supports. The second support level also coincides with a 61.80% Fibonacci retracement, providing additional strength.
The first resistance level at 34370.08 is a multi-swing high resistance and is further strengthened by a -27% Fibonacci expansion. If price were to continue upwards, it could potentially encounter an intermediate resistance level at 34135.00, which is also a swing high resistance.
Should price break through the first resistance level, the next resistance level to watch out for is at 34666.20, a significant swing high resistance. However, if price were to drop below the first support level, it could potentially move towards the second support level at 33587.40.
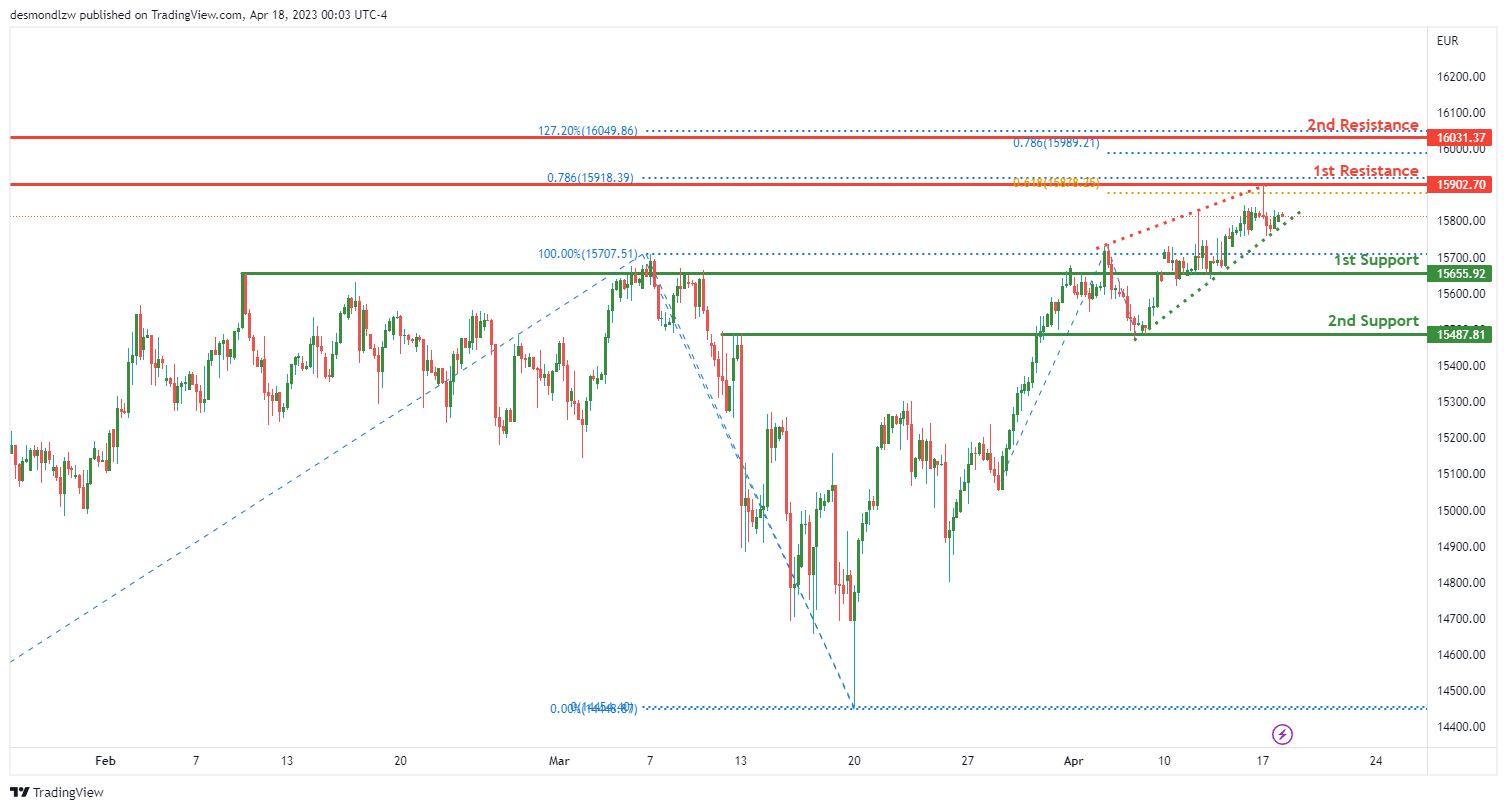
GER30:
The GER30 chart is currently showing bearish momentum due to the rising wedge pattern which is a bearish chart pattern that signals an imminent breakout to the downside. However, in the short term, price could potentially rise towards the 1st resistance before reversing off it and dropping towards the 1st support.
The 1st support is located at 15655.92, which is an overlap support level. This support is considered strong and could potentially hold price up. If price were to break below this level, it could drop towards the 2nd support at 15487.81, which is another overlap support level.
On the other hand, the 1st resistance is located at 15902.70, which is a swing high resistance level. This level lines up with the 61.80% Fibonacci projection and is considered strong. If price were to rise towards this level, it could reverse off it and drop towards the 1st support. The 2nd resistance is located at 16031.37, which is a swing high resistance level that lines up with the 78.60% Fibonacci projection.
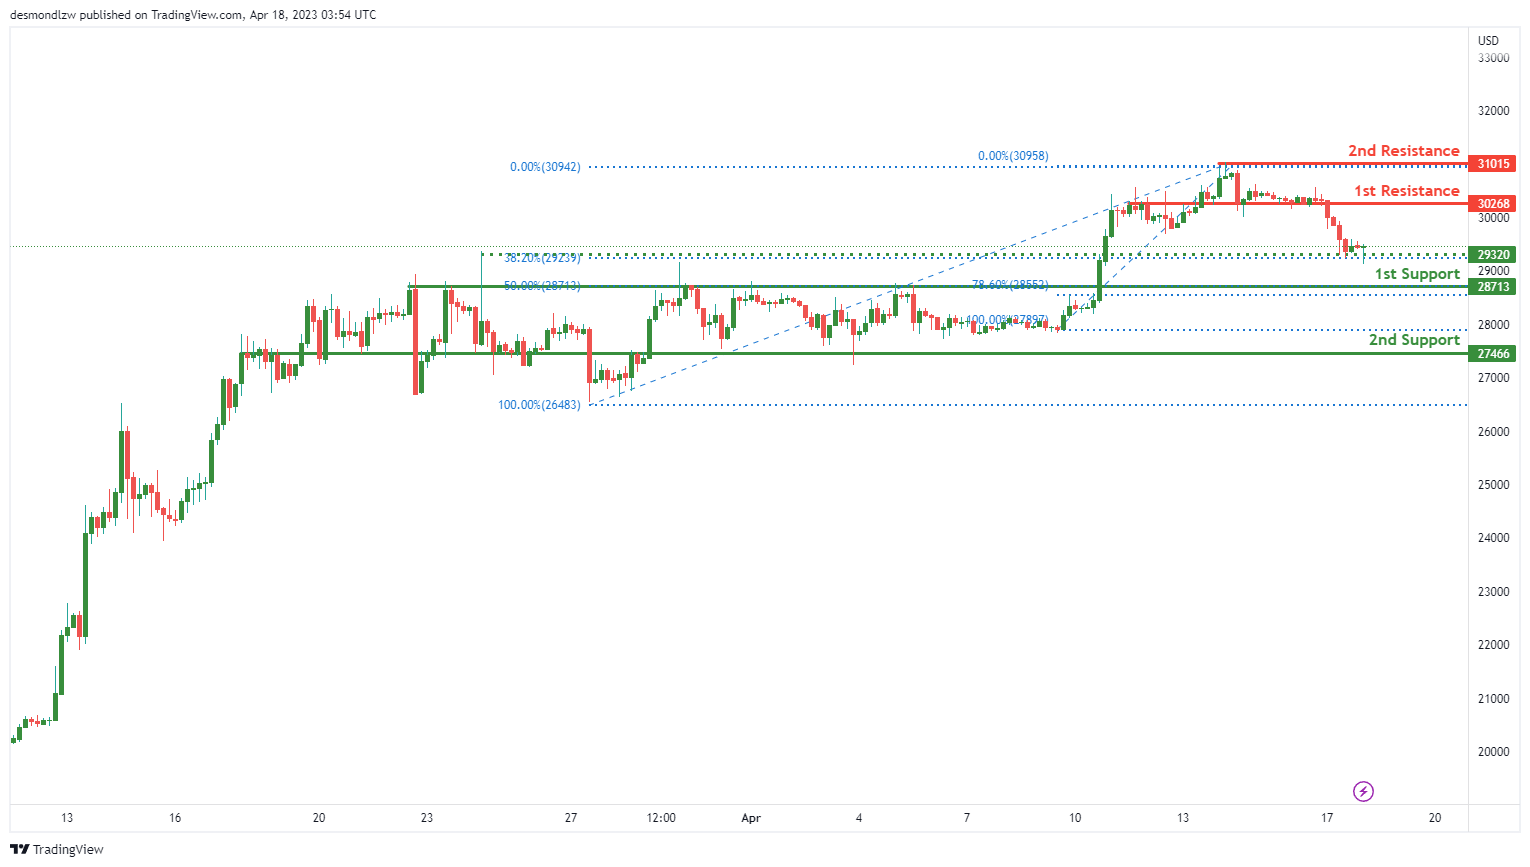
BTC/USD:
The overall momentum of the BTC/USD chart is currently bearish. Price has the potential to continue its bearish momentum towards the first support level at 28713, which is a pullback support level and coincides with the 78.60% Fibonacci retracement. If price were to break below this level, the next support level it could drop to is the second support level at 27466, which is also an overlap support level.
On the other hand, if price were to bounce from the first support level, it could potentially rise towards the first resistance level at 30268. This level is a pullback resistance level, and if price breaks above it, it could potentially rise towards the second resistance level at 31015, which is a swing high resistance level.
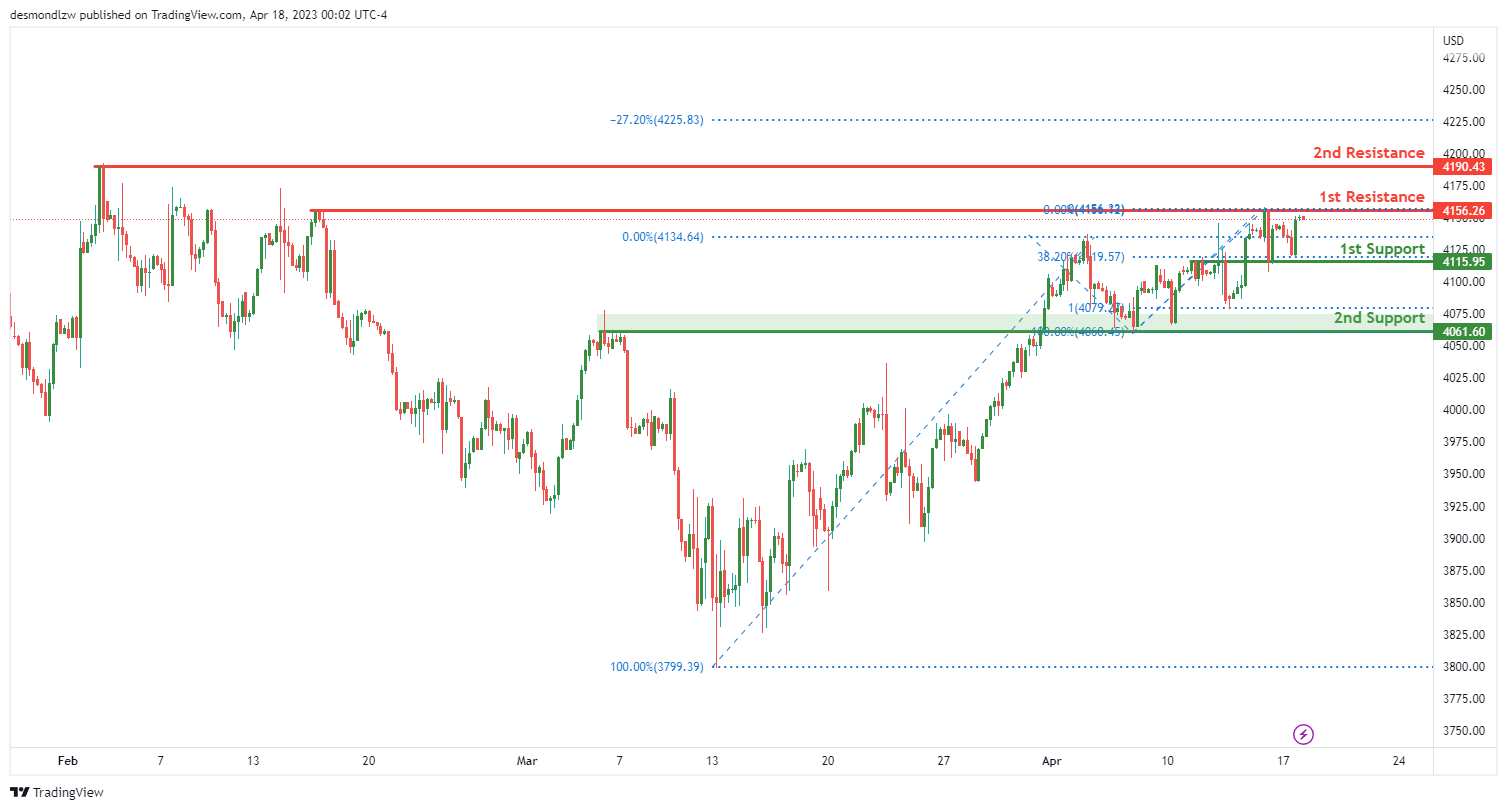
US500
The overall momentum of the US500 chart is bearish. The price could potentially make a bearish reaction off the 1st resistance and drop to the 1st support. The 1st support at 4155.95 is a good level as it is an overlap support and a 38.20% Fibonacci retracement level. If the price breaks below this support level, the 2nd support at 4061.60 could provide another good buying opportunity, as it is also an overlap support and a 100% Fibonacci projection level.
On the other hand, if the price manages to break above the 1st resistance at 4156.95, it could signal a shift in momentum and indicate a potential bullish move. However, the 2nd resistance at 4190.43 is also a strong level of swing high resistance, which may provide a challenge for the price to break through.
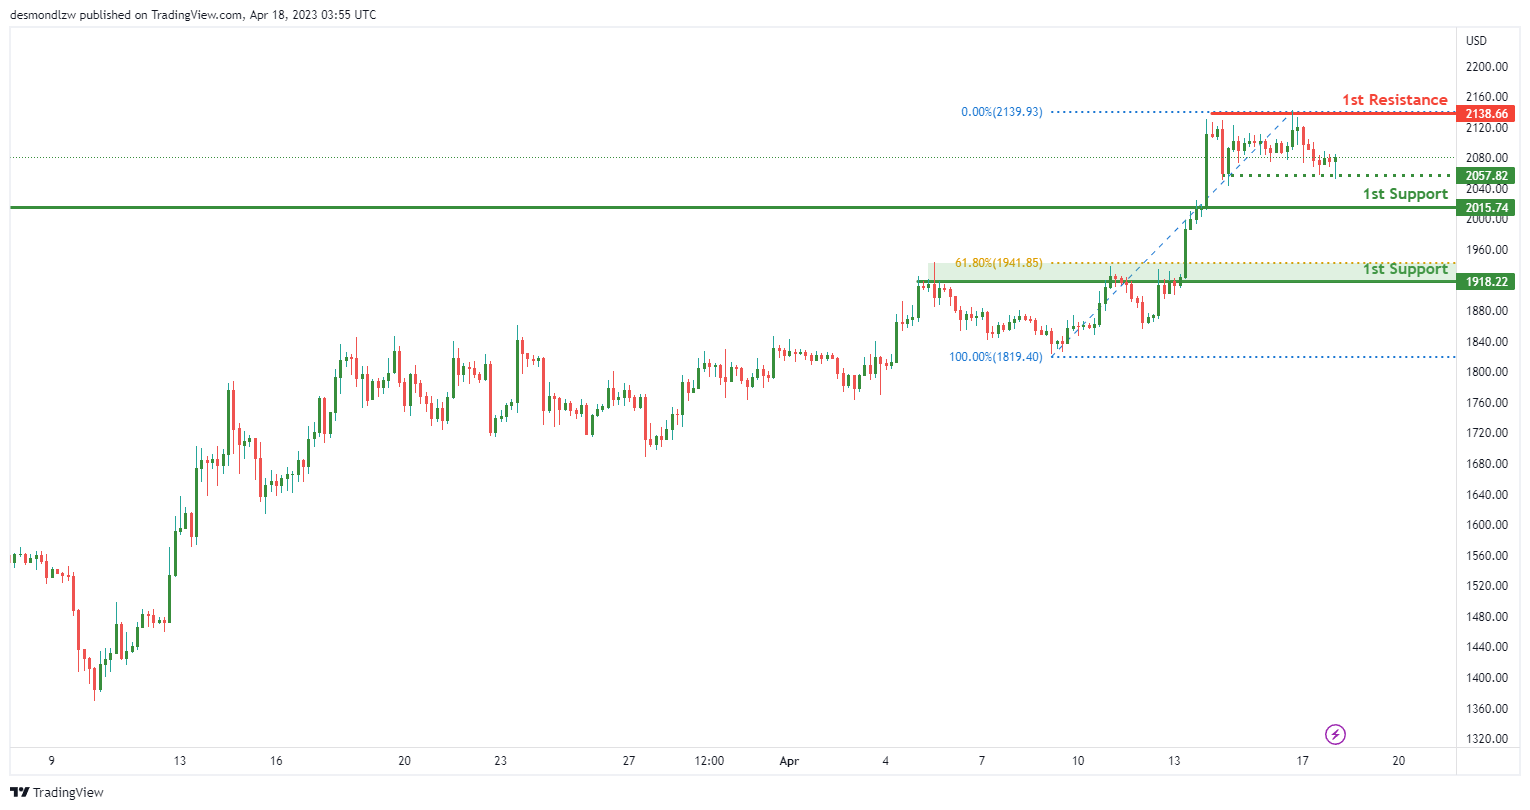
ETH/USD:
The overall momentum of the ETH/USD chart is bearish. The price could potentially continue to move bearishly towards the 1st support at 2015.74, which is a good level as it has acted as a pullback support in the past.
If the price continues to decline, the 2nd support at 1918.22 could provide another good buying opportunity. This support level is also a 61.80% Fibonacci retracement level, which further adds to its significance as a potential support level.
On the other hand, if the price manages to move upwards, the 1st resistance at 2138.66 could provide a challenge for the price to break through. This level is a multi-swing high resistance, which indicates that it has previously acted as a significant resistance level in the past.
In addition, there is an intermediate support at 2057.82, which is a good level as it has acted as a swing low support. If the price breaks below the 1st support at 2015.74, the intermediate support at 2057.82 could provide a potential buying opportunity.
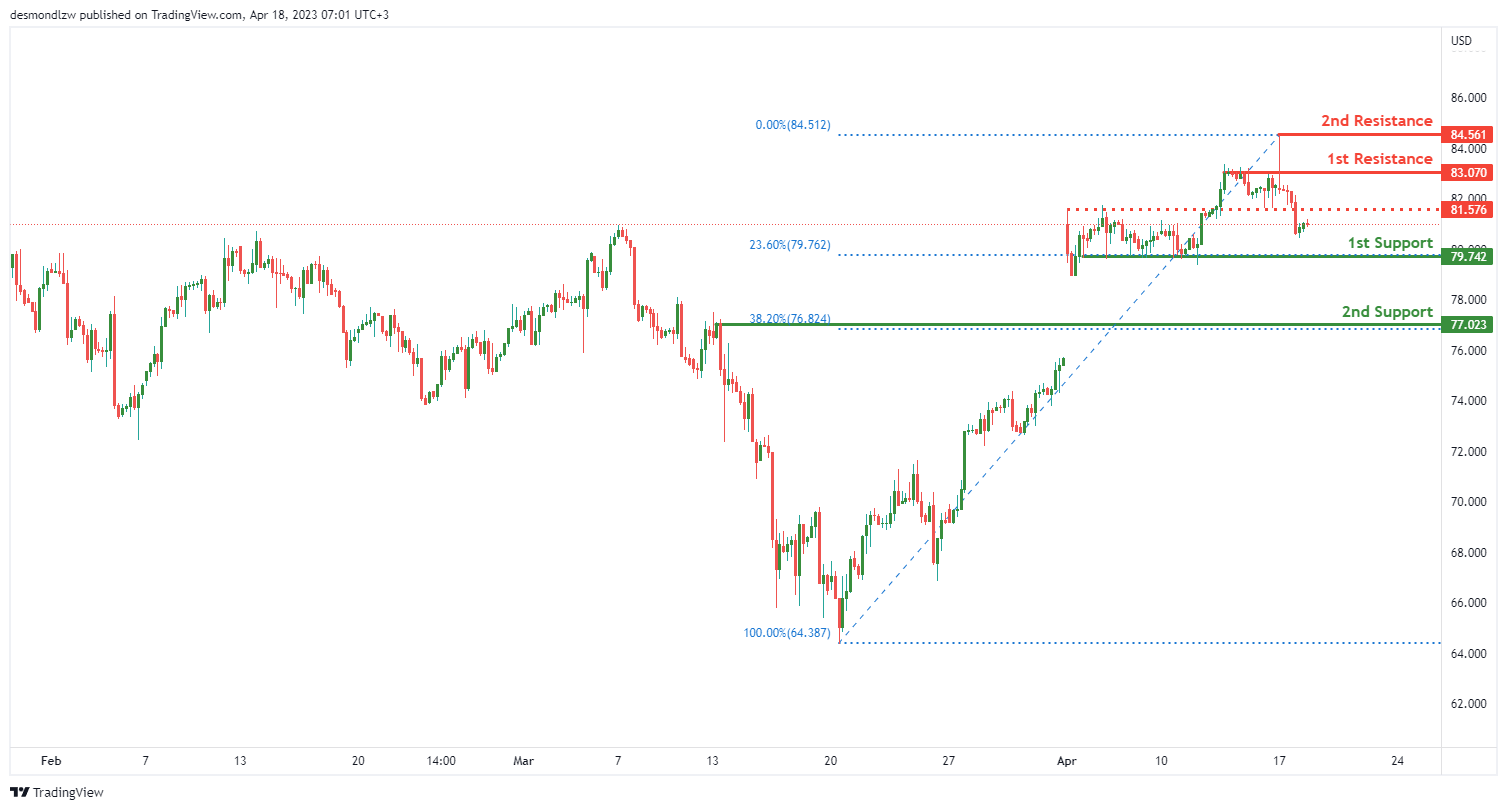
WTI/USD:
The WTI chart is bearish. The price could potentially continue to move bearishly towards the 1st support at 79.74, which is a good level as it is a pullback support and a 23.60% Fibonacci retracement level. If the price breaks below this support level, the 2nd support at 77.02 could provide another potential buying opportunity, as it is also a swing low support and a 38.20% Fibonacci retracement level.
On the other hand, if the price manages to move upwards, the 1st resistance at 83.07 could provide a challenge for the price to break through. This level is a pullback resistance and may act as a barrier for the price to continue moving higher. Additionally, there is a 2nd resistance at 84.56, which is a swing high resistance level and may provide further resistance if the price attempts to move higher.
There is also an intermediate resistance level at 81.57, which is a pullback resistance level. If the price manages to break above the 1st resistance, the intermediate resistance at 81.57 could provide another challenge for the price to continue moving higher.
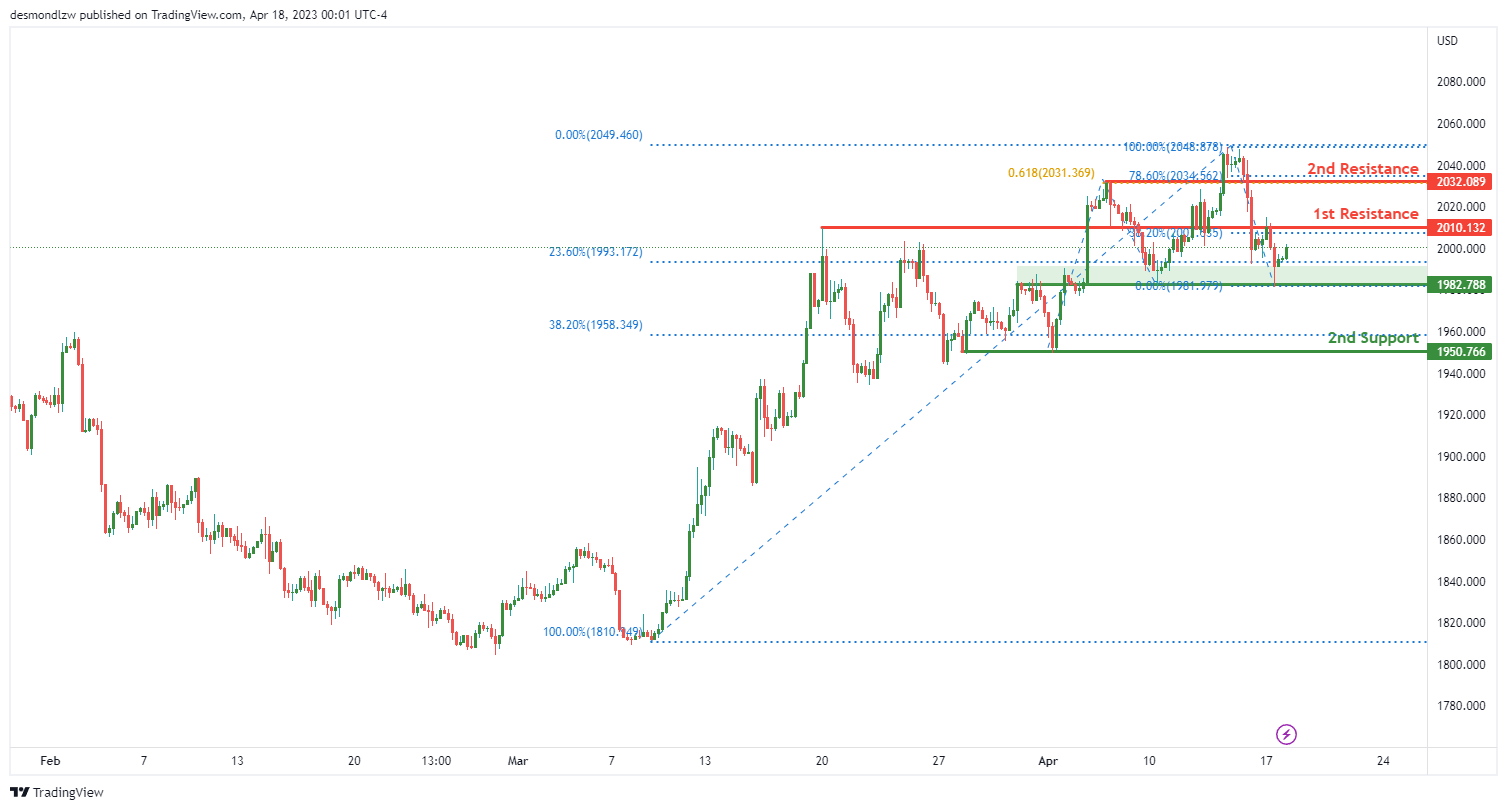
XAU/USD (GOLD):
The XAU/USD chart is bullish. The price could potentially continue to move bullishly towards the 1st resistance at 2010.13, which is a good level as it is an overlap resistance and a 38.20% Fibonacci retracement level. If the price manages to break above this resistance level, the 2nd resistance at 2032.08 could provide another potential buying opportunity, as it is a pullback resistance and a 61.80% Fibonacci projection level.
On the other hand, if the price declines, the 1st support at 1982.78 could provide a potential buying opportunity. This support level is an overlap support and a 23.60% Fibonacci retracement level. If the price breaks below this support level, the 2nd support at 1950.76 could provide another potential buying opportunity, as it is a multi-swing low support and a 38.20% Fibonacci retracement level.
The accuracy, completeness and timeliness of the information contained on this site cannot be guaranteed. IC Markets does not warranty, guarantee or make any representations, or assume any liability regarding financial results based on the use of the information in the site.
News, views, opinions, recommendations and other information obtained from sources outside of www.icmarkets.com, used in this site are believed to be reliable, but we cannot guarantee their accuracy or completeness. All such information is subject to change at any time without notice. IC Markets assumes no responsibility for the content of any linked site.
The fact that such links may exist does not indicate approval or endorsement of any material contained on any linked site. IC Markets is not liable for any harm caused by the transmission, through accessing the services or information on this site, of a computer virus, or other computer code or programming device that might be used to access, delete, damage, disable, disrupt or otherwise impede in any manner, the operation of the site or of any user’s software, hardware, data or property.


