
Key risk events today:
UK Employment Data; German ZEW Economic Sentiment; EU Economic Summit; Canada Manufacturing Sales m/m; US Core Retail Sales m/m; US Retail Sales m/m.
(Previous analysis as well as outside sources – italics).
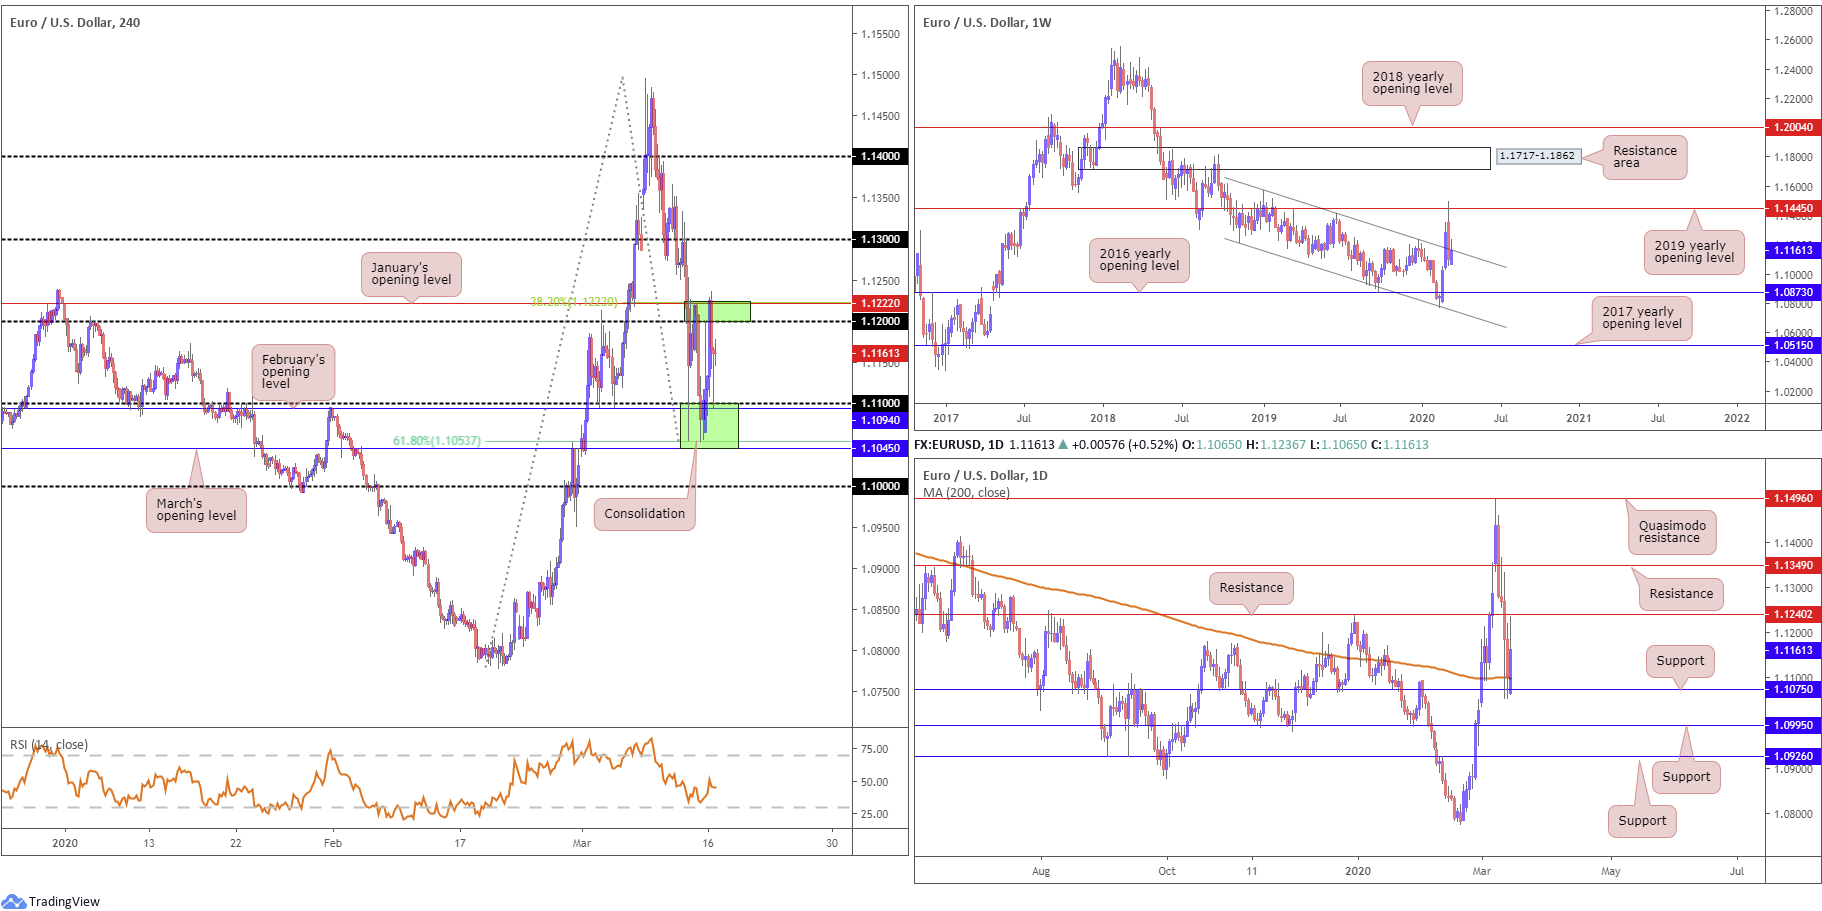
EUR/USD:
Technically, EUR/USD remains within an interesting consolidation between 1.1223 and 1.1045 on the H4 scale. The upper boundary contains January’s opening level at 1.1222, a 38.2% Fibonacci resistance at 1.1223 and the 1.12 handle. The lower boundary, on the other hand, has March’s opening level stationed at 1.1045, a 61.8% Fibonacci support at 1.1053, February’s opening level at 1.1094 and the round number 1.11. Outside of the current range, 1.13 stands nearby, as does the key figure 1.10.
Technical research based on the weekly timeframe had the 2019 yearly opening level from 1.1445 elbow its way back into the spotlight last week, with bears reasserting their dominance and snapping a three-week winning streak. Down more than 180 points, price dipped its toes back within a descending channel formation (1.1569/1.1215), with price currently retesting the upper channel boundary. Downside support from this point has the 2016 yearly opening level at 1.0873 in view, in line with the primary trend, drifting south since 2018.
Focus on the daily timeframe remains on support at 1.1075 and the 200-day SMA (orange – 1.1099), followed by another layer of support at 1.0995. To the upside, resistance is seen at 1.1240.
Areas of consideration:
Range traders may attempt to fade the outer limits of the current H4 consolidation today, likely employing candlestick analysis as a means of additional confirmation, and targeting the opposing edge.
A break of 1.1222 may prompt breakout buying to 1.13; conservative traders will likely want a retest to form before committing. A violation of 1.1045, nonetheless, will likely see breakout sellers target 1.10, which by and of itself, is a widely watched figure and echoes robust support.
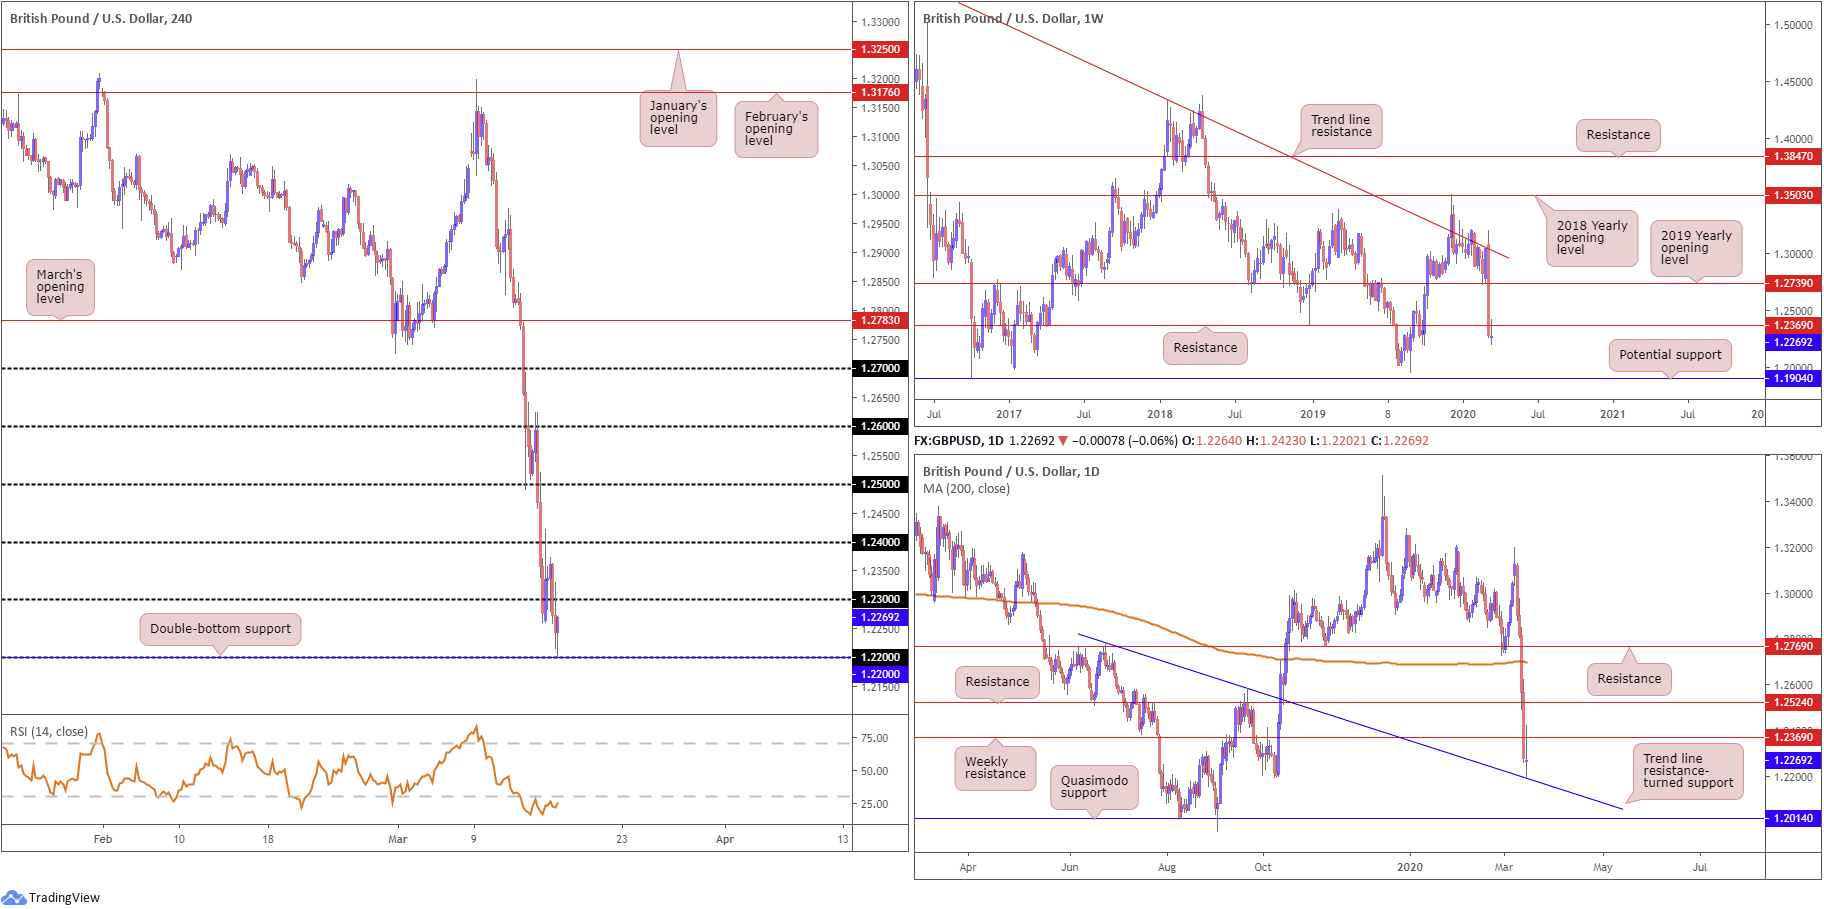
GBP/USD:
Trade witnessed an early bid dominate GBP/USD Monday, drawing price action north of 1.24 on the H4 timeframe. The pound, though, as you can see, was unable to sustain gains past 1.24, declining to 1.23 and holding as support amid early London hours. Defenceless, buyers eventually gave way and drove price to 1.2202, just ahead of a double-bottom support at 1.2200 and the round number at 1.22. The relative strength index continues to navigate its way through oversold terrain, but is showing modest signs of recovery.
Higher-timeframe movement on the weekly timeframe retested support-turned resistance at 1.2369. Support resides around 1.1904, a level that capped downside in early October 2016, which is sited just south of the 1.1958 September 2nd low. Daily price, however, is deriving support off a trend line resistance-turned support, extended from the high 1.2783.
Areas of consideration:
While weekly price indicates further downside, daily and H4 action suggests a recovery. What’s also interesting on the H4 timeframe is the mild AB=CD bullish correction. As such, a close above 1.23 may be something to watch for today. Breakout buyers have approximately 70 points to play with north of 1.23 until shaking hands with weekly resistance at 1.2369. Therefore, tight entries could achieve reasonably attractive risk/reward.
Alternatively, driving through 1.22 may be on the horizon, unlocking the door towards 1.21 and then possibly Quasimodo support at 1.2014 on the daily timeframe.
AUD/USD:
AUD/USD glided to lows at 0.6078 Monday, its lowest level since late 2008. While kicking off the week under pressure amid coronavirus developments, the US Federal Reserve emergency policy action caused a reasonably strong move to the downside in the USD, bolstering the pair off the 0.61 handle on the H4 timeframe. A break here, nonetheless, has the widely watched key figure 0.60 in sight.
The story on the higher timeframes has weekly support in motion at 0.6101, coupled with channel support, taken from the low 0.6744. On the daily timeframe, weekly support is further reinforced by a 161.8% Fibonacci extension point at 0.6068. Note resistance on the weekly timeframe resides around 0.6359 while on the daily timeframe resistance is seen at 0.6301, nearby a channel support-turned resistance, etched from the low 0.6433.
Areas of consideration:
According to the primary trend, the outlook is not bright for AUD/USD.
However, weekly support at 0.6101/channel support, the round number 0.61 on the H4 timeframe, along with the relative strength index (RSI) testing oversold territory and additional daily support from a 161.8% Fibonacci extension point at 0.6068 provides quite a floor.
Even if we do manage to eke out a move beneath 0.61, the current weekly channel support and daily 161.8% Fibonacci extension level may prove problematic for breakout sellers.
The dilemma, therefore, according to chart studies, is a long at current price is in line with technical structure, though against the predominant downtrend.

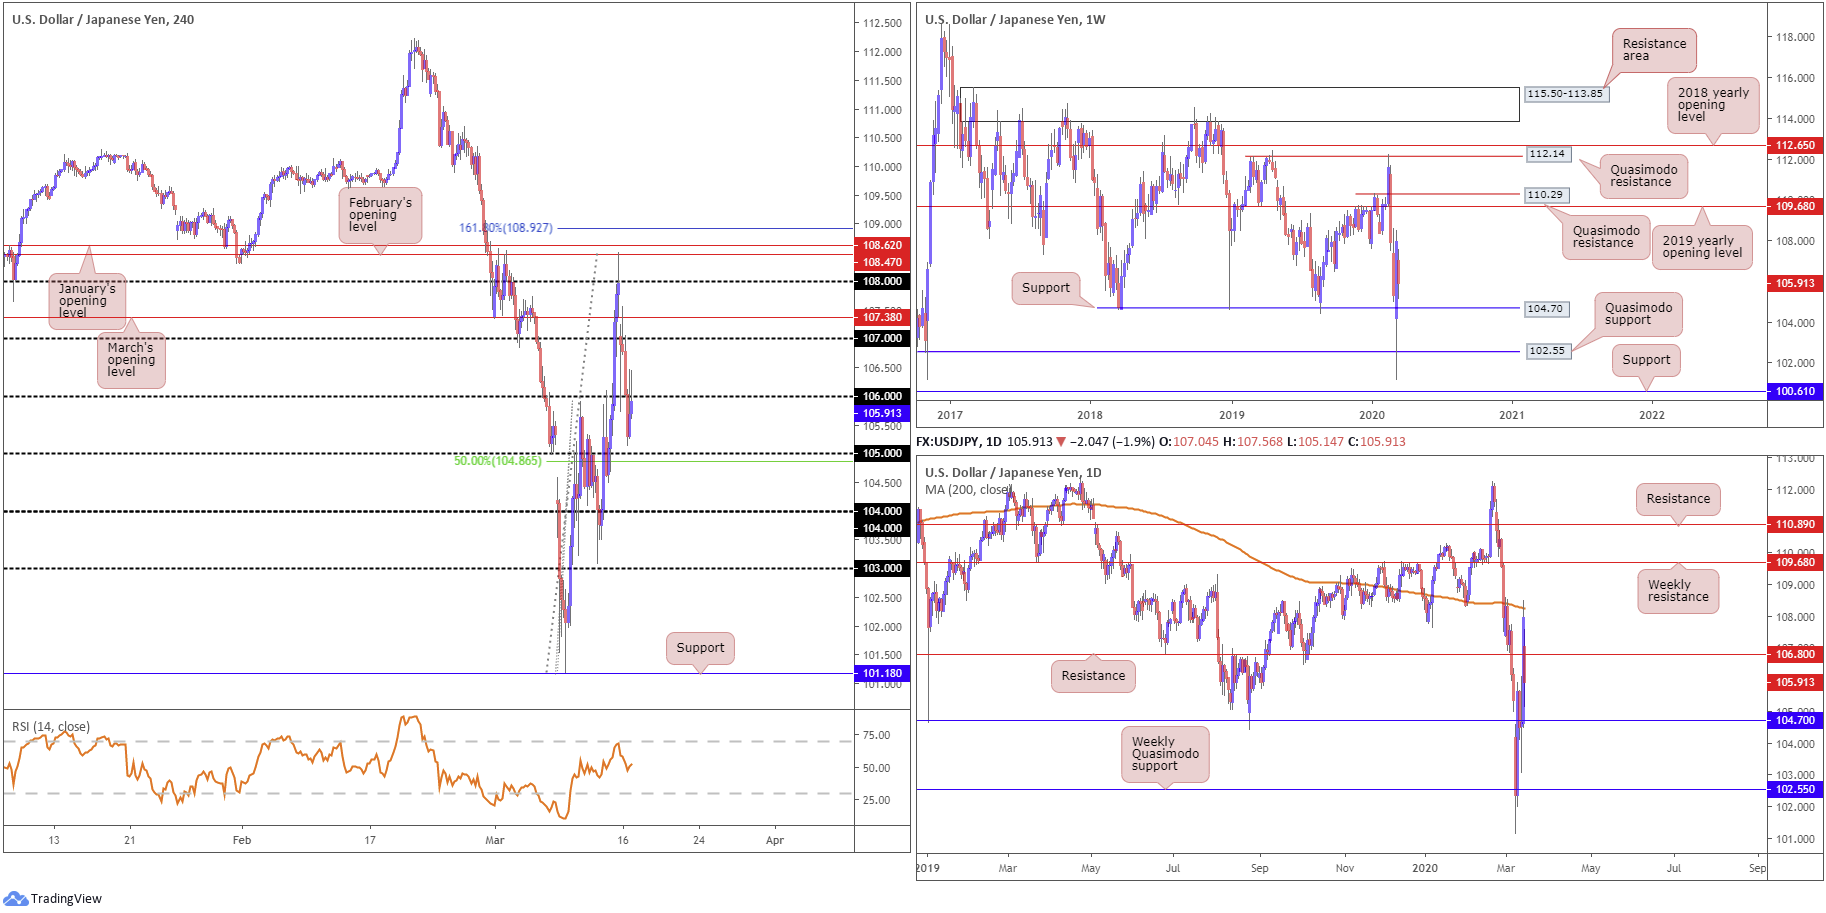
USD/JPY:
Demand for the safe-haven Japanese yen increased Monday as global equities were a sea of red across the board, despite impetus from central banks. USD/JPY nosedived through March’s opening level at 107.38, 107 and 106, with H4 action currently retesting the underside of the latter as resistance. 105 calls for attention to the downside, closely bolstered by a 50.0% retracement value at 104.86 and then a weekly support at 104.70, followed by a weekly Quasimodo support at 102.55.
Resistance on the daily timeframe at 106.80 remains on the radar, after rejecting the 200-day SMA (orange – 108.24). Support on this timeframe continues to be governed by the weekly levels highlighted above.
Areas of consideration:
For those who read Monday’s technical briefing you may recall the following piece:
The combination of the 200-day SMA and 108 holding on the H4 may send USD/JPY lower today/early week, with traders likely to embrace 107.38 and 107 on the H4 timeframe as support. A break lower, though, lands the unit within striking distance of daily support at 106.80.
Well done to any readers who managed to jump aboard shorts from the 108ish region.
Going forward, resistance at the underside of 106 is likely to entice further selling, targeting 105 and beyond. In the event the current H4 candle closes as is, a shooting star (bearish) candlestick formation, this will further encourage a move lower, with candlestick traders basing entry and risk on the back of the candlestick structure.
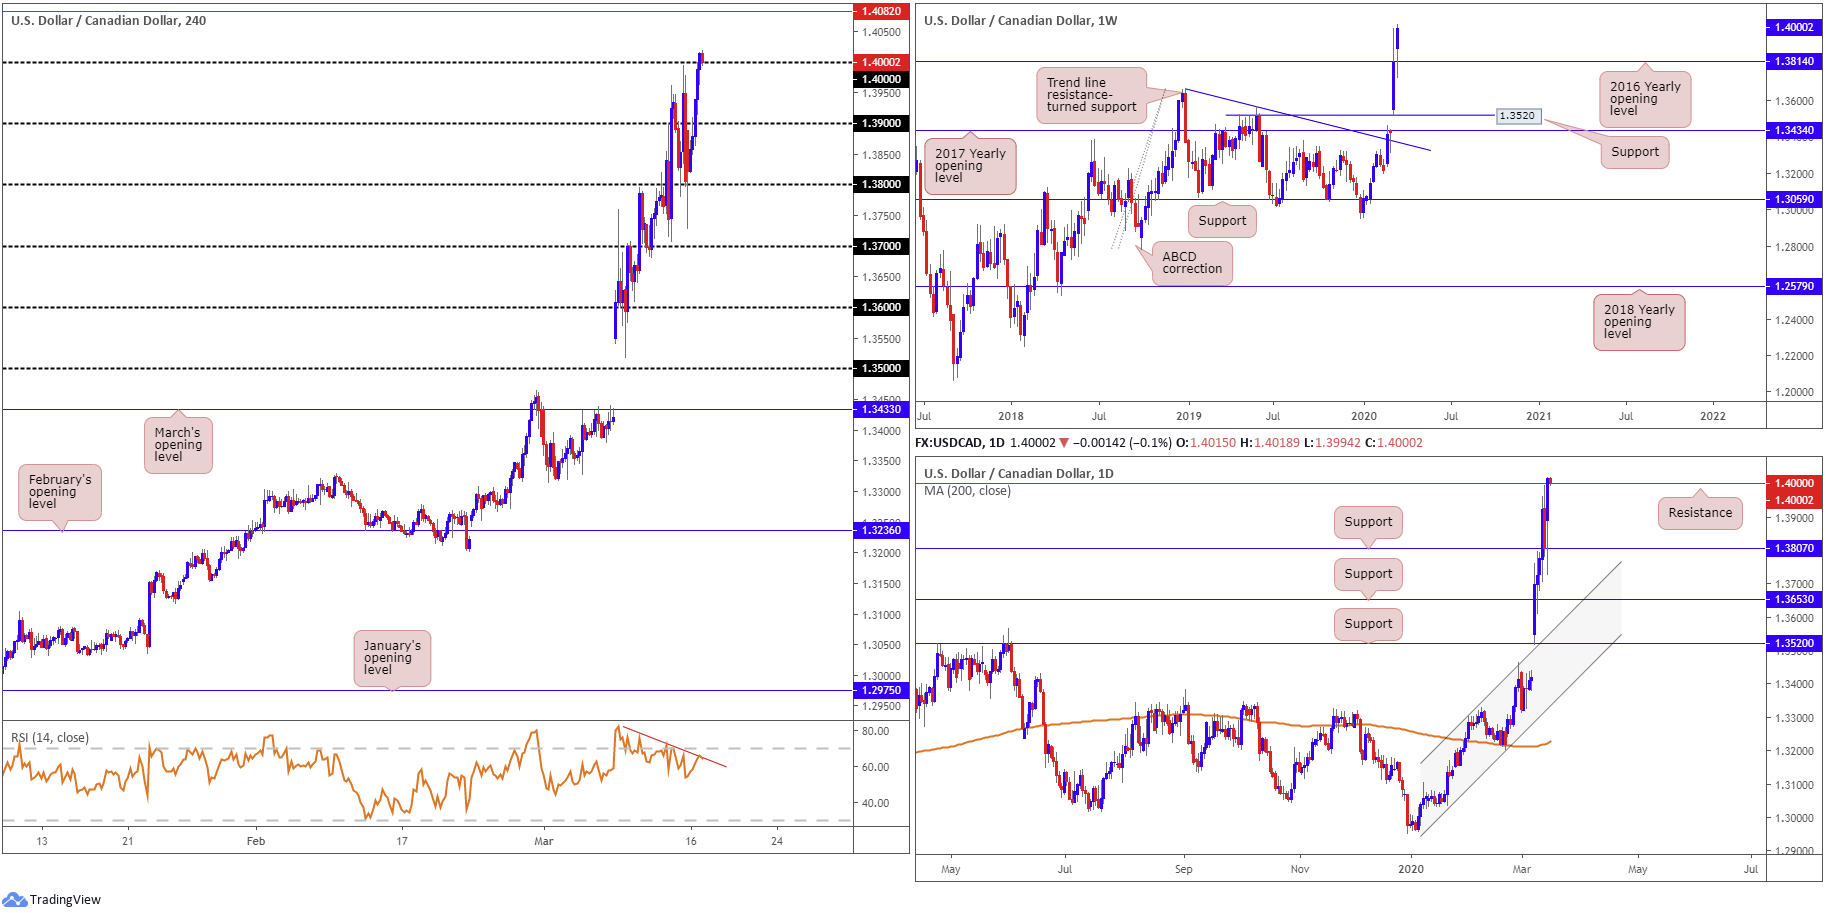
USD/CAD:
Monday had the US dollar surge more than 200 points vs. the Canadian dollar, or 1.50%, amid exacerbated losses in oil markets. USD/CAD latched onto a healthy bid and overthrew 1.39 and marginally pierced 1.40 on the H4 timeframe. Although the relative strength index (RSI) continues to emphasise bearish divergence and may spark a move back to 1.39, the H4 candles exhibits scope to press as far north as Quasimodo resistance at 1.4082, drawn from February 2nd, 2016.
Meanwhile, further afield on the weekly timeframe we can see price retested the 2016 yearly opening level at 1.3814 as support, and shows potential for moves to a 161.8% Fibonacci extension at 1.4198, followed by the 1.4689 January 18th high, 2016.
The key 1.40 level also represents resistance on the daily timeframe, with a break of this level exposing the 161.8% Fibonacci extension at 1.4198 mentioned above on the weekly timeframe. In the event we turn lower from 1.40, though, daily support forms around 1.3807, located closely by 1.3814 on the weekly timeframe.
Areas of consideration:
The general sense on the weekly timeframe suggests buyers continue to have the upper hand in this market. This may pull on H4 and daily price to break 1.40 today and target a run to H4 Quasimodo resistance underscored above at 1.4082.
As such, a decisive H4 close north of 1.40 today could spur additional upside; breakout traders will likely enter long on the close of the breakout candle, with others possibly waiting and seeing if a retest occurs before committing.
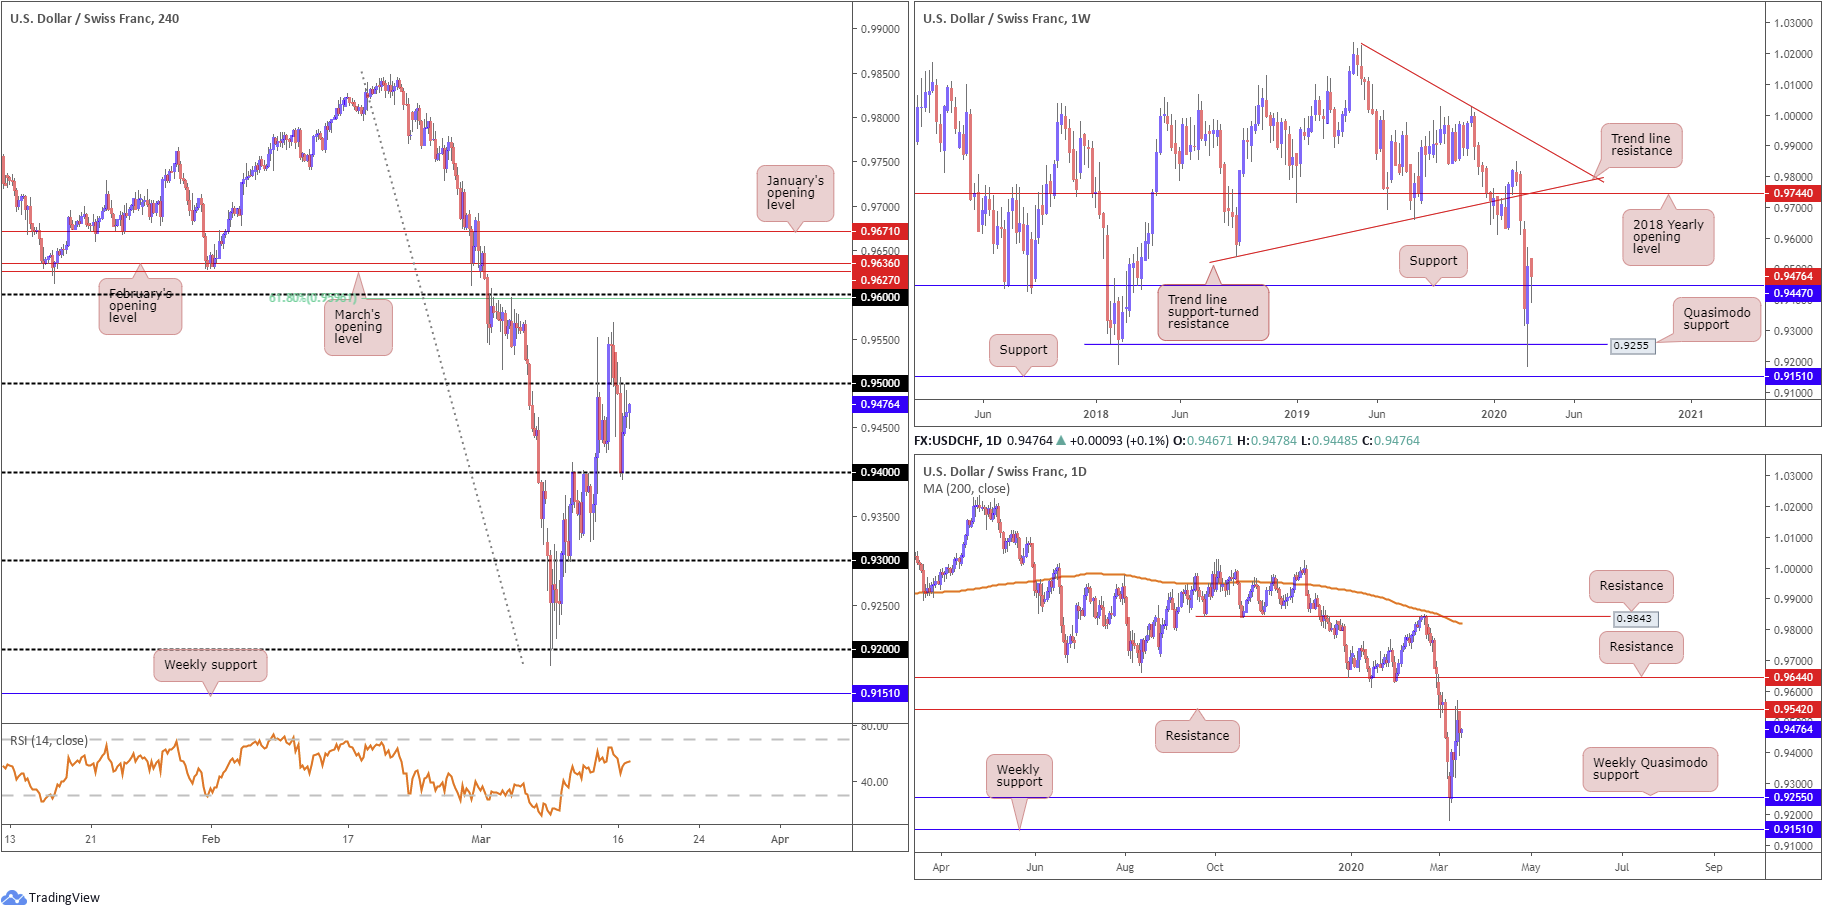
USD/CHF:
Opening movement Monday fell sharply, reclaiming 0.95 to the downside, with sellers remaining in the driving seat until reaching 0.94, which held ground, bolstered by a rebound from lows of 97.45 in the US dollar index. As evident from the H4 timeframe, the short-term trend exhibits an upward trajectory, north of 0.92, with a break back above 0.95 laying the basis for a move to 0.96 and a 61.8% Fibonacci retracement at 0.9598, closely shadowed by March and February’s opening levels at 0.9627 and 0.9636, respectively.
Weekly Quasimodo support at 0.9255 capped downside last week, albeit following a brief spell to lows at 0.9182 (levels not seen since June 2015). Recovery from here saw weekly resistance from 0.9447 come under fire, with buy stops north of the level providing impetus Monday as the pair retested the latter as support. The general sense on this timeframe is that continued buying will draw the spotlight towards the 2018 yearly opening level at 0.9744, joined closely by two weekly trend line resistances (0.9542/1.0226).
Recent buying, nevertheless, is under pressure on the daily timeframe, with resistance at 0.9542 entering the fight at the tail end of the week and holding Monday. A violation of this level could lead to some headway being made towards 0.9644, another layer of resistance.
Areas of consideration:
Knowing we’re coming from daily resistance at 0.9542, traders may be nervous breakout buying north of 0.95. The flip side to this, of course, is the space available to run higher on the weekly timeframe. Therefore, by way of added confirmation, buyers may look for a retest at 0.95 to form before pulling the trigger, held by way of a H4 bullish candlestick signal. This helps confirm buyer intent.
0.96 is also a point of interest on the H4 timeframe as resistance, owing to price structure joining closely with a 61.8% Fibonacci retracement at 0.9598, closely shadowed by March and February’s opening level at 0.9627 and 0.9636, respectively. Do bear in mind, though, higher-timeframe resistance lacks within this region – the nearest is set at 0.9644 on the daily timeframe.
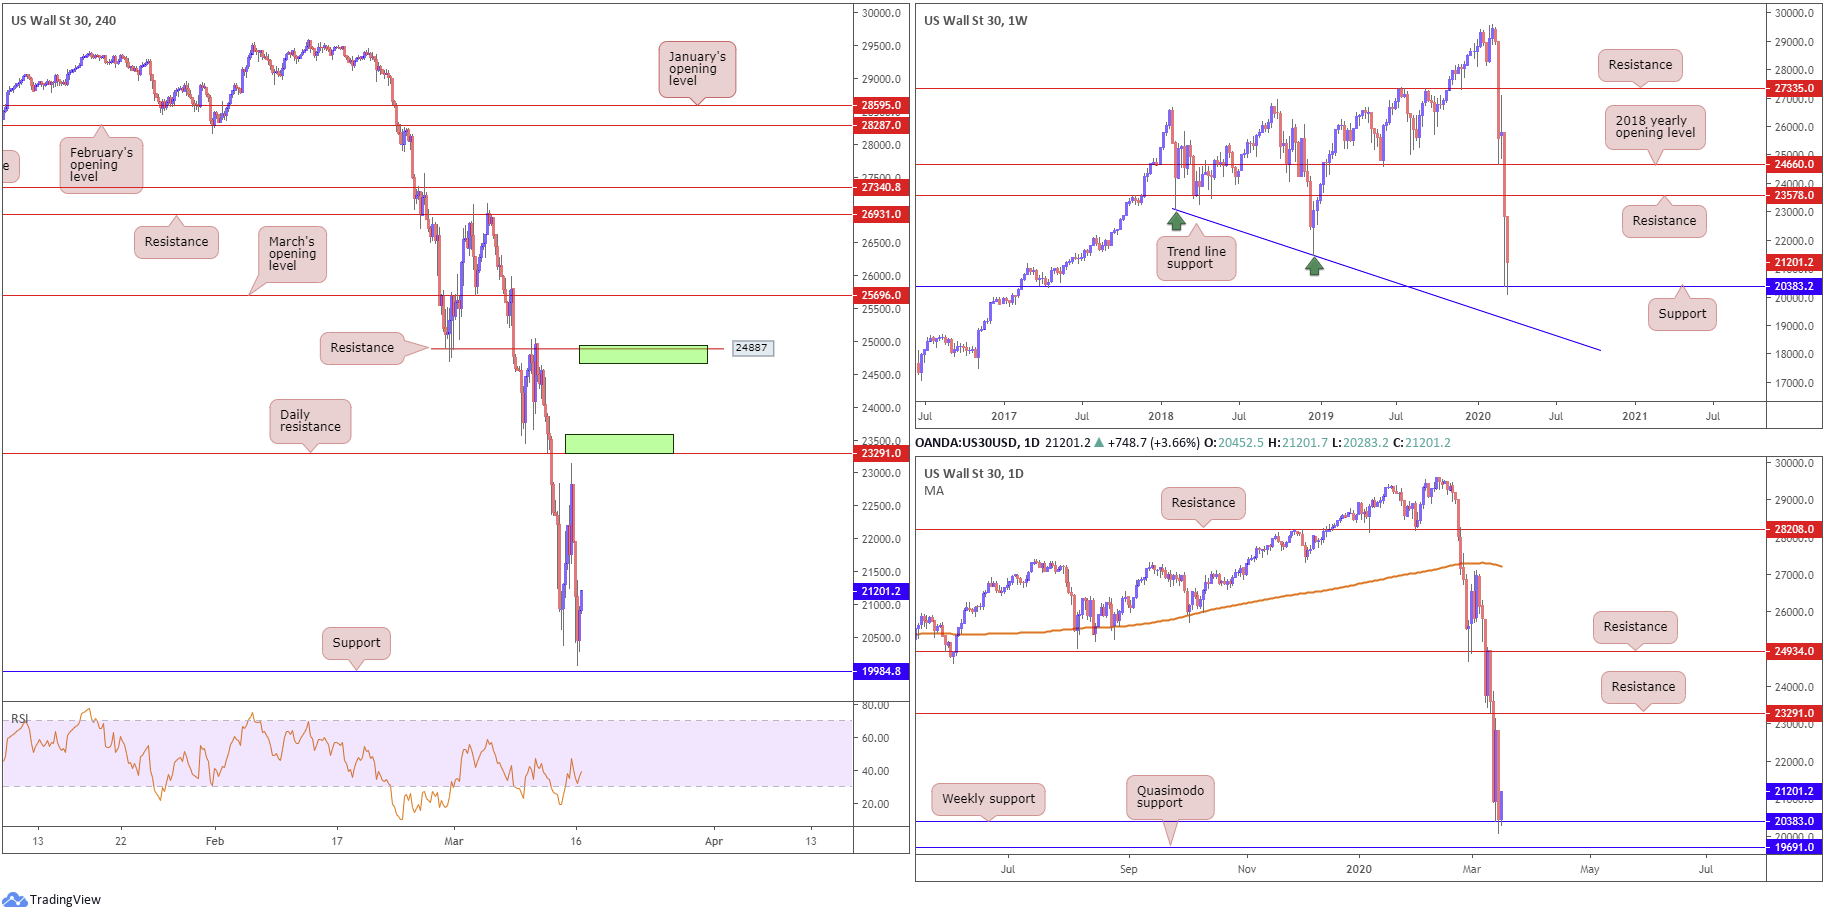
Dow Jones Industrial Average:
Major US benchmarks maintained a strong underlying offer Monday, reflecting fear among investors that Fed stimulus may not be sufficient to ward off a coronavirus-induced recession. The Dow Jones Industrial Average erased 2997.10 points, or 12.93%; the S&P 500 also lost 324.86 points, or 11.98%, and the tech-heavy Nasdaq 100 ended lower by 974.89 points, or 12.19%.
Dropping nearly 3,000 points Monday brought weekly price within touching distance of support priced in at 20383, which, for the time being, is holding. Continued decline, though, may see sellers embrace trend line support, pencilled in from the low 23055. A rejection off 20383, on the other hand, has resistance at 23578 to target, whereas a move off 20383 on the daily scale has resistance plotted at 23291 in sight. Moves beneath the weekly support on the daily timeframe will likely steamroll price action into a Quasimodo support at 19691. Also of note on the daily timeframe is the 200-day SMA (orange – 27209) seen turning lower.
It might also interest some traders to note that in between daily Quasimodo support at 19691 and weekly support at 20383, we also have a H4 support seen at 19984.
Areas of consideration:
Despite weekly support entering the fold at 20383, shadowed closely by daily Quasimodo support at 19691, buyers likely lack conviction in this one-way market right now.
The H4 zone marked in green (lower area) between 23578/23291 represents weekly and daily resistances, an area sellers may have on the radar for potential shorting opportunities, in the event we get back to these levels. Another area of interest (upper green zone), should 23578/23291 fail to produce much, is seen between 24934/24660, a zone made up of the 2018 yearly opening level at 24660, daily resistance at 24934 and H4 resistance at 24887.
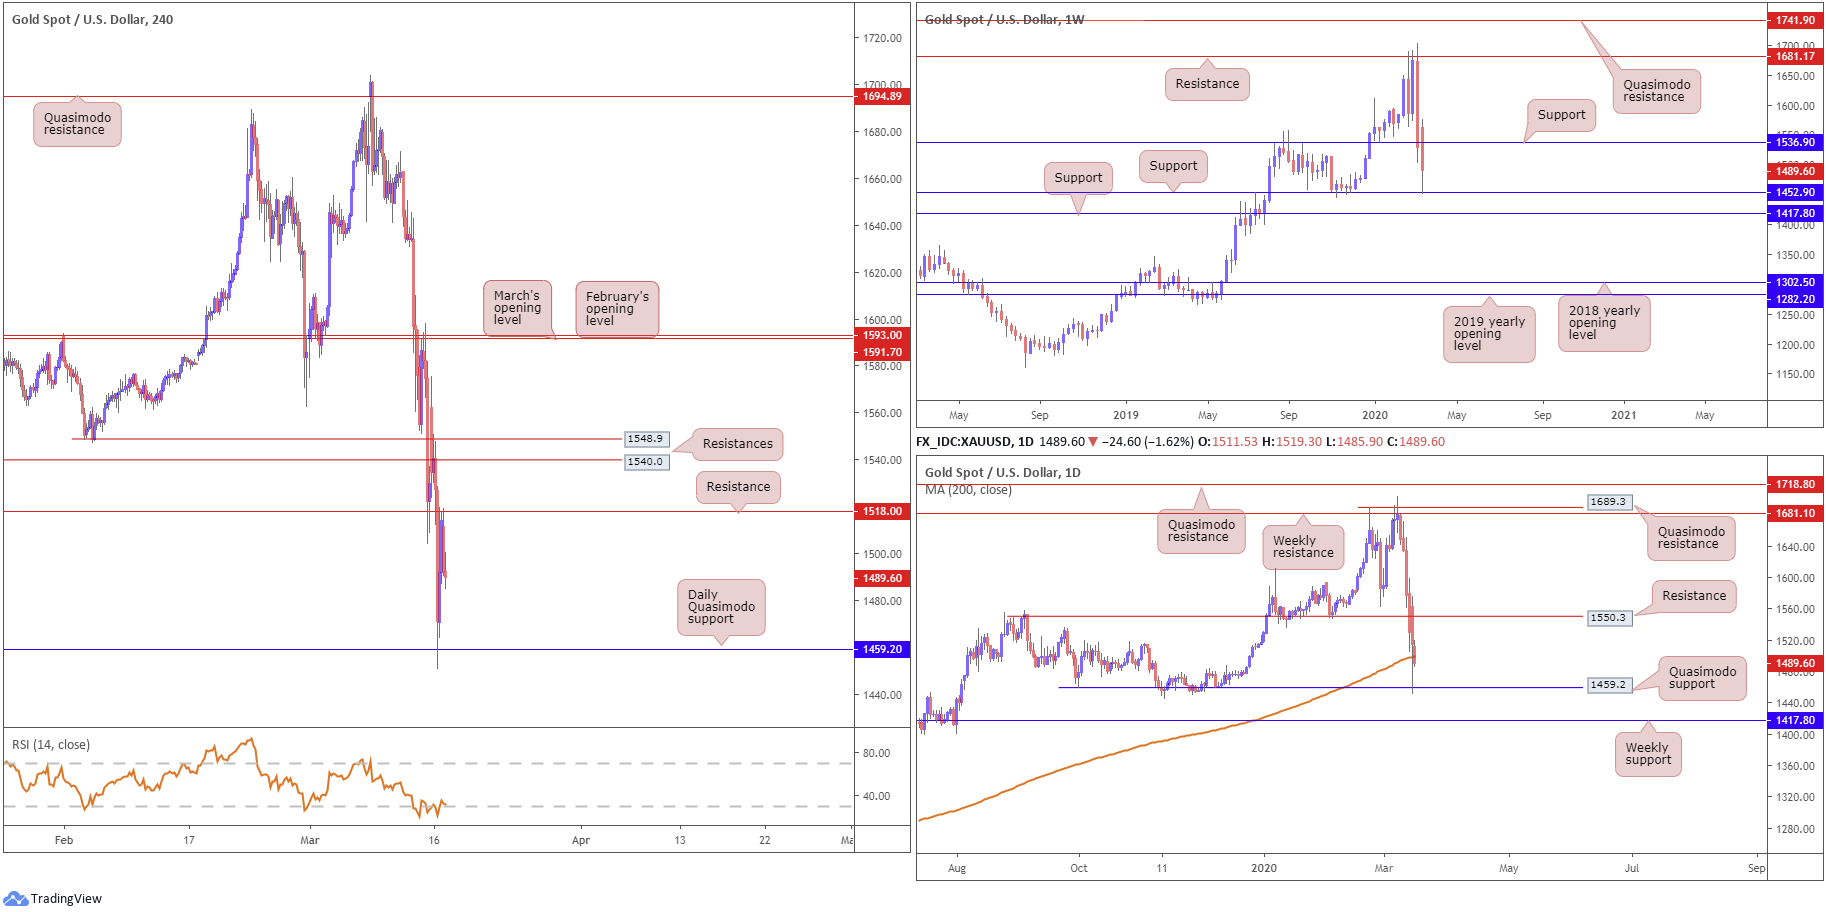
XAU/USD (GOLD):
Kicking this morning’s report off with a look at the weekly timeframe, the technical picture has the yellow metal nursing losses off support coming in at 1452.9, closely shadowed by another layer of support at 1417.8. This follows a breach of support at 1536.9, which could represent resistance going forward.
A closer reading of price action on the daily timeframe has bullion shaking hands with its 200-day SMA (orange – 1499.0) and paring losses off Quasimodo support from 1459.2, sited just north of the current weekly support level. Note should we dethrone the daily Quasimodo support today, weekly support highlighted above at 1417.8 is likely to make an entrance.
Resistance at 1518.0 is seen in motion on the H4 timeframe after registering 4-month lows and testing the daily Quasimodo support mentioned above at 1459.2 Monday. A move higher today could result in testing H4 resistances at 1548.9 and 1540.0. With respect to the relative strength index (RSI), we’re now trading within overbought terrain, but seen attempting to regroup off lows at 19.00.
Areas of consideration:
Technically speaking we have some heavy-weight support in this market at the moment: a weekly support at 1452.9, a daily Quasimodo support at 1459.2 and the 200-day SMA. Therefore, a break north of H4 resistance at 1518.0 may be on the cards, though upside north of here appears limited given 1536.9 having the potential to act as resistance on the weekly timeframe. Not to mention the H4 resistances located at 1548.9 and 1540.0, followed by daily resistance at 1550.3. That’s a lot of wood to chop through.
Although the primary trend remains facing a northerly trajectory, there’s equal opportunity for longs/shorts in this market right now.
The accuracy, completeness and timeliness of the information contained on this site cannot be guaranteed. IC Markets does not warranty, guarantee or make any representations, or assume any liability regarding financial results based on the use of the information in the site.
News, views, opinions, recommendations and other information obtained from sources outside of www.icmarkets.com.au, used in this site are believed to be reliable, but we cannot guarantee their accuracy or completeness. All such information is subject to change at any time without notice. IC Markets assumes no responsibility for the content of any linked site.
The fact that such links may exist does not indicate approval or endorsement of any material contained on any linked site. IC Markets is not liable for any harm caused by the transmission, through accessing the services or information on this site, of a computer virus, or other computer code or programming device that might be used to access, delete, damage, disable, disrupt or otherwise impede in any manner, the operation of the site or of any user’s software, hardware, data or property.


