
Key risk events today:
UK Average Earnings Index 3m/y; UK Claimant Count Change; UK Unemployment Rate; Canada Manufacturing Sales m/m; US Building Permits.
EUR/USD:
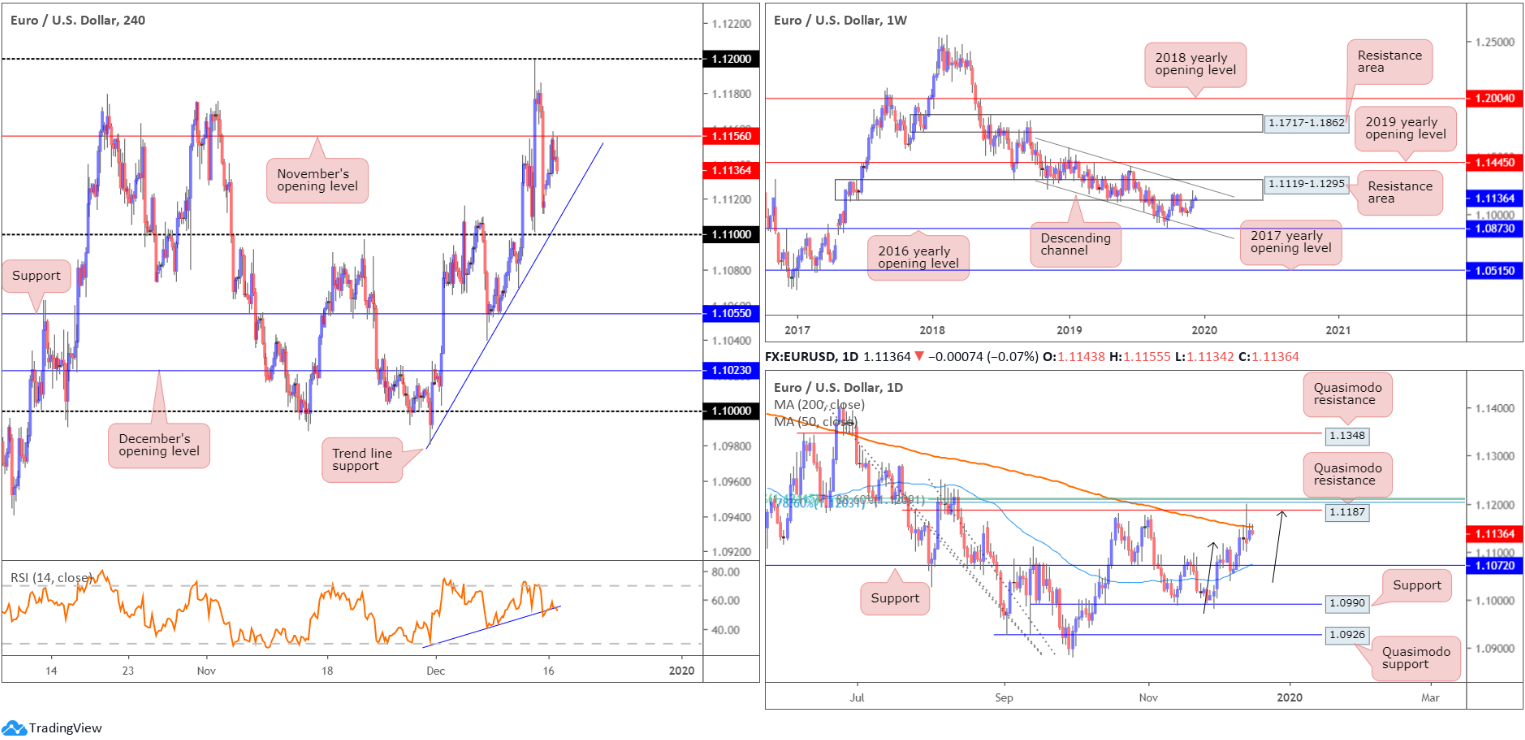
EUR/USD movement kicked off the week subdued, ranging no more than 25 points on the day. On the data front, Eurozone flash surveys disappointed across the board, with Germany’s manufacturing print stealing headlines at 44.3 vs. expected 44.6.
Technically, H4 price retested the underside of November’s opening level at 1.1156 and pressed lower. Trend line support, extended from the low 1.0981, rests as the next downside target on this scale, closely followed by the 1.11 handle. Above 1.1156, 1.12 is seen, whereas a push through 1.11 exposes support coming in at 1.1055. Indicator-based traders may also wish to note the relative strength index (RSI) rests above its 50.0 value, though is attempting to break a trend line support (blue line). This may be an early warning sign we’re heading lower.
Weekly flow remains contained south of a long-standing resistance area at 1.1119-1.1295, which happens to intersect closely with a channel resistance, extended from the high 1.1569. Downside objectives visible from here fall in at the 2016 yearly opening level at 1.0873 and channel support, taken from the low 1.1109.
A closer reading of technical movement on the daily timeframe reveals the 200-day SMA (orange – 1.1151) held price lower yesterday. Previously, however, price whipsawed through the said SMA and connected with Quasimodo resistance at 1.1187, positioned a few points south of a Fibonacci cluster around the 1.1206 neighbourhood. What’s also notable from a technical perspective is the bearish ABCD correction (black arrows) that terminated at the aforementioned Quasimodo resistance. Therefore, based on daily analytics, further downside could be seen. Support on this timeframe rests at 1.1072/50-day SMA, with a break of this level potentially setting the stage for a push towards support at 1.0990.
Areas of consideration:
Shorts on the back of the reaction off November’s opening level at 1.1156 is an option, bolstered by weekly and daily structure. Reducing risk to breakeven at 1.11 is an idea, with daily support at 1.1072 set as a take-profit target.
Knowing 1.1072 lurks beneath 1.11, and given psychological levels are prone to fakeouts, the likelihood of a fakeout developing through 1.11 to 1.1072 is high, according to the chart studies. In the event a fakeout through 1.11 takes form, longs on a H4 close back above the round number could be a possibility, targeting November’s opening level at 1.1156 as the initial port of call. Granted, this will have you competing with weekly sellers, therefore strict trade management is an absolute must.
GBP/USD:
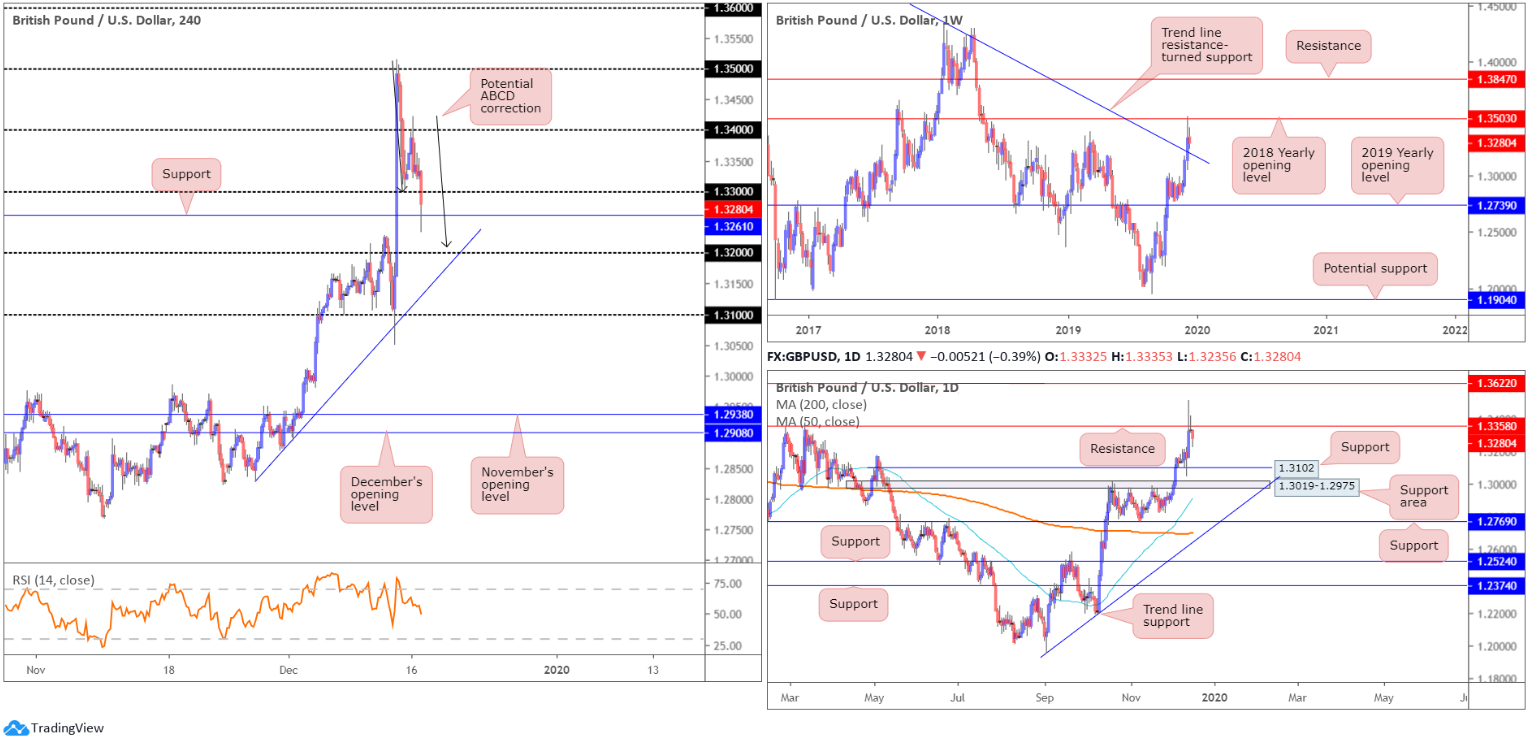
Sterling’s post-UK election faded after a fleeting expedition north of 1.34 vs. the buck Monday. Weighed by disappointing preliminary PMIs for December, particularly in the manufacturing sector, and reports UK PM Boris Johnson plans law change to block a further Brexit delay, GBP/USD trades south of 1.33, though off support at 1.3261 (a prior Quasimodo resistance). Beyond 1.3261, support rests at the 1.32 level, aligning closely with trend line support, pencilled in from the low 1.2827. What’s also notable from a technical standpoint is a potential ABCD correction (black arrows) that terminates just north of 1.32.
Pound slides on reports that Boris Johnson plans law change to block a further Brexit delay – BBG.
On a wider perspective, weekly price defends the 2018 yearly opening level at 1.3505, with the possibility of a run being seen towards long-term trend line resistance-turned support, extended from the high 1.5930. Technical research on the daily timeframe, also reveals price defending resistance at 1.3358 and shows the next downside target is not expected to make an appearance until reaching support at 1.3102.
Areas of consideration:
With both weekly and daily timeframes portending southerly moves, entering long off the current H4 support at 1.3261 is chancy. However, should H4 close back above 1.33, this could be enough to draw in some buying, based on the sell stops tripped below 1.33, though do not expect much more than 1.3350ish from here.
A H4 close beneath 1.3261 is interesting, since this plays in line with higher-timeframe flow. As such, intraday selling opportunities between 1.3261 and 1.32 are certainly an option.
AUD/USD:
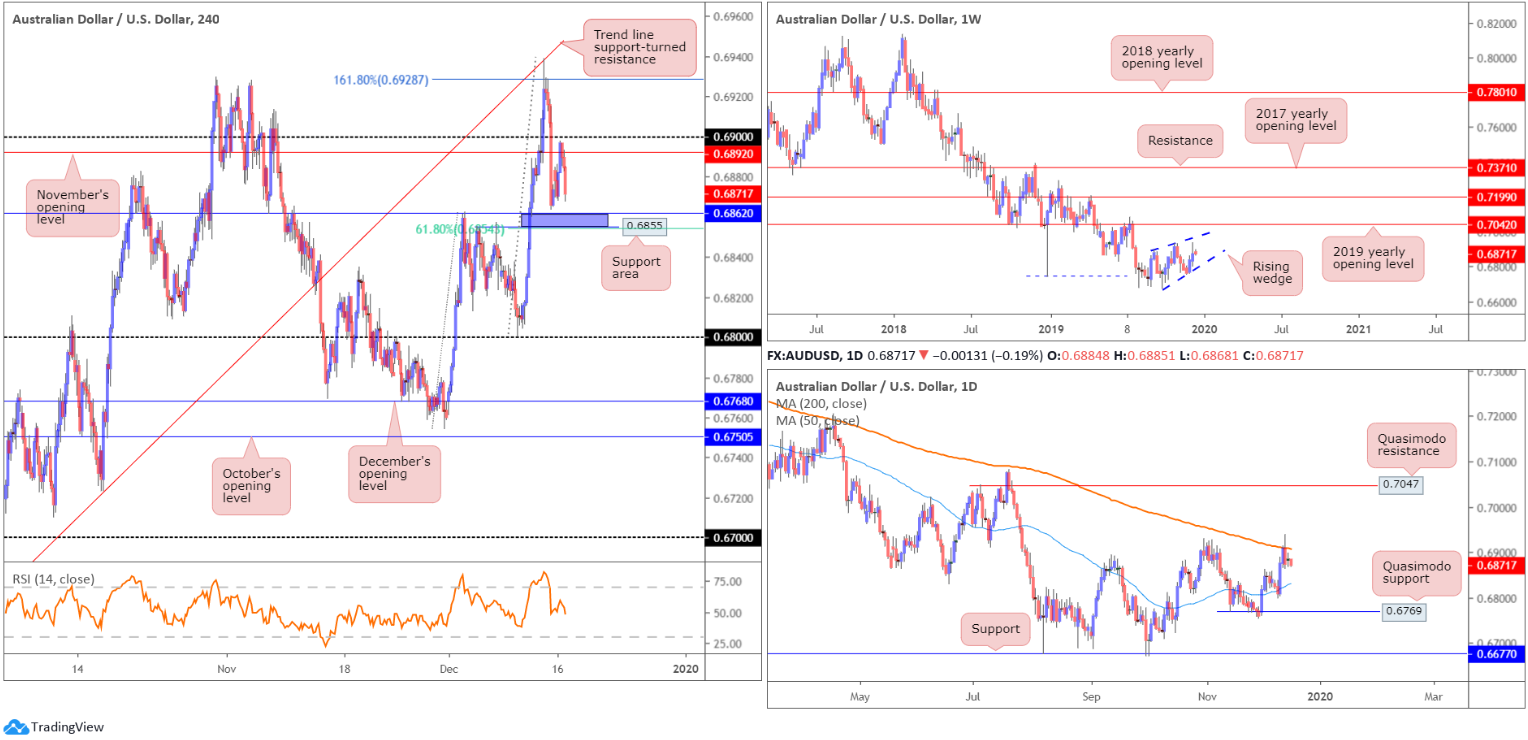
In recent hours, market movement revisited the underside of November’s opening level at 0.6892 and rotated south. As you can see, H4 support rests close by at 0.6855/0.6862 (purple), which happens to merge with a 61.8% Fibonacci retracement ratio. Beyond here, a reasonably free run exists to 0.68.
Technical action based on the weekly timeframe shows the weekly candles have been busy carving out what appears to be a rising wedge formation, since registering a bottom in late September at 0.6670. This is typically considered a continuation pattern. As the 2019 yearly opening level at 0.7042 is seen close by, the aforementioned rising wedge could potentially continue advancing until connecting with this angle. The primary downtrend, visible from this timeframe, has also been in play since early 2018, consequently adding weight to a breakout south possibly emerging.
The story on the daily timeframe reveals the unit recently crossed paths with the 200-day SMA (orange – 0.6907). Note AUD/USD has traded south of the said SMA since April 2019, therefore the dynamic value may continue to offer resistance this week. In terms of support, the 50-day SMA (blue – 0.6830) is visible, with a break perhaps clearing the river south to Quasimodo support at 0.6769.
Areas of consideration:
A bounce from the H4 support area at 0.6855/0.6862 may occur today, though given the force of selling generated from the 200-day SMA, price will unlikely make it past November’s opening level at 0.6892. Therefore, ensure risk/reward metrics favour such a trade before pulling the trigger.
A break south of 0.6855/0.6862, on the other hand, likely unlocks bearish scenarios to the 50-day SMA (daily) and 0.68.
USD/JPY:
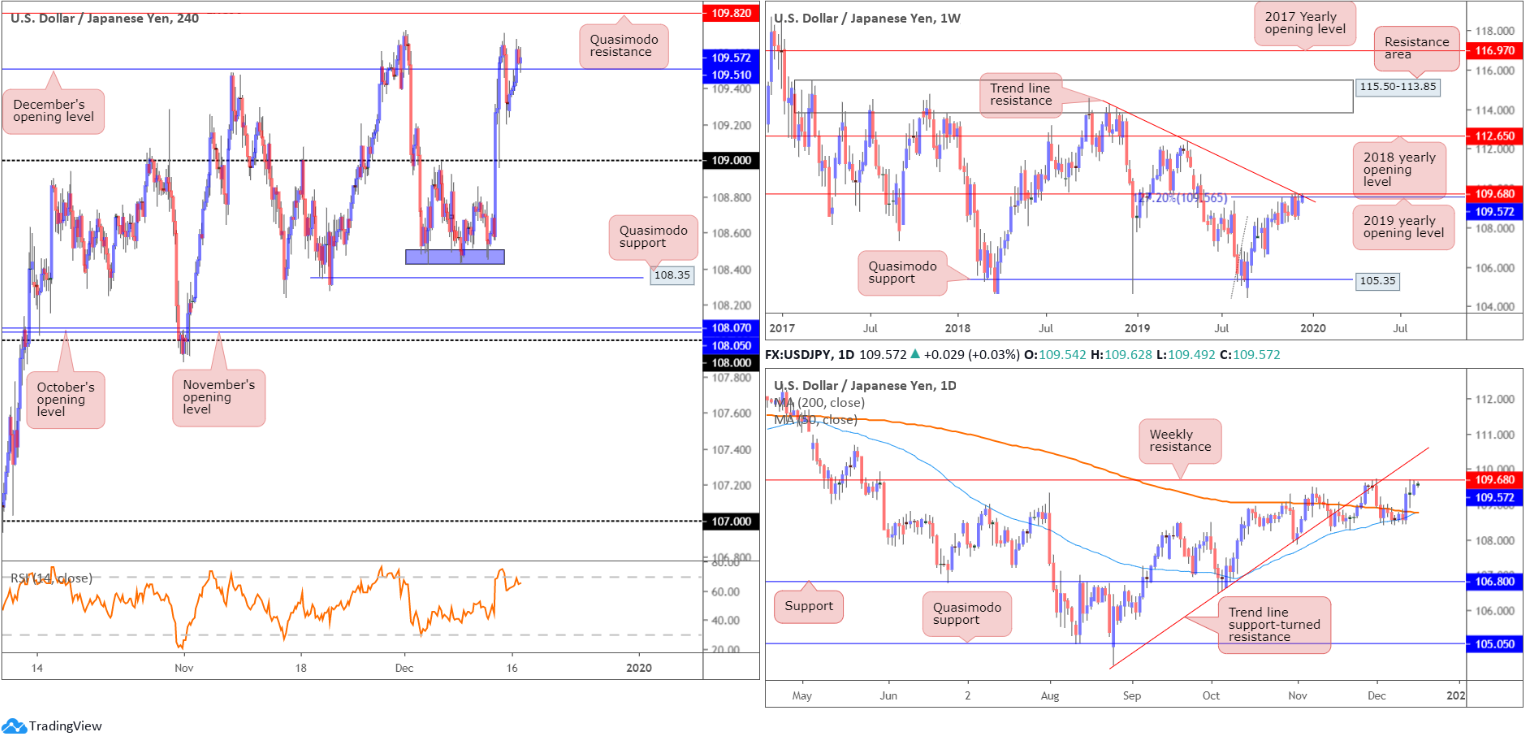
USD/JPY bulls entered an offensive phase Monday, drawing H4 price through December’s opening level at 109.51. Quasimodo resistance at 109.82 remains the next upside objective on this scale. Alone, this Quasimodo formation is unlikely to produce much. However, this level finds additional resistance on the higher timeframes:
- A collection of weekly resistances are in motion: a 127.2% Fibonacci ext. point at 109.56 (taken from the low 104.44), resistance formed at 109.68, the 2019 yearly opening level and trend line resistance, extended from the high 114.23. Aside from the 106.48 September 30 swing low, limited support is evident on the weekly timeframe until shaking hands with Quasimodo support at 105.35. A break north, however, highlights the 2018 yearly opening level at 112.65 as the next possible layer of resistance.
Daily action is also seen shaking hands with the said weekly resistances. The difference on this scale, nonetheless, is the downside targets. The 200/50-day SMAs (orange – 108.77/blue – 108.77) rest as potential support. Also note, the 50-day SMA appears poised to cross above the 200-day SMA, generally viewed as a bullish indicator (a Golden Cross).
Areas of consideration:
Quasimodo resistance on the H4 timeframe at 109.82 is likely of interest today. Knowing it boasts a strong connection to weekly resistances, it could produce a sizable move. However, entering short from here entails going against the immediate uptrend. Therefore, traders may opt to wait for additional candlestick confirmation to form before pulling the trigger (entry/risk levels can be set according to this pattern).
USD/CAD:
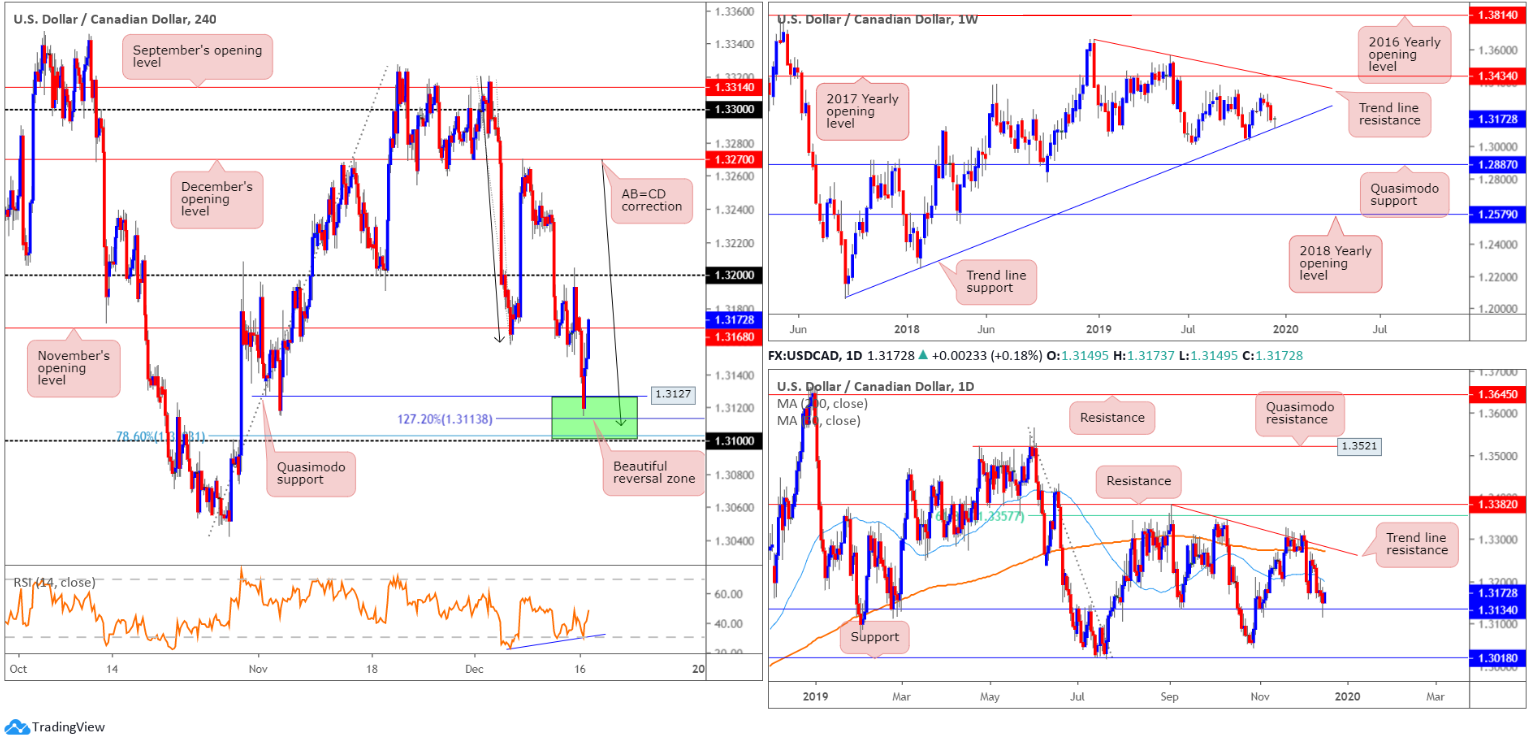
For traders who read Monday’s technical briefing you may recall the piece highlighted 1.31/1.3127 as a potential reversal zone on the H4 timeframe. Comprised of the 1.31 handle, a 127.2% Fibonacci extension at 1.3113, a 78.6% Fibonacci retracement ratio at 1.3103 and a symmetrical AB=CD bullish pattern at 1.3109 (black arrows), this area held ground and forced a move higher in recent trade.
What was also interesting about 1.31/1.3127 was its connection to the higher timeframes. As evident from the weekly timeframe, trend line support, extended from the low, intersected with the H4 base. Additionally, daily price found support a few points north of the H4 area at 1.3134. The cherry on top of the cake here, however, was RSI confirmation: bullish divergence (blue line).
Areas of consideration:
Well done to any readers who managed a long from 1.31/1.3127. The initial upside objective, November’s opening level 1.3168, was recently hit. The next port of call beyond here is the 1.32 handle, which coincides with the 50-day SMA (blue).
USD/CHF:
The US dollar concluded Monday a shade lower against the Swiss franc, though technical structure remains unchanged.
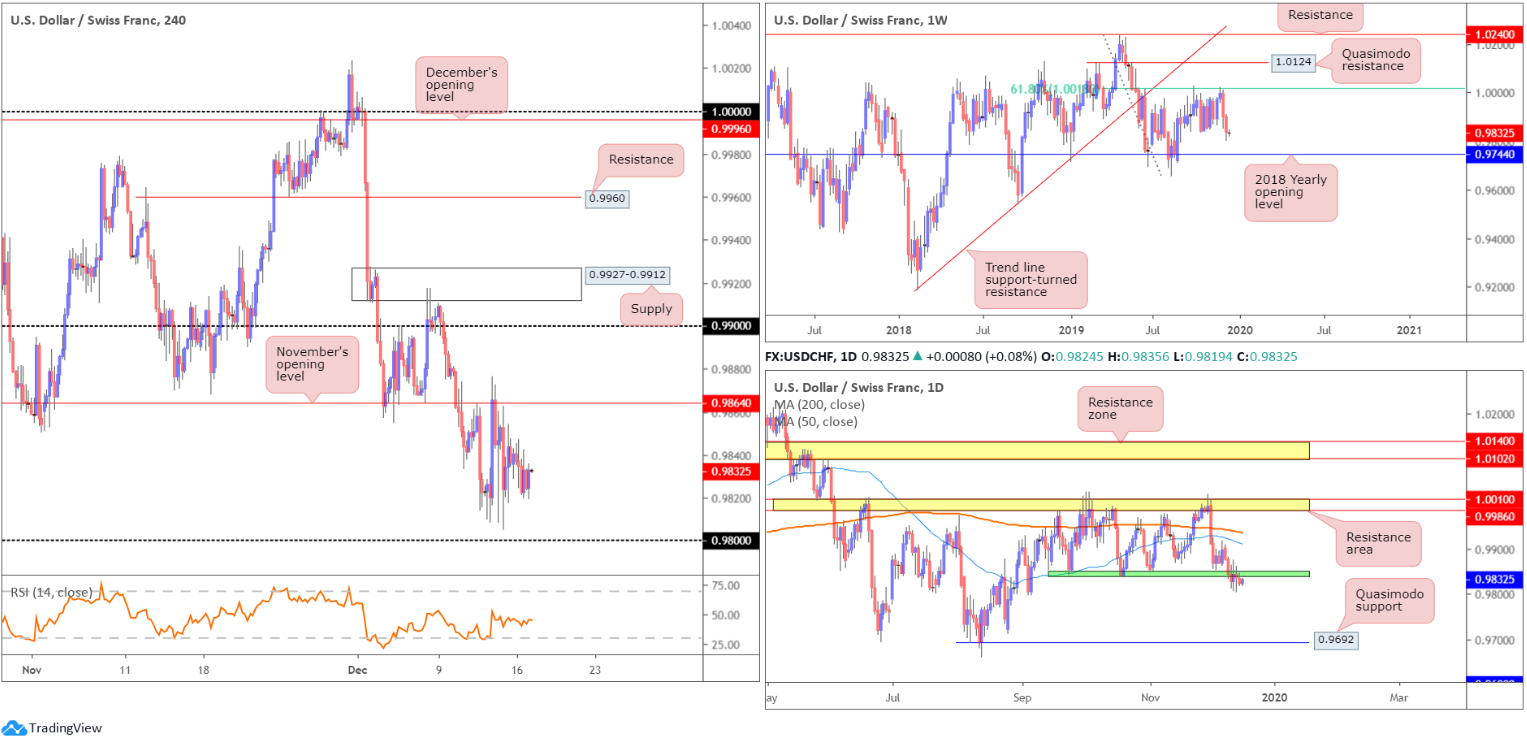
Weekly price remains capped by a 61.8% Fibonacci retracement ratio at 1.0018. Of late, two decisive bearish candles formed, testing lows of 0.9805. Equally impressive is the 2018 yearly opening level at 0.9744. Capping downside since the beginning of the year, this level is considered the next support target on the weekly scale. According to the primary trend, price reflects a slightly bullish tone.
In conjunction with weekly flow, the lower edge of a 3-month consolidation at 0.9845ish gave way last week. 0.9744 is the primary downside target on the weekly timeframe, while on the daily timeframe, Quasimodo support coming in at 0.9692 appears a valid target.
November’s opening level at 0.9864 remains notable resistance on the H4 timeframe, withstanding multiple upside attempts over the course of last week. With 0.99 left unchallenged, 0.9864 is likely to continue to offer resistance this week. In terms of confluence, locally there is little on offer from 0.9864. However, knowing both weekly and daily timeframes suggest further selling could be in store this week, a sell from this angle remains a worthy contender.
Areas of consideration:
Simply, keep eyes on 0.9864 for signs of seller intent. This could be in the form of a bearish candlestick pattern, a shooting star form, for example. An alternative is to drill down to the lower timeframes and attempt to enter based on local structure, such as a trend line break.
Irrespective of the entry technique, the 0.99 handle is set as the next downside support target in this market.
Dow Jones Industrial Average:
Major US equity indexes wrapped higher across the board Monday amid an upbeat tone tied to a preliminary US/China trade deal struck last week. The Dow Jones Industrial Average added 100.51 points, or 0.36%, the S&P 500 advanced 22.65 points, or 0.71% and the tech-heavy Nasdaq 100 added 82.63 points, or 0.97%.
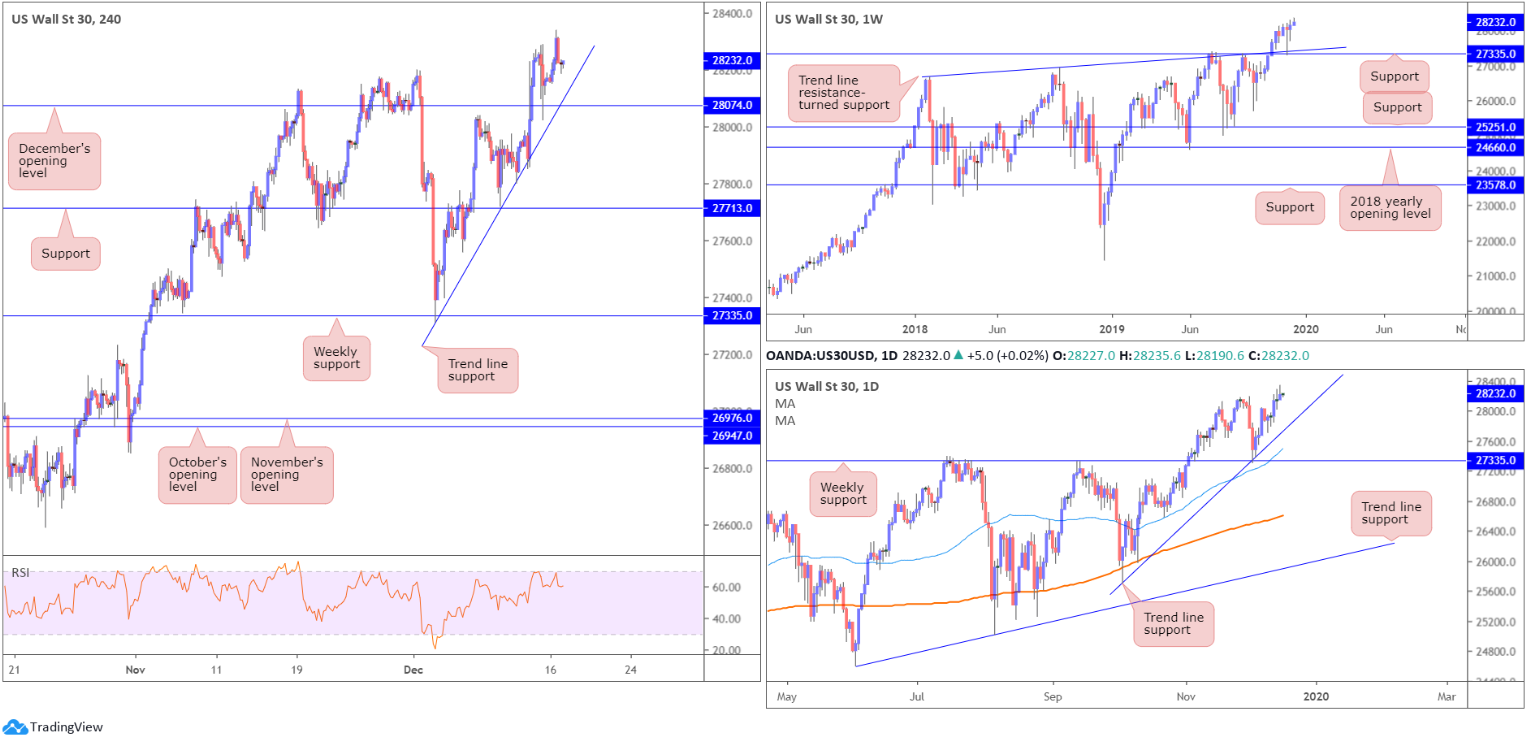
The DJIA notched record highs of 28339 Monday, though pulled back into US trade. H4 trend line support, extended from the low 27314, remains close by, with a break exposing December’s opening level at 28074. It might also interest some traders that the relative strength index (RSI) recently struck the 70.00 overbought value and turned lower.
Weekly price continues to trade north of support drawn from 27335, along with trend line support etched from the high 26670. This follows a strong weekly hammer candlestick formation (considered a buy signal at troughs), formed the week prior. Meanwhile, on the daily timeframe, trend line support, extended from the low 25710, could offer the market a floor this week. A break lower, nonetheless, may draw in the 50-day SMA (blue – 26481) and then weekly support mentioned above at 27335.
Areas of consideration:
The fact we’re trading at record peaks, and entrenched within a monstrous uptrend, this clearly remains a buyers’ market right now. H4 trend line support highlighted above could very well hold price action higher today/this week, though given the close proximity of December’s opening level at 28074 threatening a possible fakeout, traders will likely wait for additional candlestick confirmation before committing to a position.
XAU/USD (GOLD):
XAU/USD spot price lacked direction Monday, confined to a narrow range between 1479.9/1473.3.
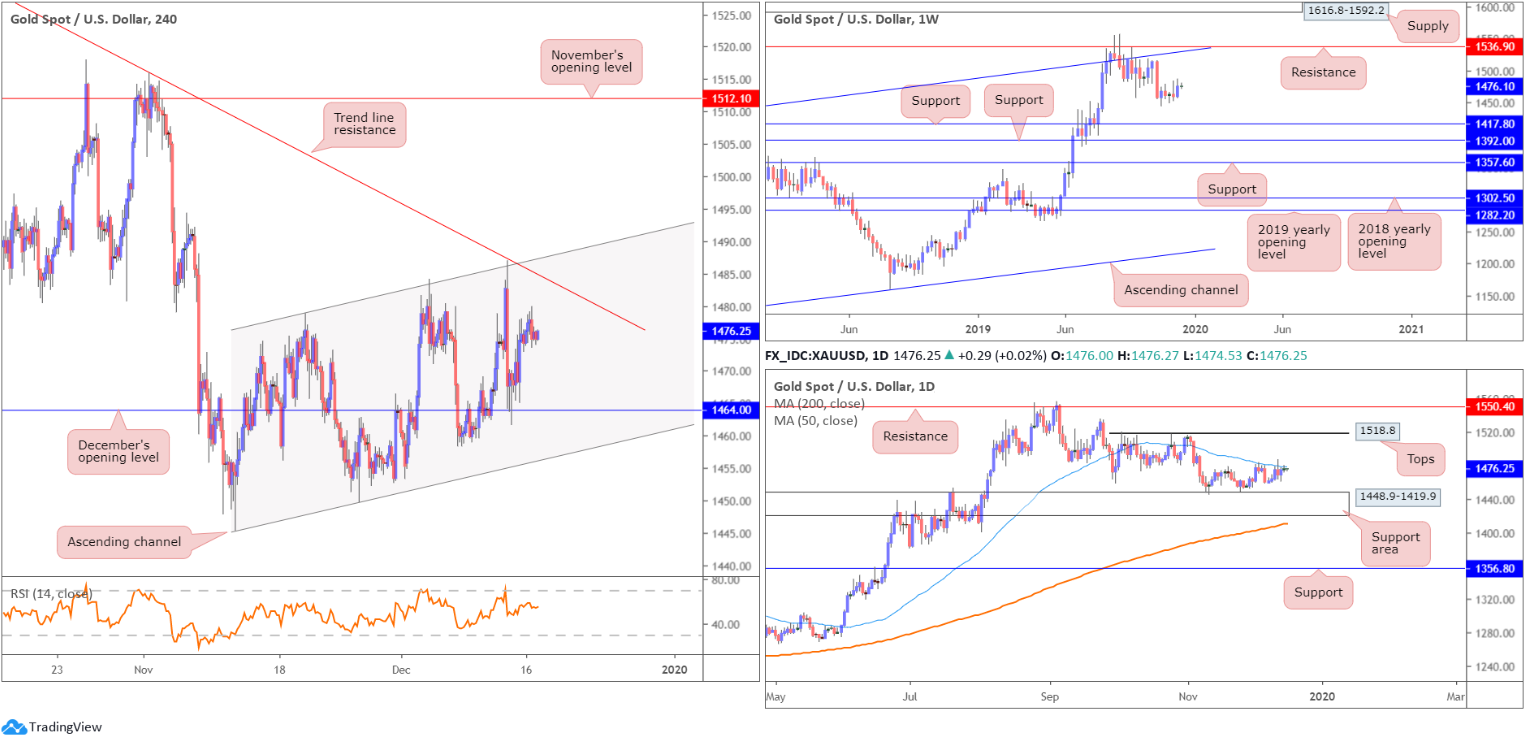
Following a near-to-the-point test of H4 channel resistance, taken from the high 1478.8, gold retested December’s opening level at 1464.4 and held north of here into the weekly close.
On more of a broader perspective, since connecting with resistance at 1536.9 and channel resistance, extended from the high 1375.1, weekly price has been in a mild decline. Further downside from here potentially sets the stage for a move towards two layers of support at 1392.0 and 1417.8. Overall, however, the primary trend has faced a northerly trajectory since bottoming in early December 2015.
The 50-day SMA (blue – 1478.2) continues to offer resistance on the daily timeframe, hampering upside from the support area coming in at 1448.9-1419.9. A break through the current SMA could lead to an attack at tops around 1518.8, closely followed by resistance at 1550.4. Traders may also benefit in noting the 200-day SMA (orange – 1411.1) is seen crawling north just beneath the aforementioned support zone.
Areas of consideration:
As daily price remains capped beneath the 50-day SMA, additional short entries at the current H4 trend line resistance may be an option. However, with limited confluence in view, aside from the 50-day SMA, traders are urged to consider confirmed entries, candlestick confirmation, for example.
The accuracy, completeness and timeliness of the information contained on this site cannot be guaranteed. IC Markets does not warranty, guarantee or make any representations, or assume any liability regarding financial results based on the use of the information in the site.
News, views, opinions, recommendations and other information obtained from sources outside of www.icmarkets.com.au, used in this site are believed to be reliable, but we cannot guarantee their accuracy or completeness. All such information is subject to change at any time without notice. IC Markets assumes no responsibility for the content of any linked site.
The fact that such links may exist does not indicate approval or endorsement of any material contained on any linked site. IC Markets is not liable for any harm caused by the transmission, through accessing the services or information on this site, of a computer virus, or other computer code or programming device that might be used to access, delete, damage, disable, disrupt or otherwise impede in any manner, the operation of the site or of any user’s software, hardware, data or property.


