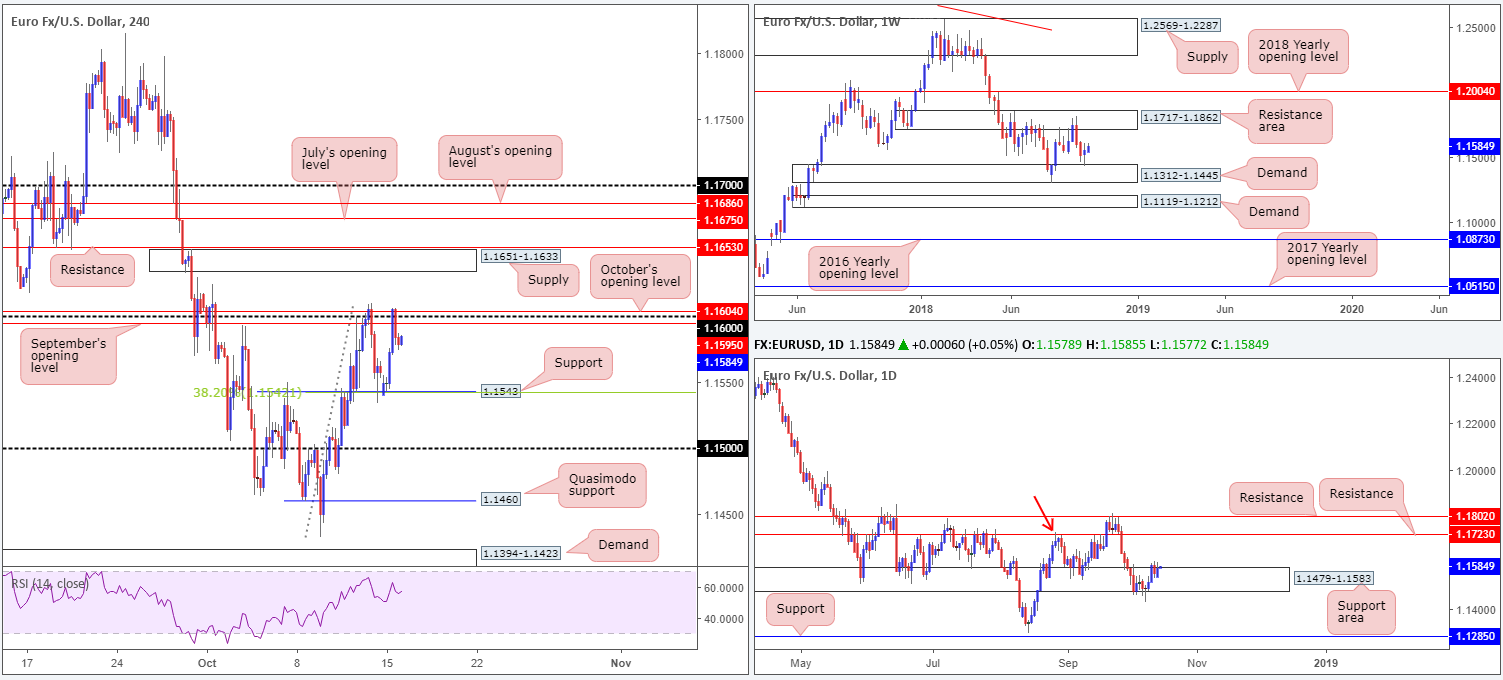
EUR/USD:
Benefitting from broad-based USD weakness and a lower-than-expected US retail sales print, the shared currency travelled higher ground on Monday. H4 support at 1.1543 (unites with a 38.2% Fib support), as you can see, offered the pair a floor in the early hours, lifting price towards its 1.16 mark and surrounding monthly opening levels from October and September at 1.1604 and 1.1595, respectively. Well done to any of our readers who managed to take advantage of this move as this was a noted level of support to keep an eye on in Monday’s briefing.
According to our technical studies, 1.16 is likely brittle as both the weekly and daily charts suggest further gains are on the horizon.
Weekly demand at 1.1312-1.1445 was nudged into the spotlight last week after a two-week bearish stint out of a neighbouring resistance area at 1.1717-1.1862. This is now considered a ranging market on this scale.
The daily support area at 1.1479-1.1583, although suffering a sizable breach to its lower edge in the early stages of last week in the shape of a bullish-pin-bar formation, remains in the fold. Bringing with it a notable history dating back as far as October 2017, the next upside target on this scale can be seen at resistance drawn from 1.1723 (sited within the walls of the noted weekly resistance area, as well as representing a nearby Quasimodo resistance based on the high marked with a red arrow at 1.1733).
Areas of consideration:
While higher-timeframe structure emphasizes a bullish tone right now, space to maneuver beyond 1.16 on the H4 timeframe is limited. Supply at 1.1651-1.1633, shadowed closely by resistance marked at 1.1653, could hinder buying from an intraday perspective. These areas are closely trailed by two monthly opening levels from August and July at 1.1686 and 1.1675, respectively.
Should traders avoid executing long positions above 1.16? Absolutely not! Higher-timeframe direction is on our side. Just ensure risk/reward parameters are kept in mind as there’s little over 30 pips of room to play with between 1.16 and the lower edge of H4 supply at 1.1651-1.1633.
Today’s data points: FOMC member Daly speaks; Treasury currency report.
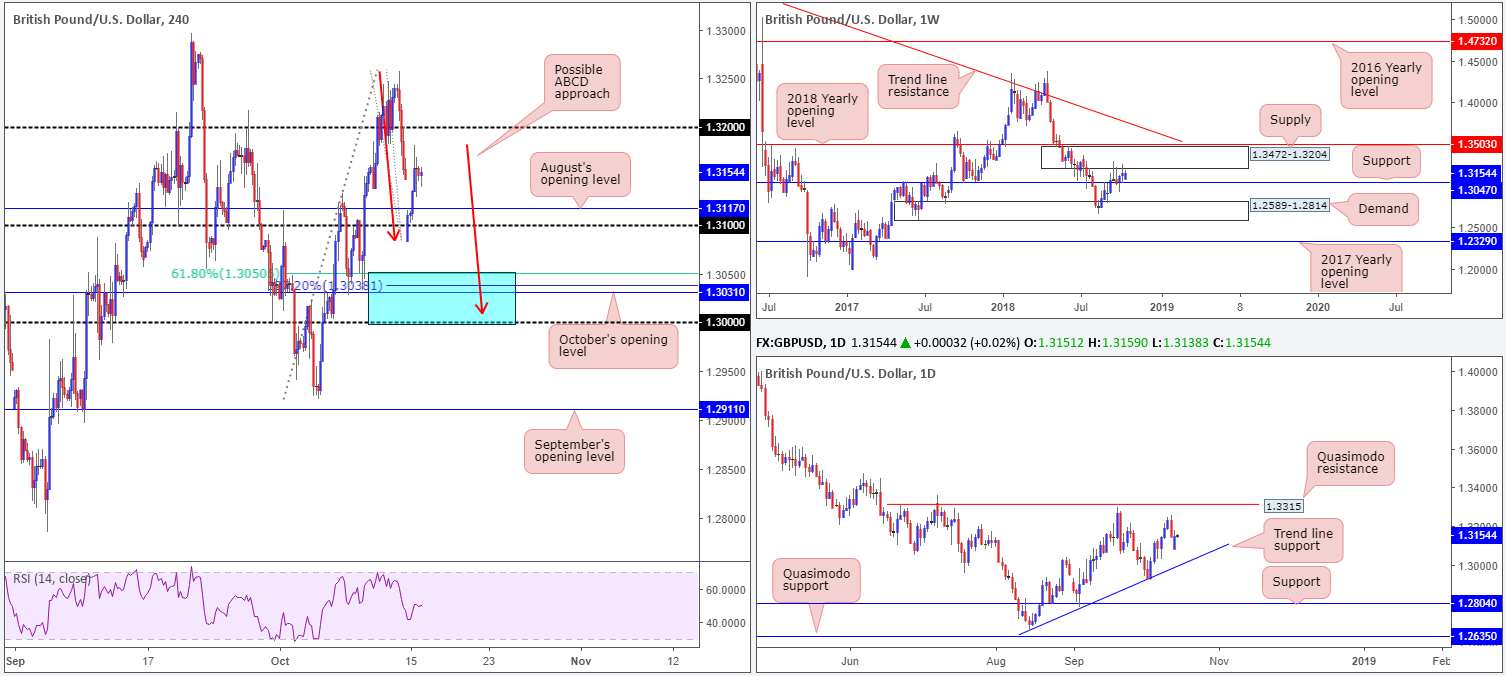
GBP/USD:
The British pound opened markedly lower against its US counterpart on Monday, amid news indicating limited progress was made during weekend (Brexit) talks. Although price shook hands with lows of 1.3082, the market witnessed a reasonably strong recovery take place throughout London’s morning session, consequently filling the weekend gap and testing highs of 1.3181.
In terms of market structure, weekly action remains drifting between notable supply marked at 1.3472-1.3204 and support at 1.3047. Beyond these borders, the 2018 yearly opening level is visible at 1.3503, while to the downside proven demand rests at 1.2589-1.2814. A closer look at price action on the daily chart draws attention to a Quasimodo resistance at 1.3315 and an ascending trend line support (etched from the low 1.2661).
As for the H4 timeframe, the candles are seen lingering between 1.32 and 1.31 right now. A particularly stand out zone (blue) falls in around 1.30/1.3050 for possible long opportunities. Comprised of a key figure 1.30, October’s opening level at 1.3031, a potential ABCD approach (red arrows) with a completion point seen around the 127.2% Fib ext. point at 1.3038, and a 61.8% Fib support at 1.3050, this area is certainly one to watch. In addition to the H4 confluence, it might also be worth noting weekly support at 1.3047 fuses with the zone, as does the daily trend line support mentioned above (1.2661).
Areas of consideration:
Given its surrounding confluence from all three timeframes, the blue area marked on the H4 timeframe at 1.30/1.3050 is a base traders should have noted on their watchlists for a potential longs today/this week.
Should the pair continue to probe higher today, nevertheless, the 1.32 handle may be a level to watch for a move lower as it fuses nicely with the lower edge of weekly supply at 1.3204.
Both areas highlighted above are viable trading zones, according to the overall technical structure. For conservative traders wanting more confirmation, though, waiting for additional candlestick confirmation to form prior to pulling the trigger is an option. Not only will this provide entry/stop levels, it’ll also display buyer/seller intent.
Today’s data points: UK employment figures; MPC member Cunliffe speaks; FOMC member Daly speaks; Treasury currency report.
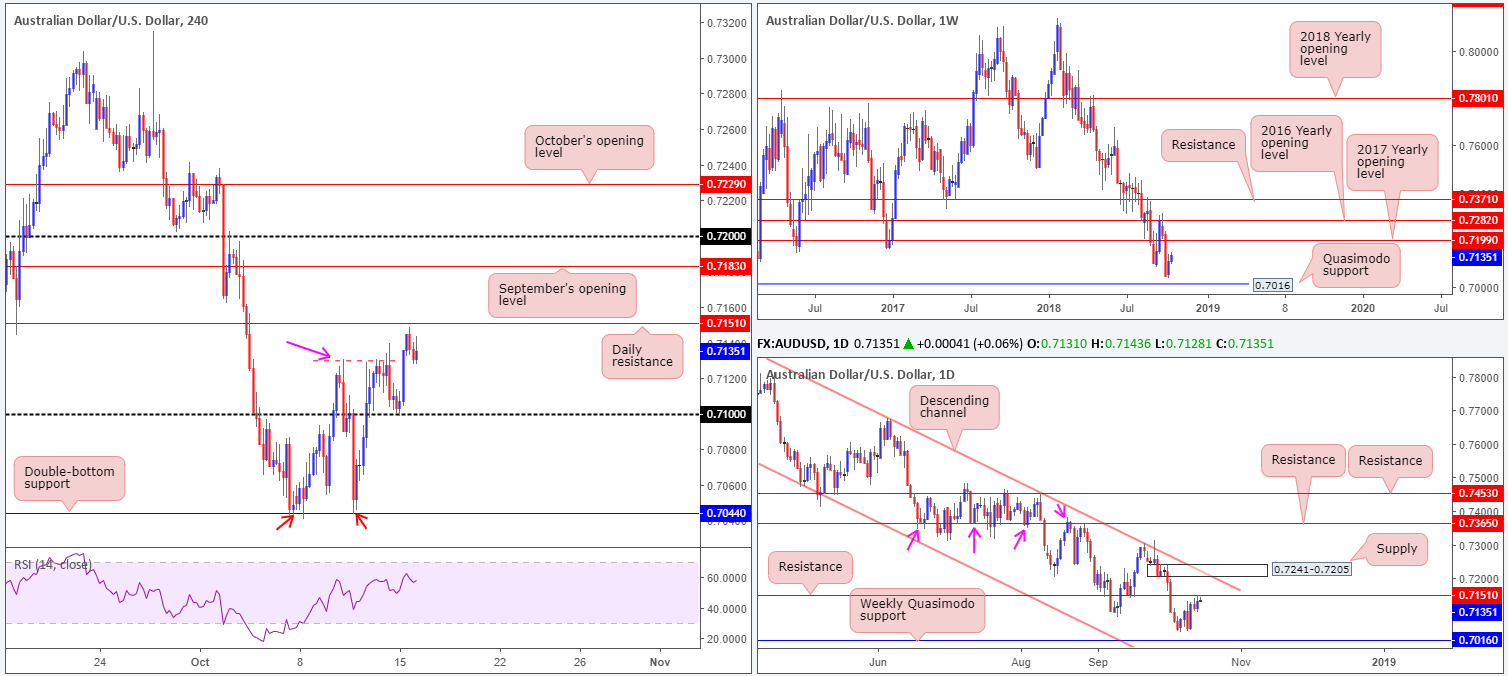
AUD/USD:
Cushioned by a rise in metal prices and a waning greenback, the commodity currency connected with its 0.71 handle on the H4 timeframe and advanced higher amid Monday’s trade. For those who read Monday’s briefing you may recall the team highlighted this number as a possible base for longs. Well done to any of our readers who boarded this train north!
Our rationale behind selecting 0.71 came down to H4 price pushing above Wednesday’s high at 0.7130 (pink arrow) on Friday. This confirmed the double-bottom support at 0.7044 (red arrows) and gave way to a possible retest of 0.71, targeting daily resistance at 0.7151, which, as you can see, came within striking distance of being achieved on Monday.
While weekly price displays room to press as far north as its 2017 yearly opening level at 0.7199, a bearish response is expected to be seen off the aforementioned daily resistance level. In the event we do eventually get beyond the daily base, though, supply is visible from 0.7241-0.7205, which happens to be positioned just above north of the 2017 yearly level on the weekly timeframe at 0.7199, and also ties in nicely with a long-term daily channel resistance (etched from the high 0.8135).
Areas of consideration:
For folks looking to buy this market, waiting for daily resistance at 0.7151 to be consumed beforehand (and preferably retested as support in the shape of a lower-timeframe bullish candlestick formation) is recommended. Beyond here, September’s opening level at 0.7183 on the H4 timeframe is seen, trailed closely by the 0.72 handle. Remember, 0.72 also denotes the lower edge of daily supply at 0.7205 and also merges with the 2017 yearly level on the weekly timeframe at 0.7199.
Today’s data points: AUD monetary policy meeting minutes; Chinese inflation figures; FOMC member Daly speaks; Treasury currency report.
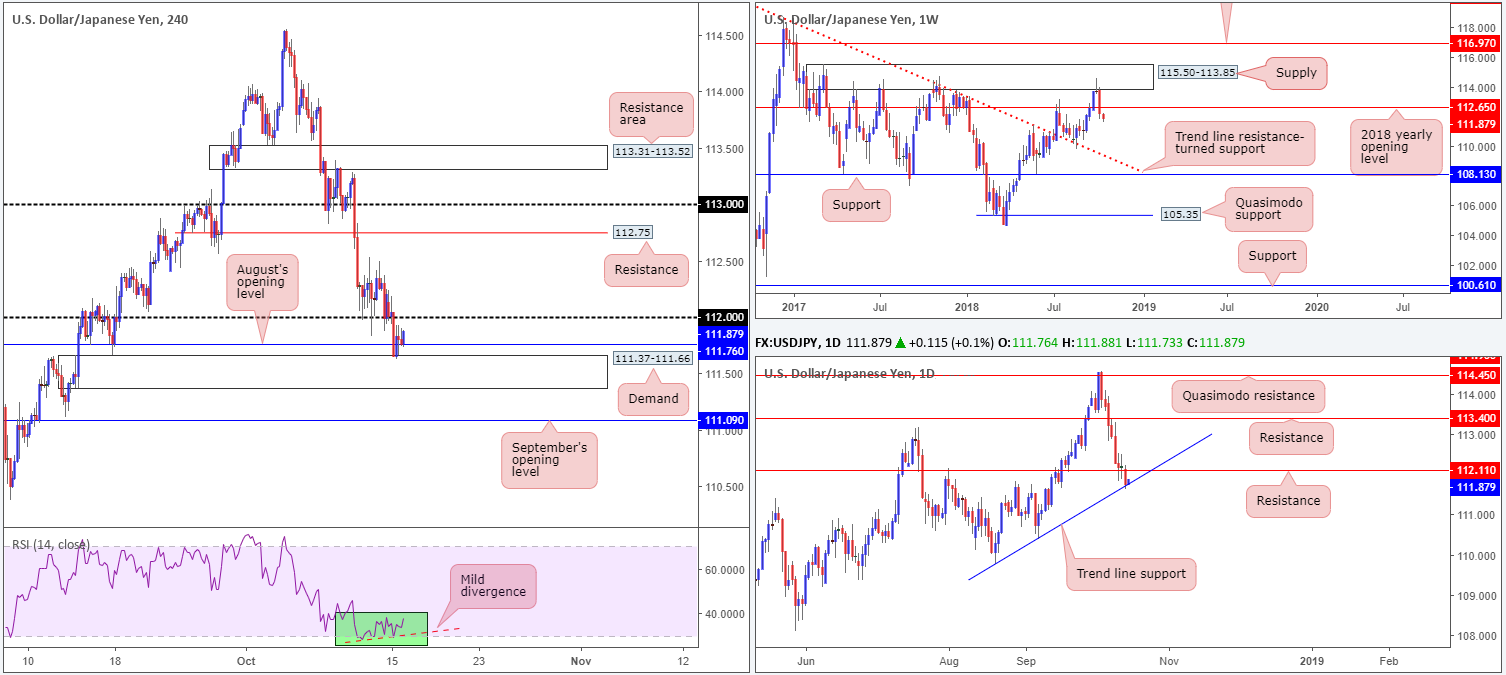
USD/JPY:
Across the board, the buck pressed for lower ground during Monday’s sessions, consequently weighing on the USD/JPY. The 112 handle plotted on the H4 timeframe was taken out in early European hours, giving way to a test of August’s opening level seen nearby at 111.76/demand at 111.37-111.66.
As of current price, the said demand is seen holding price action higher. This could have something to do with the fact daily price is also seen crossing swords with a trend line support (etched from the low 109.77).
Contrary to this, however, weekly movement appears poised to press lower. Following last week’s close beneath its 2018 yearly opening level at 112.65, this potentially set the stage for further selling this week in the direction of trend line resistance-turned support (extended from the high 123.57).
Areas of consideration:
Technically speaking, we feel the sellers have the upper hand here. Not only do we have weekly price threatening lower prices, we can also see just north of the current H4 demand there’s resistance in the form of a round number at 112 that could hinder upside movement, as could daily support-recently turned resistance at 112.11. For that reason, without a decisive H4 close forming above 112, buying this market is incredibly chancy.
A H4 close above 112 that’s supported with a retest in the shape of a bullish candlestick formation is likely sufficient enough to condone a long position in this market, targeting the underside of the recently broken 2018 yearly opening level at 112.65/H4 resistance at 112.75.
In terms of selling opportunities, traders are likely looking for a daily close to form beneath the current daily trend line support before engaging with the market.
Today’s data points: FOMC member Daly speaks; Treasury currency report.
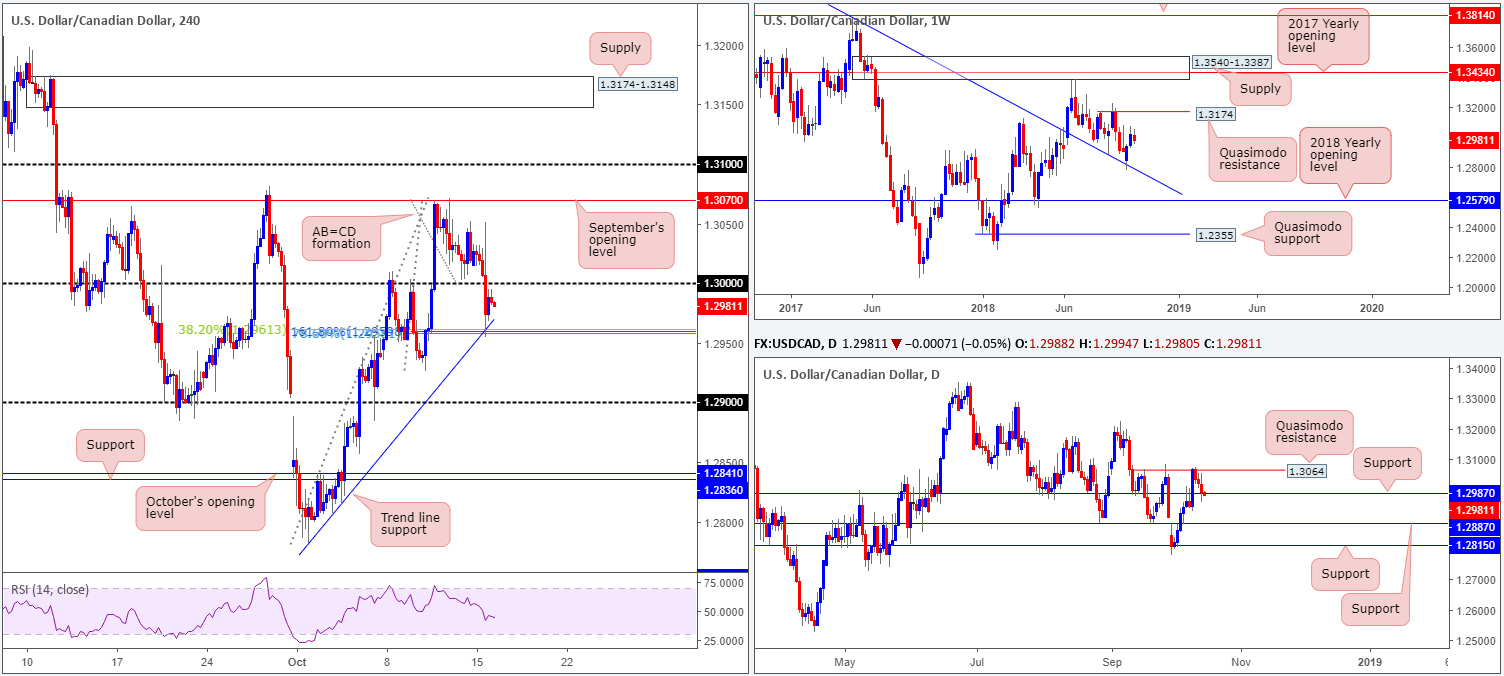
USD/CAD:
The US dollar ceded ground to its Canadian counterpart on Monday, after peaking at highs of 1.3051. Triggered by the Bank of Canada Business Outlook survey, the USD/CAD claimed its key figure 1.30 to the downside. Support, however, emerged from 1.2960 during US hours: a collection of H4 Fibonacci supports alongside a H4 trend line support (extended from the low 1.2782), which happens to be bolstered by a nearby daily support located at 1.2987. Continued buying from the daily support has a daily Quasimodo resistance at 1.3064 to target, while upside on the H4 scale is likely to be hindered by 1.30.
Despite recent action, the tone on the weekly timeframe remains bullish. Last week shows the USD/CAD extended its bounce from trend line resistance-turned support (stretched from the high 1.4689). Having seen the market respond to this barrier in August, and also act as firm resistance from its peak on a number of occasions in the past, the advance should not come as much of a surprise. The next upside target to be aware of, assuming further upside is seen, falls in around a Quasimodo resistance level parked at 1.3174.
Areas of consideration:
Trading in between 1.30 and 1.2960ish on the H4 scale is not a setup traders will likely label high probability.
A break of 1.30 to the upside has the daily Quasimodo resistance at 1.3064, followed by September’s opening level at 1.3070 on the H4, in view, whereas a break of 1.2960 eyes the 1.29 handle, trailed closely by daily support plotted at 1.2887.
A H4 close beyond either 1.30 or 1.2960, alongside a retest in the shape of a H4 candlestick configuration would likely be considered a valid signal, targeting 1.3064 or 1.29, respectively.
Today’s data points: FOMC member Daly speaks; Treasury currency report; CAD foreign securities purchases.
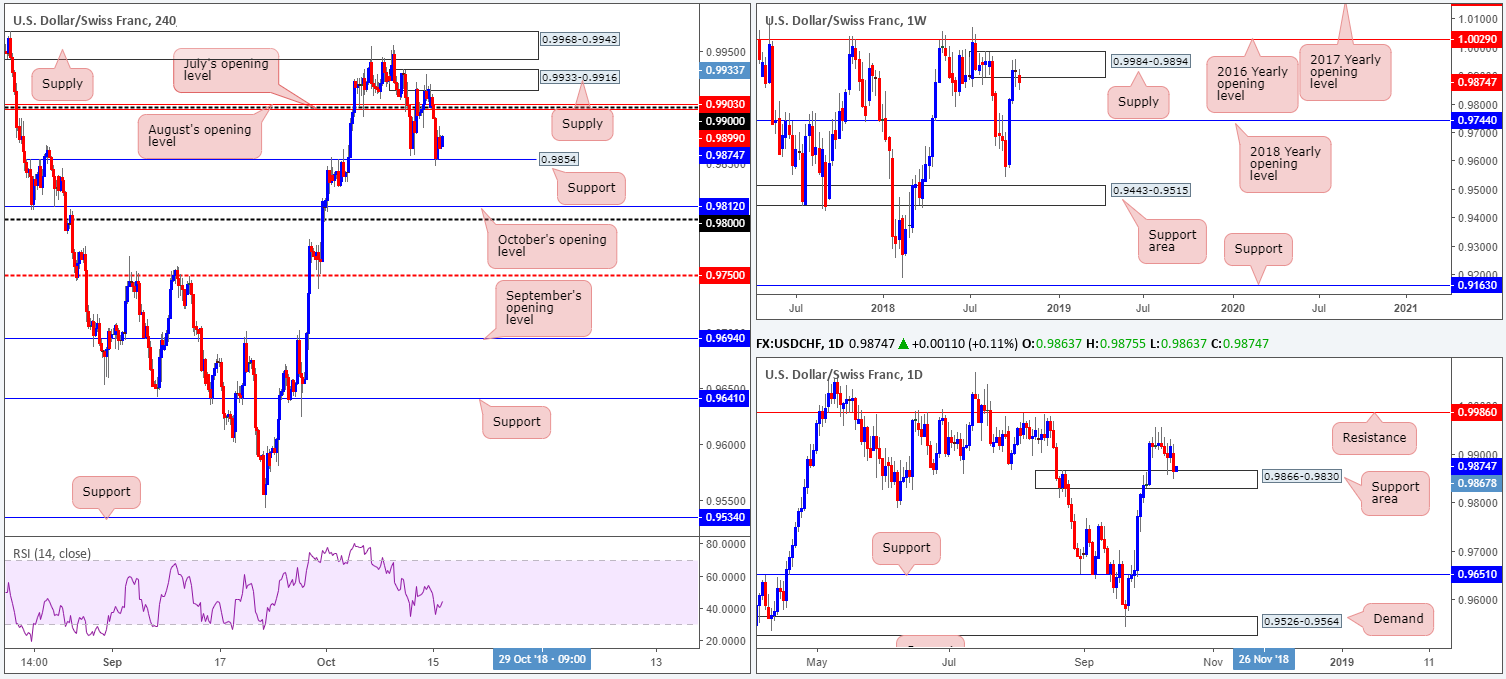
USD/CHF:
Broad-based USD weakness, as you can see, tugged the USD/CHF lower amid trade on Monday. Responding from H4 supply at 0.9933-0.9916, the couple firmly overthrew the 0.99 handle and concluded the day challenging H4 support penciled in at 0.9854. Traders may also want to acknowledge the said H4 support is seen located within the upper limit of a daily support area at 0.9866-0.9830, which already attempted to hold price higher on Thursday.
Against the backdrop of H4 and daily structure, weekly supply at 0.9984-0.9894 remains in the fight. Additional selling out of this zone could see the market decline as far south as its 2018 yearly opening level at 0.9744. Traders may also wish to pencil in the 2016 yearly opening level at 1.0029 in the event we push for higher ground this week.
Areas of consideration:
Based on the above reading, neither a long nor shorts seems attractive at this point.
Irrespective of the direction one selects today, opposing structure is clearly seen.
Should traders initiate a buy from the current H4 support, they’re effectively buying alongside daily flow, though at the same time entering long into weekly selling!
The same goes for selling. A short places one alongside weekly flow, but against daily/H4 buying.
Today’s data points: FOMC member Daly speaks; Treasury currency report.
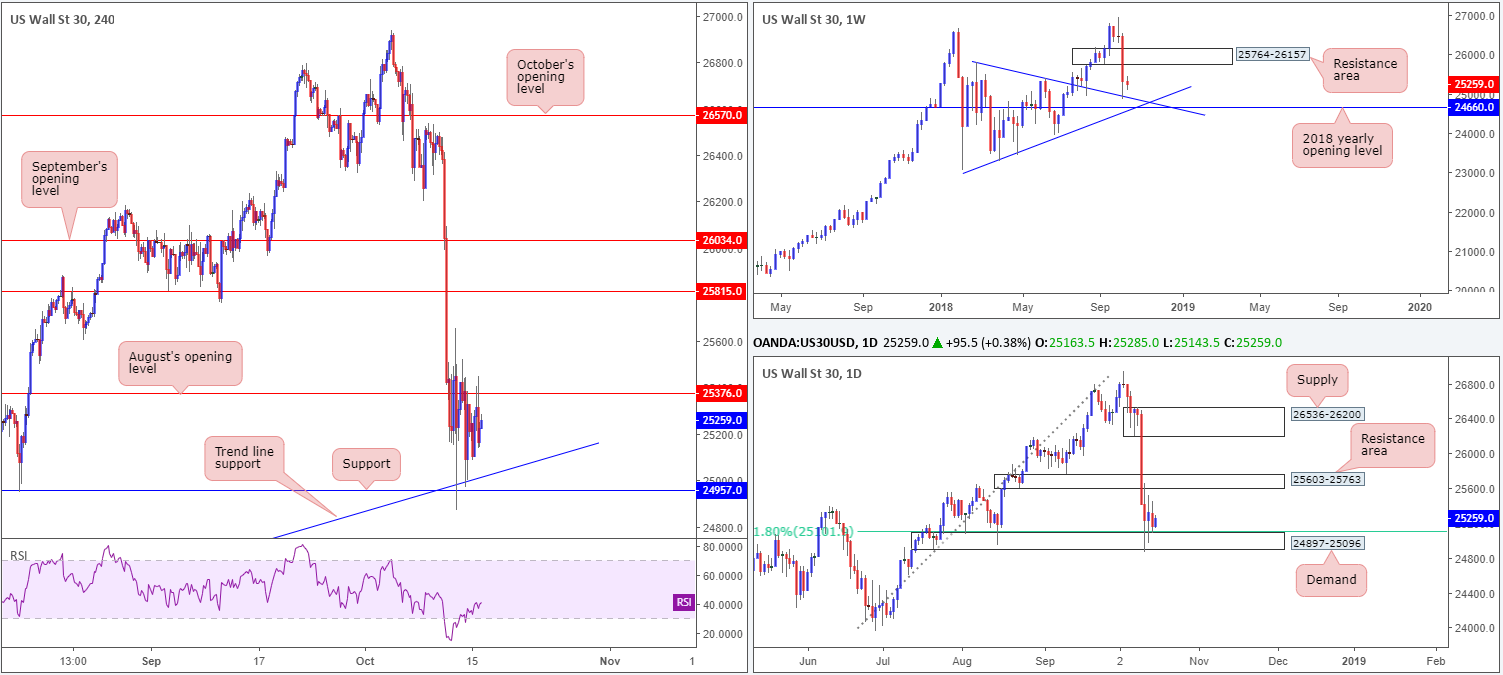
Dow Jones Industrial Average:
Following last week’s precipitous decline, the Dow jones is currently seen caught between August’s opening level at 25376 on the H4 timeframe and H4 support notched in at 24957/H4 trend line support (extended from the low 23451).
Over the course of last week, weekly price saw the index demolish demand at 25764-26157 (now an acting resistance area), and end the week shaking hands with a trend line resistance-turned support (taken from the high 25807), which hovers just north of the 2018 yearly opening level at 24660.
A closer look at the action on the daily timeframe brings in demand at 24897-25096 and its nearby 61.8% Fib support at 25101. Although demand suffered a minor breach, the area remains in play with an upside objective located at 25603-25763: a resistance area.
Areas of consideration:
From a technical perspective, a break of August’s opening level at 25376 remains on the radar. Should this come to fruition and the H4 candles retest 25376 as support in the shape of a bullish candlestick formation (stop/entry parameters should be based on this pattern), longs are high probability with an initial upside target priced in at 25603: the underside of the noted daily resistance area.
Today’s data points: FOMC member Daly speaks; Treasury currency report.
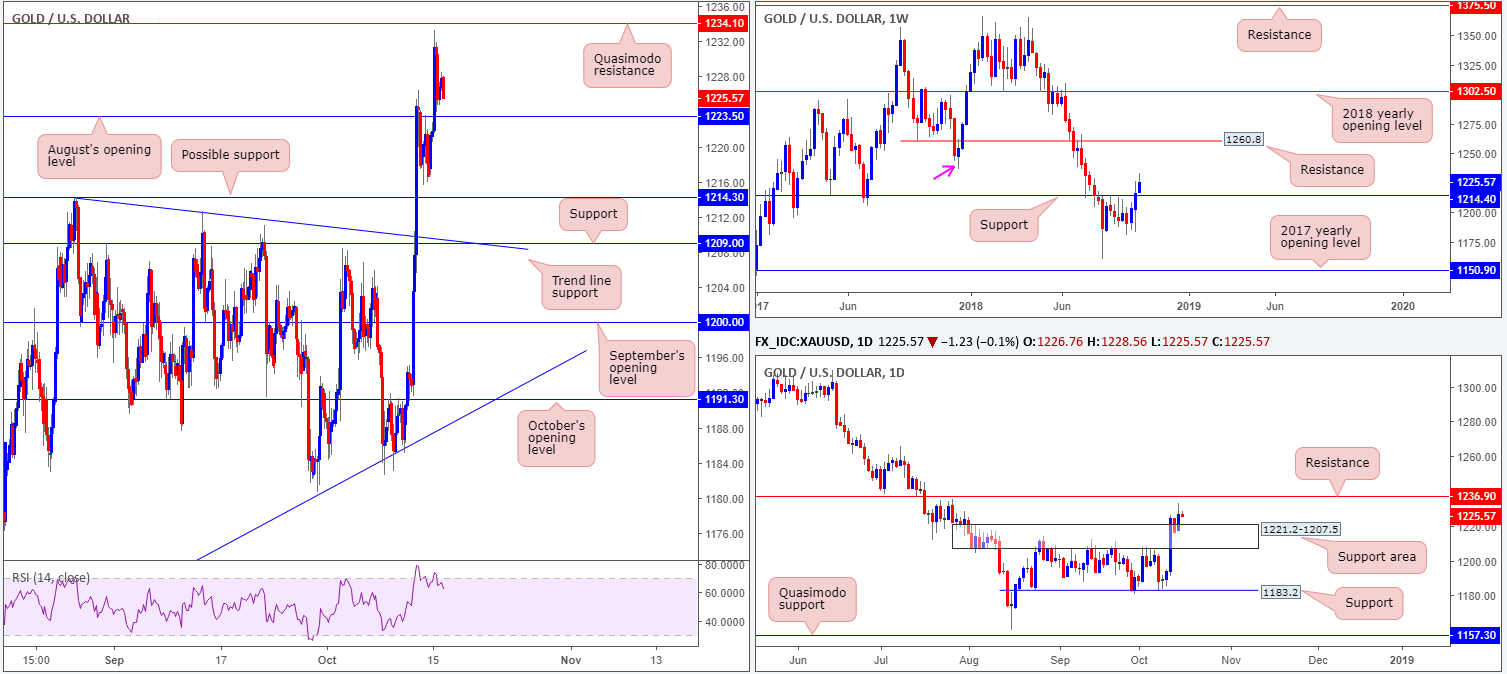
XAU/USD (Gold):
Surpassing the US dollar, the price of gold rose higher on Monday, demolishing August’s opening level at 1223.5 (now acting support) and reaching a peak of 1233.3 – just south of a H4 Quasimodo resistance level plotted at 1234.1.
In terms of where the market stands on the higher timeframes, an additional layer of resistance supporting the current H4 Quasimodo is seen nearby on the daily timeframe at 1236.9. We also see a daily support area at 1221.2-1207.5 positioned just beneath August’s opening level mentioned above at 1223.5.
Weekly movement, on the other hand, remains in positive territory after firmly overthrowing a key resistance level coming in at 1214.4 (now acting support). According to our reading, this has potentially fixed the stage for further upside this week. Swing resistance is evident at 1236.6 (pink arrow – essentially the same level as daily resistance mentioned above at 1236.9), though the majority of eyes on the weekly scale are likely honed in on resistance chiseled in at 1260.8.
Areas of consideration:
On the whole, further upside is favoured given where we’re positioned on the weekly timeframe at the moment. To that end, longs from August’s opening level on the H4 timeframe at 1223.5 is an option today, though do remain cognizant of the daily support area located beneath it at 1221.2-1207.5. Price could just as easily drive into the zone prior to turning higher! With that being said, traders are also urged to keep eyes on possible support emerging from 1214.3 (August 28 high), and also at 1209.0 (intersects with a trend line resistance-turned support taken from the high 1214.3).
Judging which support is worthy of a long is difficult as each is viable. To help decide, traders may want to consider waiting for H4 candle confirmation to take shape before pulling the trigger. Not only will this provide entry/stop parameters, it’ll also help display buyer intent.
The use of the site is agreement that the site is for informational and educational purposes only and does not constitute advice in any form in the furtherance of any trade or trading decisions.
The accuracy, completeness and timeliness of the information contained on this site cannot be guaranteed. IC Markets does not warranty, guarantee or make any representations, or assume any liability with regard to financial results based on the use of the information in the site.
News, views, opinions, recommendations and other information obtained from sources outside of www.icmarkets.com.au, used in this site are believed to be reliable, but we cannot guarantee their accuracy or completeness. All such information is subject to change at any time without notice. IC Markets assumes no responsibility for the content of any linked site. The fact that such links may exist does not indicate approval or endorsement of any material contained on any linked site.
IC Markets is not liable for any harm caused by the transmission, through accessing the services or information on this site, of a computer virus, or other computer code or programming device that might be used to access, delete, damage, disable, disrupt or otherwise impede in any manner, the operation of the site or of any user’s software, hardware, data or property.