
Key risk events today:
RBA Monetary Policy Meeting Minutes; UK Employment Data.
(Previous analysis as well as outside sources – italics).
EUR/USD:
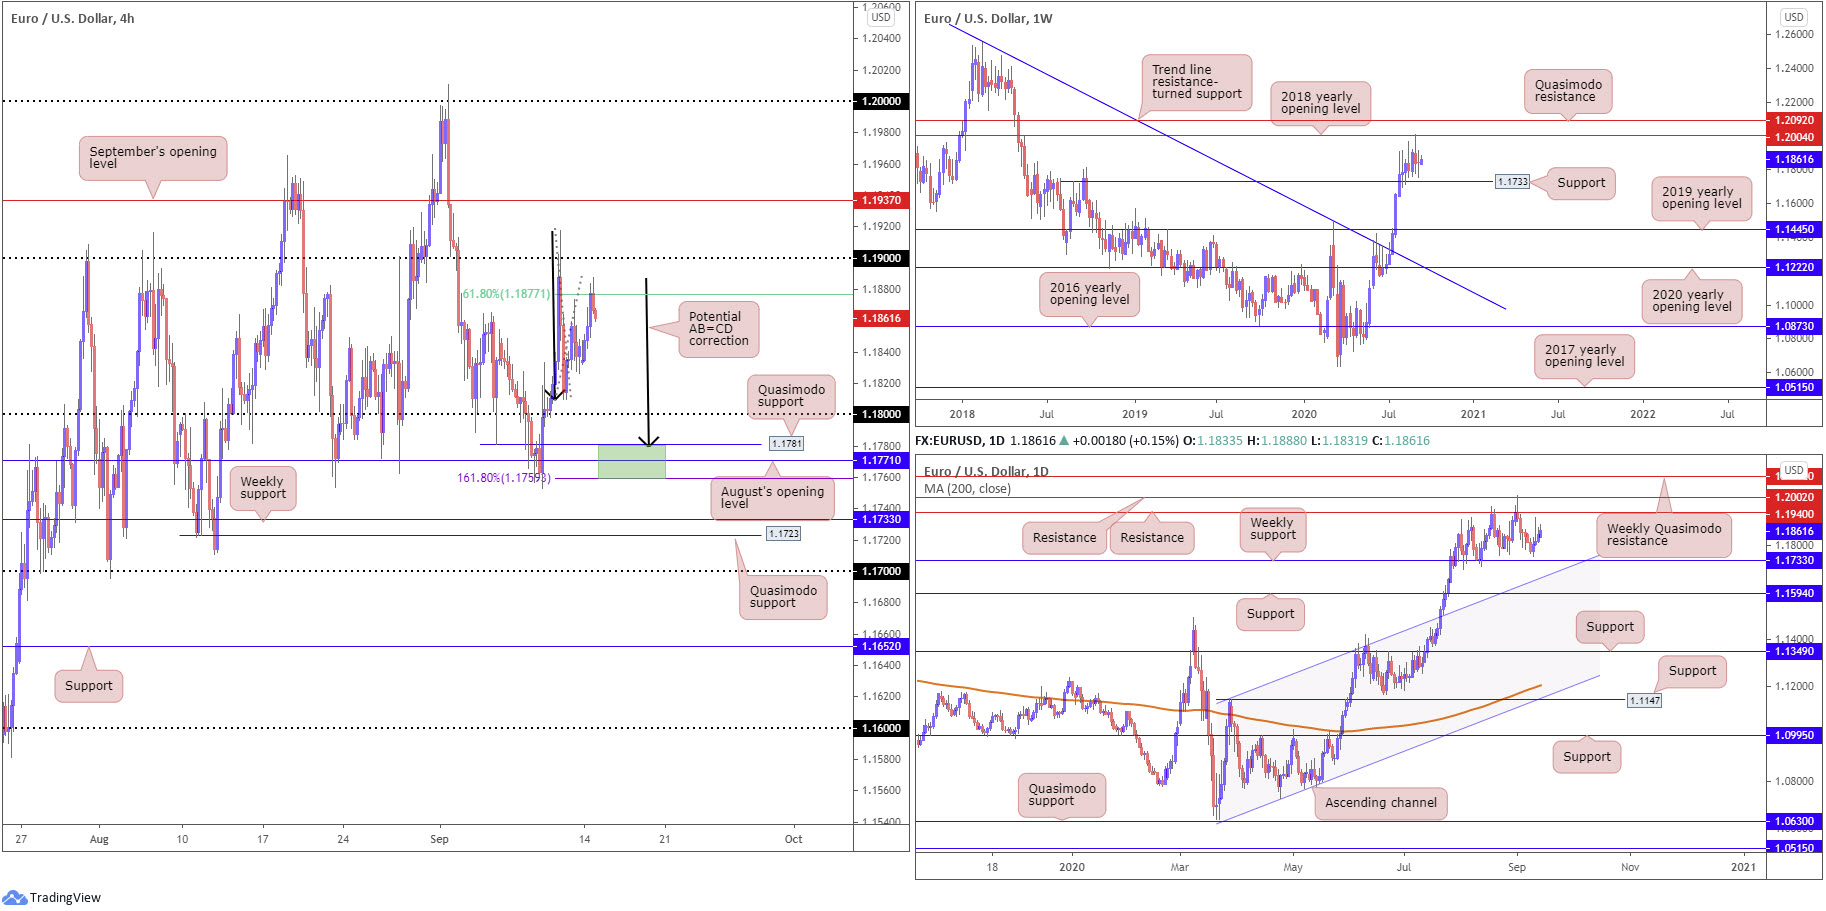
Technically, Monday is currently fading session peaks at 1.1888, aided by a 61.8% Fibonacci retracement ratio at 1.1877 based on the H4. Above 1.19, September’s opening value is seen at 1.1937; to the downside 1.18 invites an approach. Beyond 1.18, Quasimodo support at 1.1781 is visible, followed by August’s opening level at 1.1771. Additionally, an AB=CD bullish pattern is present between 1.1779 and 1.1759 (AB=CD [black arrows] structure/1.618 BC projection).
Breaking the aforementioned H4 supports shines the spotlight on weekly support at 1.1733, a previous Quasimodo resistance. Resistance on the weekly timeframe is found at 1.2004, the 2018 yearly opening value sited just south of Quasimodo resistance priced in at 1.2092. Also clear on the weekly scale is the month of July witnessed vigorous upside, movement that overthrew trend line resistance, taken from the high 1.2555, and the 2019 yearly opening value at 1.1445.
Since transitioning into the month of August on the daily timeframe, weekly support, mentioned above at 1.1733, has proved useful, as has daily resistance coming in at 1.1940 and 1.2002. Passing 1.2002 on the daily timeframe shifts focus to the weekly Quasimodo resistance mentioned above at 1.2092, whereas dipping sub 1.1733 on the daily scale could see price make its way to channel resistance-turned support, extended from the high 1.1147.
Areas of consideration:
- A fakeout through 1.18 into the noted 1.1759/1.1781 H4 support area could be in store. Tripping sell-stop liquidity under 1.18, and luring any fresh buyers off noted H4 supports, may be enough to generate a H4 close back above 1.18, creating a possible intraday buy signal.
- The same can be seen above 1.19 on the H4. Piercing 1.19 and testing September’s opening level at 1.1937 (tripping buy-stop liquidity above the round number) may force a H4 close back under 1.19 and promote a bearish scenario. Note September’s opening level forms a close connection with daily resistance at 1.1940.
GBP/USD:
Pound sterling emerged strong Monday, aided by a bout of short-covering and USD downside.
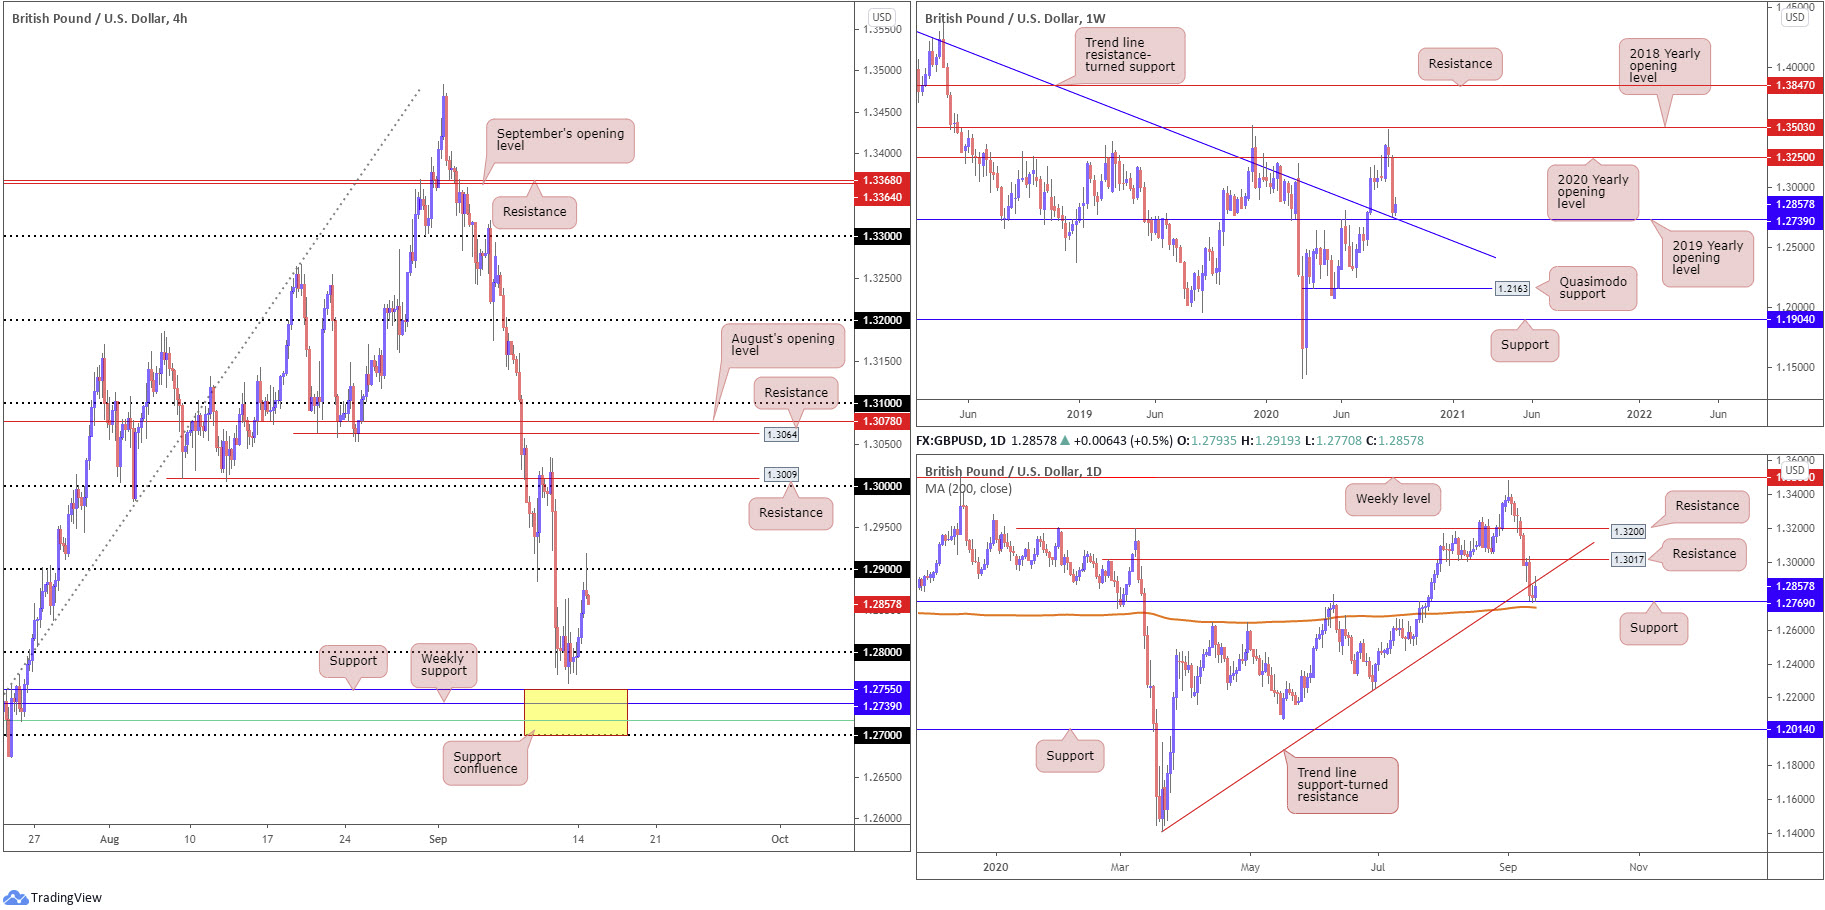
Leaving 1.27/1.2755 (yellow) unchallenged on the H4 (made up of 1.27, a 61.8% Fibonacci retracement ratio at 1.2718 [green], weekly support at 1.2739 and H4 support at 1.2755), fed by sell-stop liquidity under 1.28, GBP/USD bulls recently entered an offensive phase and shook hands with 1.29. Daily support drawn from 1.2769 likely aided recent upside, located just north of the 200-day SMA (orange – 1.2733).
Note H4 price action pencilled in a shooting star candlestick pattern (bearish signal) off 1.29, a level intersecting with daily trend line support-turned resistance, extended from the low 1.1409.
Penetrating current support on the daily timeframe immediately throws weekly support at 1.2739 (2019 yearly opening level) into the fray and associated weekly trend line support, currently connecting closely with the 200-day SMA. Moves to the upside on the daily scale, assuming we crank back above trend line resistance, points to resistance plotted at 1.3017.
Areas of consideration:
With the 1.27/1.2755 area (yellow) yet to be tested on the H4, suggesting weekly buyers are yet to join the party, the recent candle reaction off 1.29 on the H4 might be enough to tempt additional selling back to at least 1.28, closely shadowed by 1.27/1.2755 as a final support target for shorts.
Conservative traders watching 1.27/1.2755 as a possible reversal zone will likely want to observe a H4 close form back above 1.28 before committing, with daily trend line resistance set as the initial target.
AUD/USD:
The Australian dollar ended a shade higher against its US counterpart Monday, yet remained capped under 0.73 on the H4. In light of the lacklustre performance, much of the following will echo thoughts put forward in Monday’s technical briefing.
From the weekly timeframe:
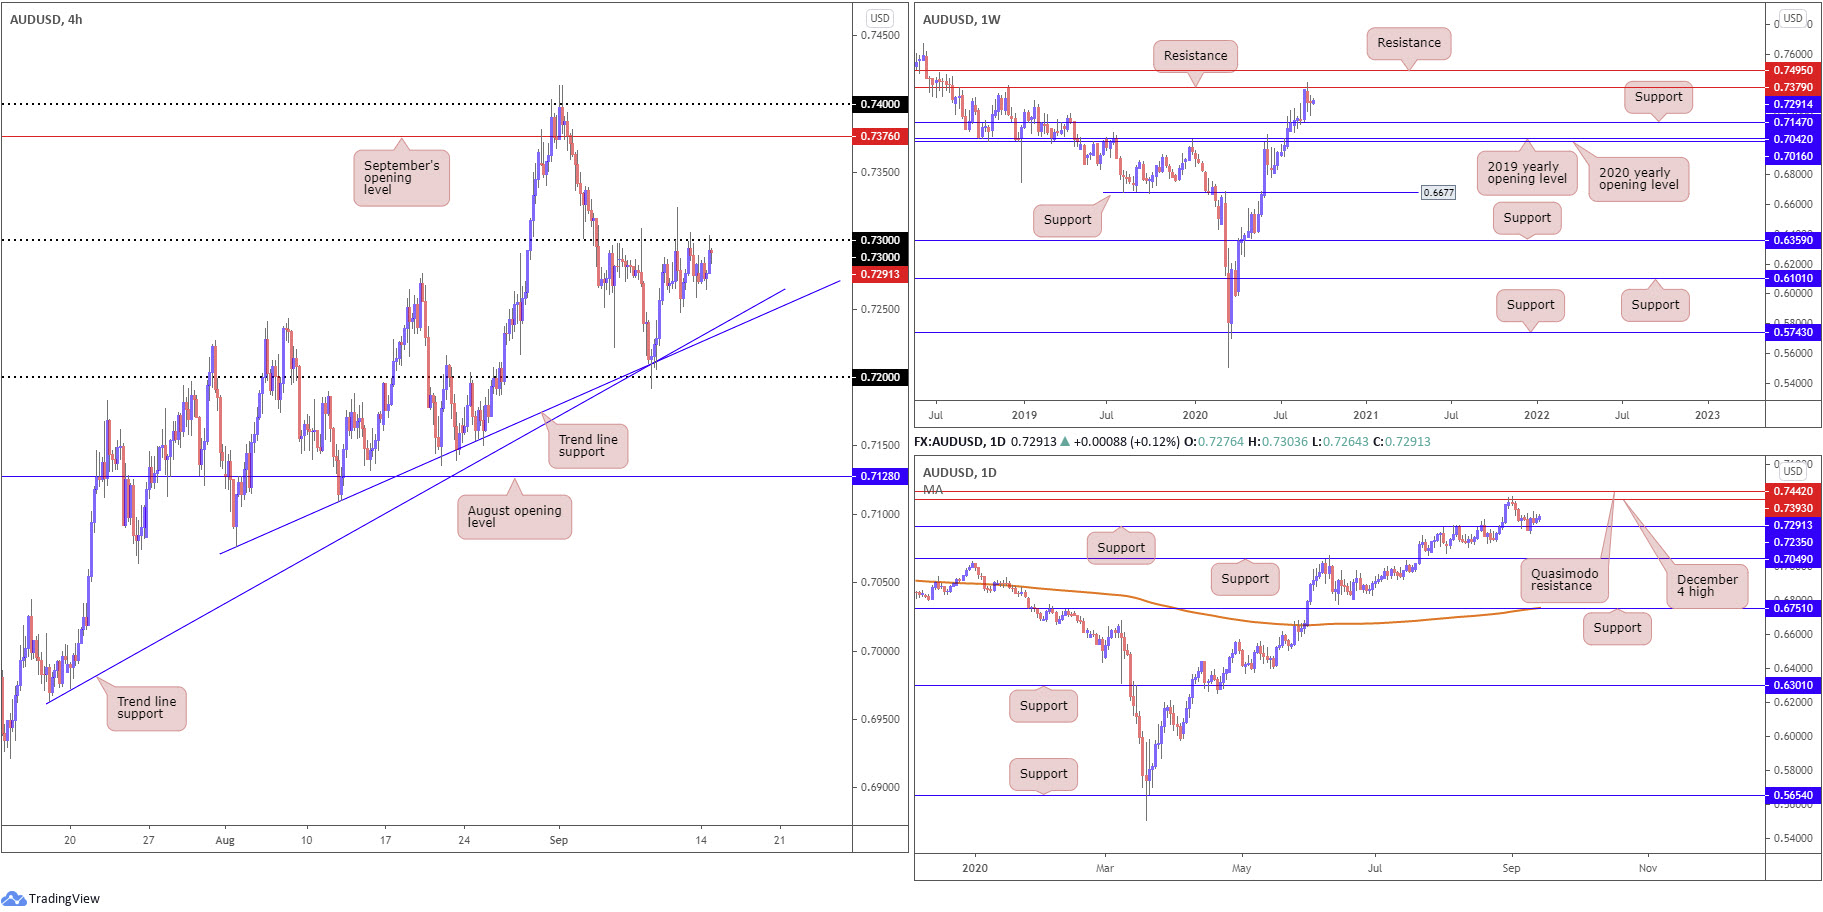
Sellers south of resistance at 0.7379 failed to sustain downside momentum past 0.7191 in recent trading, leaving nearby support from 0.7147 unchallenged.
Having seen this market trend higher since bottoming at 0.5506 in late March, the odds of price surging through current resistance and heading for another layer of resistance at 0.7495 are high. Exploring territory under current support, however, shines focus on the 2020 and 2019 yearly opening levels at 0.7016 and 0.7042, respectively.
From the daily timeframe:
Price has so far failed to glean much support from 0.7235. To the upside, resistance at 0.7393 (December 4 high) commands attention, a level that capped upside heading into September ahead of Quasimodo resistance at 0.7442. Overthrowing 0.7235 shifts focus to as far south as support at 0.7049.
From the H4 timeframe:
Following last Wednesday’s upbeat recovery from two trend line supports (0.7076/0.6963) and the 0.72 handle, 0.73 made its way back into view. A break above 0.73 could have bullish themes take over and approach September’s opening level at 0.7376. The latter, as aired in previous writing, is located close by weekly resistance at 0.7379 and daily resistance at 0.7393.
Areas of consideration:
Although 0.73 has proven a tough nut to crack, it appears sellers may be loosening their grip. In addition to Thursday’s spike to 0.7324 potentially filling the majority of sellers’ protective stop loss orders, the lack of downside pressure seen since informs observers buyers are likely taking control.
A H4 close above 0.73, therefore, might arouse breakout buyers; a retest at the round number following a close higher could also tempt conservative players to participate.
Irrespective of the entry technique, 0.74/0.7376 offers a logical upside target.
USD/JPY:
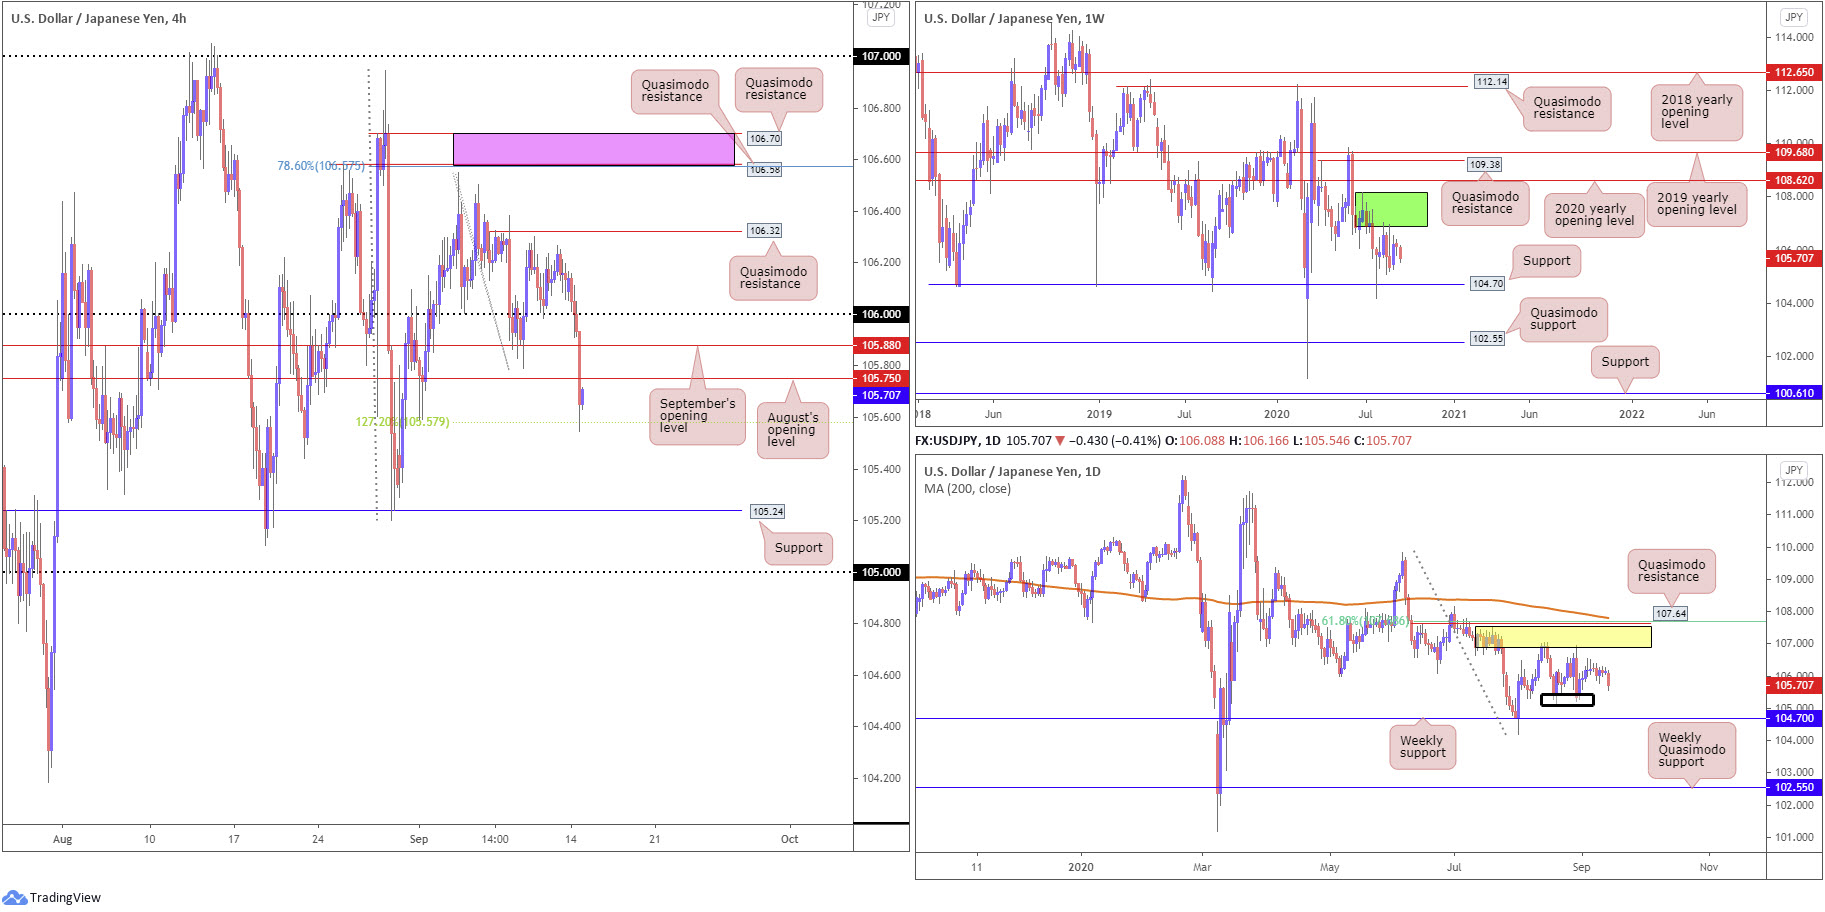
As the DXY tests sub 93.00 to the downside, USD/JPY made quick work of 106 on the H4 Monday, as well as September’s opening value at 105.88 and August’s opening value at 105.75. H4, as you can see, is currently finding some respite off a 127.2% Fibonacci extension point at 105.57, generating enough impetus to possibly force a 105.75 retest for continuation moves to support at 105.24 and the 105 handle.
Supply remains prominent at 108.16-106.88 (dark green) on the weekly timeframe, capping upside since price made its way off support at 104.70 at the end of July. Should buyers govern control, the 2020 yearly opening level at 108.62 may eventually enter view, closely tracked by Quasimodo resistance at 109.38 and the 2019 yearly opening level at 109.68.
Daily supply at 107.55/106.89 (yellow), an area housed within the lower boundary of weekly supply mentioned above at 108.16-106.88, has proved tough to overthrow. Downside from current price has lows at 105.20ish to target (black zone), with a break exposing weekly support underlined above at 104.70. In the event buyers climb, however, Quasimodo resistance is stationed at 107.64, reinforced by a 61.8% Fibonacci retracement ratio at 107.68 and 200-day SMA (orange – 107.80).
Areas of consideration:
Room seen to push lower on the higher timeframes might see bearish themes emerge from August’s opening value on the H4 at 105.75 today. Though do bear in mind a spike to September’s opening value at 105.88 could also take shape before sellers make an appearance.
Sellers from 105.88/105.57 are likely to consider reducing risk to breakeven upon crossing the 127.2% Fibonacci extension point at 105.57, with a downside target plotted at H4 support around 105.24 (essentially representing the daily lows highlighted above at 105.20).
USD/CAD:
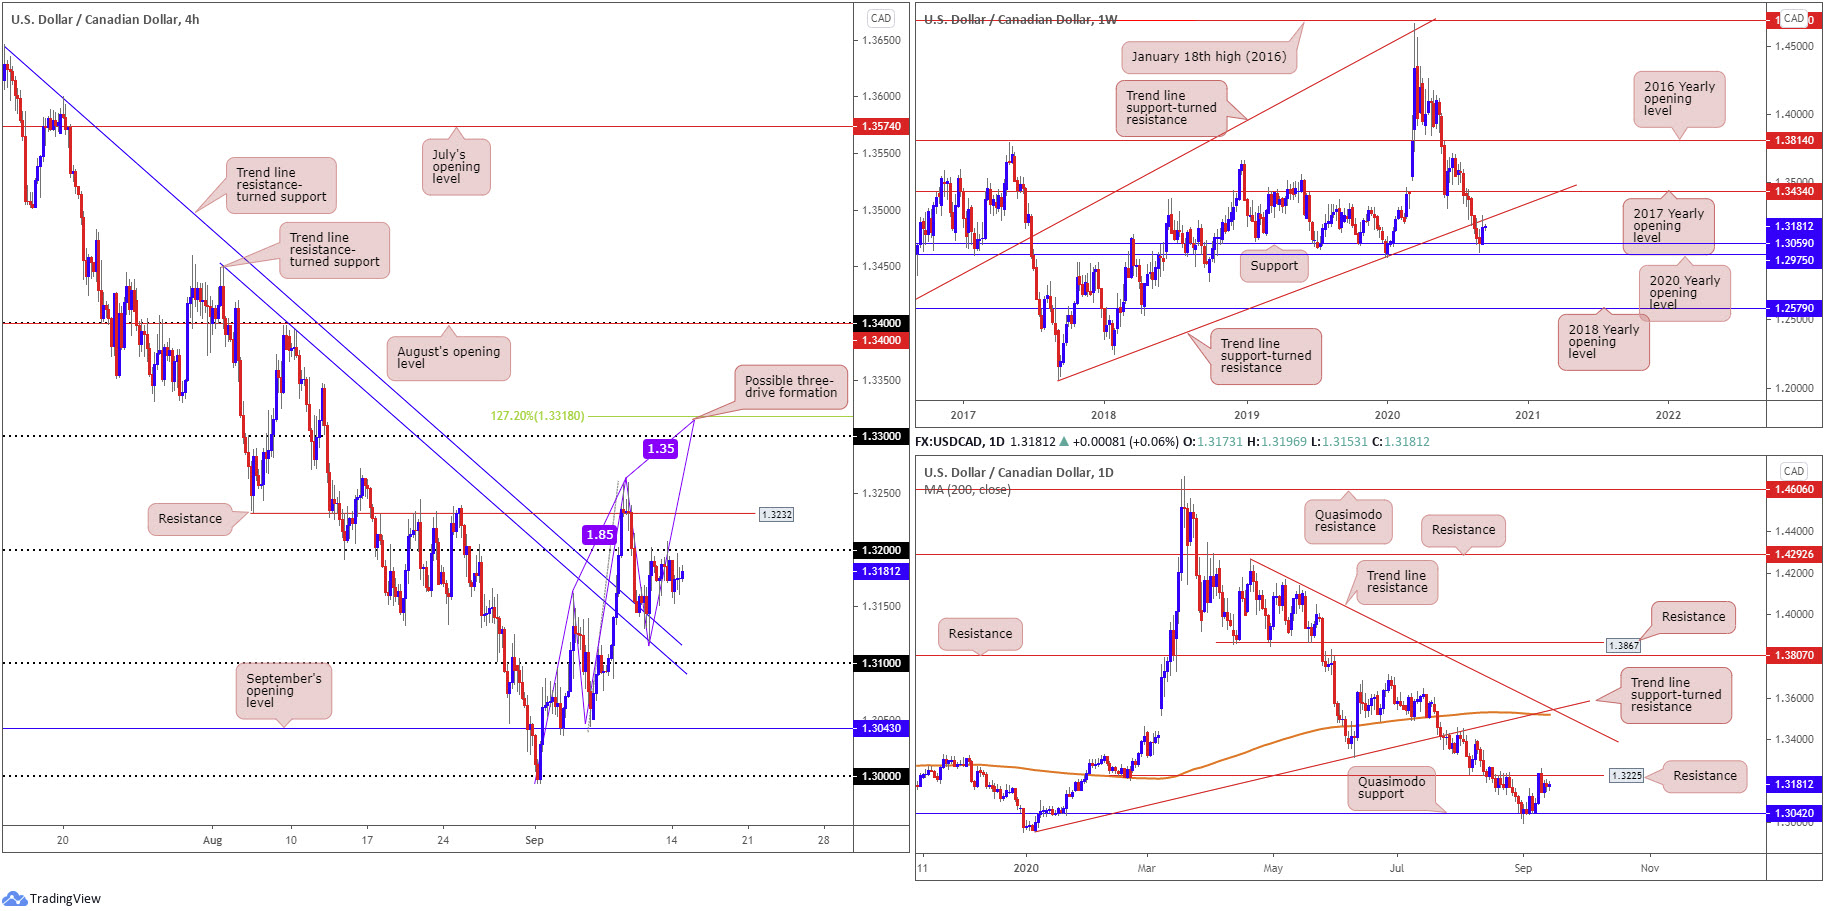
USD/CAD makes its way into Tuesday’s session unmoved, as Monday pencilled in indecisive price action between1.3196/1.3153. Given the narrow range, points aired in previous writing hold valid going into fresh trading.
From the weekly timeframe:
Snapping an eight-week bearish phase, USD/CAD staged a stronger-than-expected recovery last week off support at 1.3059 (pinned just north of the 2020 yearly opening level at 1.2975). This led to trend line support-turned resistance, taken from the low 1.2061, making an appearance, commanding enough of a presence to generate a mild end-of-week correction. Continued upside this week highlights the 2017 yearly opening level at 1.3434 as potential resistance.
From the daily timeframe:
Quasimodo support at 1.3042 remained a notable base last week, with the buck latching onto a strong bid in early trading to shake hands with resistance at 1.3225, a prior Quasimodo support. Interest from the aforementioned resistance was expected having seen the level merge with weekly trend line resistance. In terms of resistance beyond 1.3225, we do not see much to hang our hat on until crossing swords with trend line resistance, etched from the high 1.4265, which happens to align closely with trend line support-turned resistance, taken from the low 1.2957, and the 200-day SMA (orange – 1.3520). However, before reaching the said daily levels, we must contend with weekly resistance around 1.3434.
From the H4 timeframe:
USD/CAD witnessed limited movement Monday, extending Friday’s lacklustre activity around the underside of the 1.32 handle. This followed last Thursday’s recovery from two trend line resistances-turned support, extended from highs 1.3646 and 1.3451.
Brushing aside 1.32 turns attention back to resistance at 1.3232, with a break perhaps exposing the 1.33 handle and a possible three-drive completion at the 127.2% Fibonacci extension point from 1.3318. Traders may also wish to acknowledge the H4 resistance (1.3232) boasts a close connection with daily resistance at 1.3225.
Areas of consideration:
On one side, weekly support at 1.3059 and daily Quasimodo support at 1.3042 recently made an appearance, prompting a bullish move. On the other side we also had weekly price test trend line resistance and daily price probe resistance from 1.3225.
With the above in mind, seeking bullish scenarios above 1.32 on the H4 could prove frustrating, hindered by daily resistance from 1.3225 and H4 resistance at 1.3232. A sell-off from 1.3232/1.32, therefore, could take hold, bolstered by weekly price also recently engaging trend line resistance and the market trending lower since mid-March.
Climbing above 1.3232, nevertheless, ignites the possibility of bullish themes and places 1.33 on the H4 in the firing range (and a three-drive pattern completion around 1.3318).
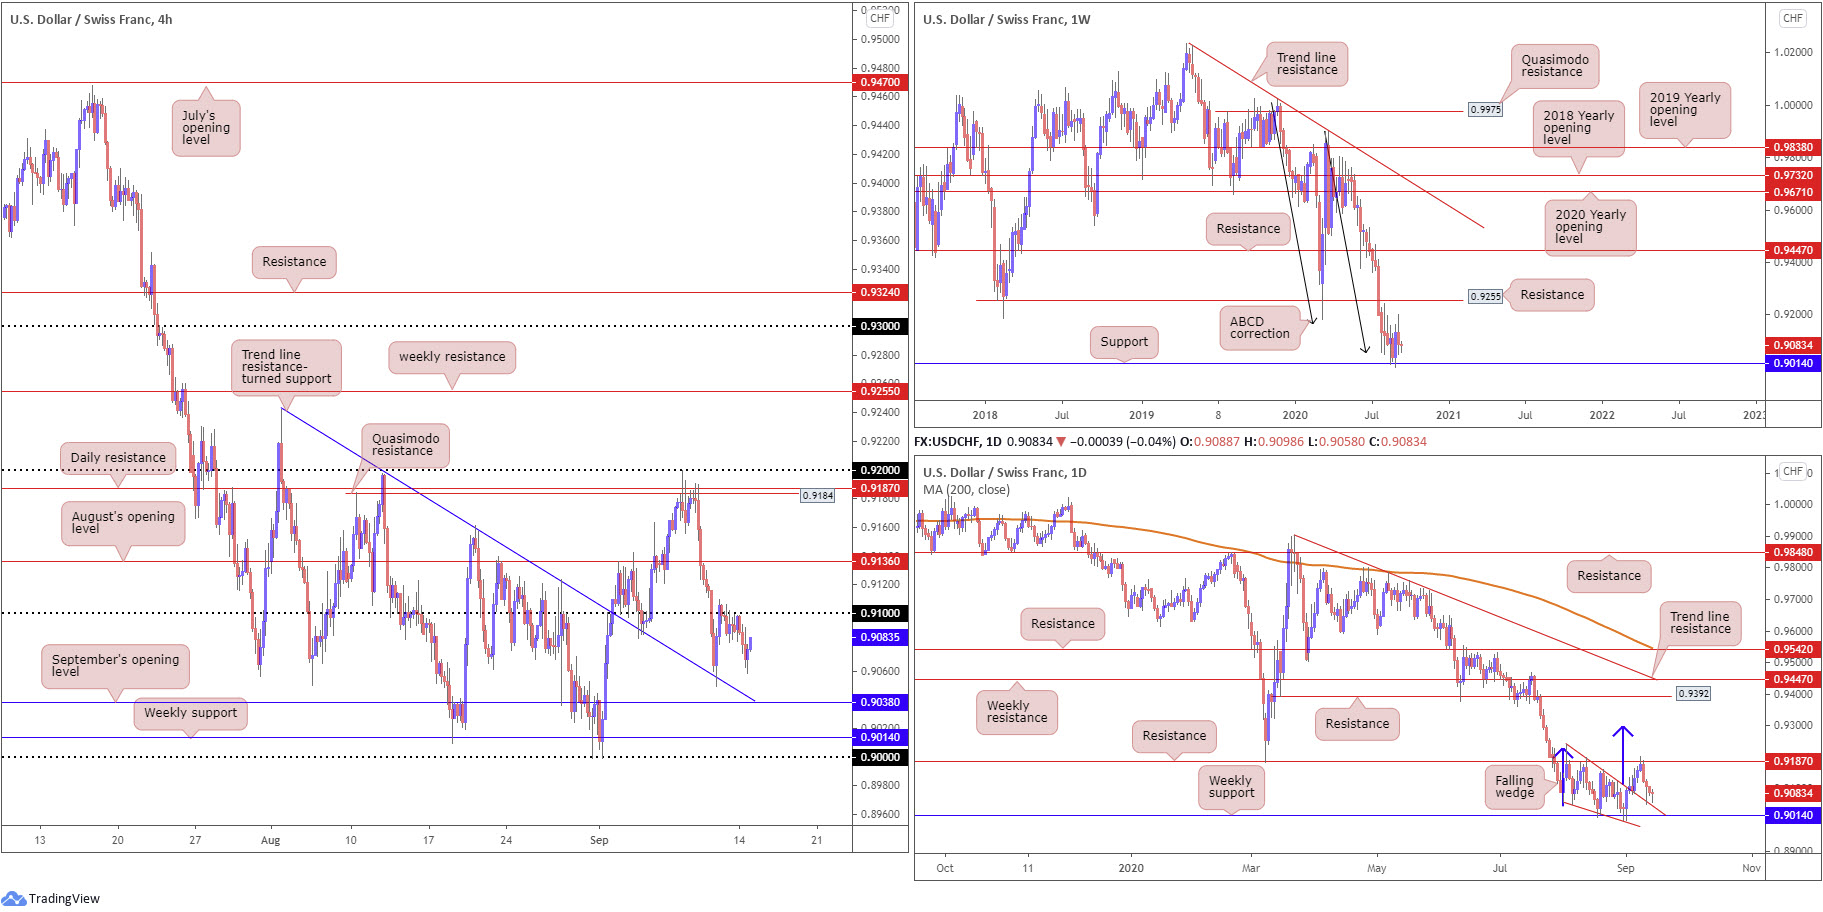
USD/CHF:
USD/CHF, at the time of writing, trades off session lows at 0.9058, with no obvious technical support propelling the move.
0.91 remains a point of resistance on the H4 timeframe, with support fixed around 0.9038, September’s opening level, sharing space with a trend line resistance-turned support, taken from the peak 0.9241. Above 0.91, August’s opening level at 0.9136 steps into view, while brushing aside this base places H4 Quasimodo resistance at 0.9184 in the show (and daily resistance at 0.9187).
Technical movement on the weekly timeframe shows buyers and sellers continue to battle for position north of support at 0.9014, potentially gleaning additional impetus from ABCD support at 0.9051 (black arrows). Resistance at 0.9255, a previous Quasimodo support level, calls for attention should we transition north.
The month of August on the daily timeframe chalked up a falling wedge pattern from the high 0.9241 and a low of 0.9056. The beginning of September saw the upper border of the falling wedge give way, consequently unlocking a bullish reversal signal. Resistance at 0.9187 swiftly put a lid on gains, however, directing moves to just north of the falling wedge. Should we see buyers take over from current price and upset resistance at 0.9187, the falling wedge take-profit target could be the next port of call around 0.9294 (blue arrows). Further dips, nonetheless, brings weekly support in view at 0.9014.
Areas of consideration:
Although the current trend displays a strong bearish posture, buyers are attempting to make a stand off weekly support at 0.9014. In addition to this, daily price is hovering north of the falling wedge upper boundary.
An attempt to breach 0.91 is possible on the H4. This would likely see buyers target August’s opening level at 0.9136, with the prospect of additional upside pressure forcing price to touch gloves with daily resistance at 0.9187.
Breakout buyers north of 0.91 could latch on to the breakout candle’s close as a means of entry; other traders might seek a retest at the round number before pulling the trigger.
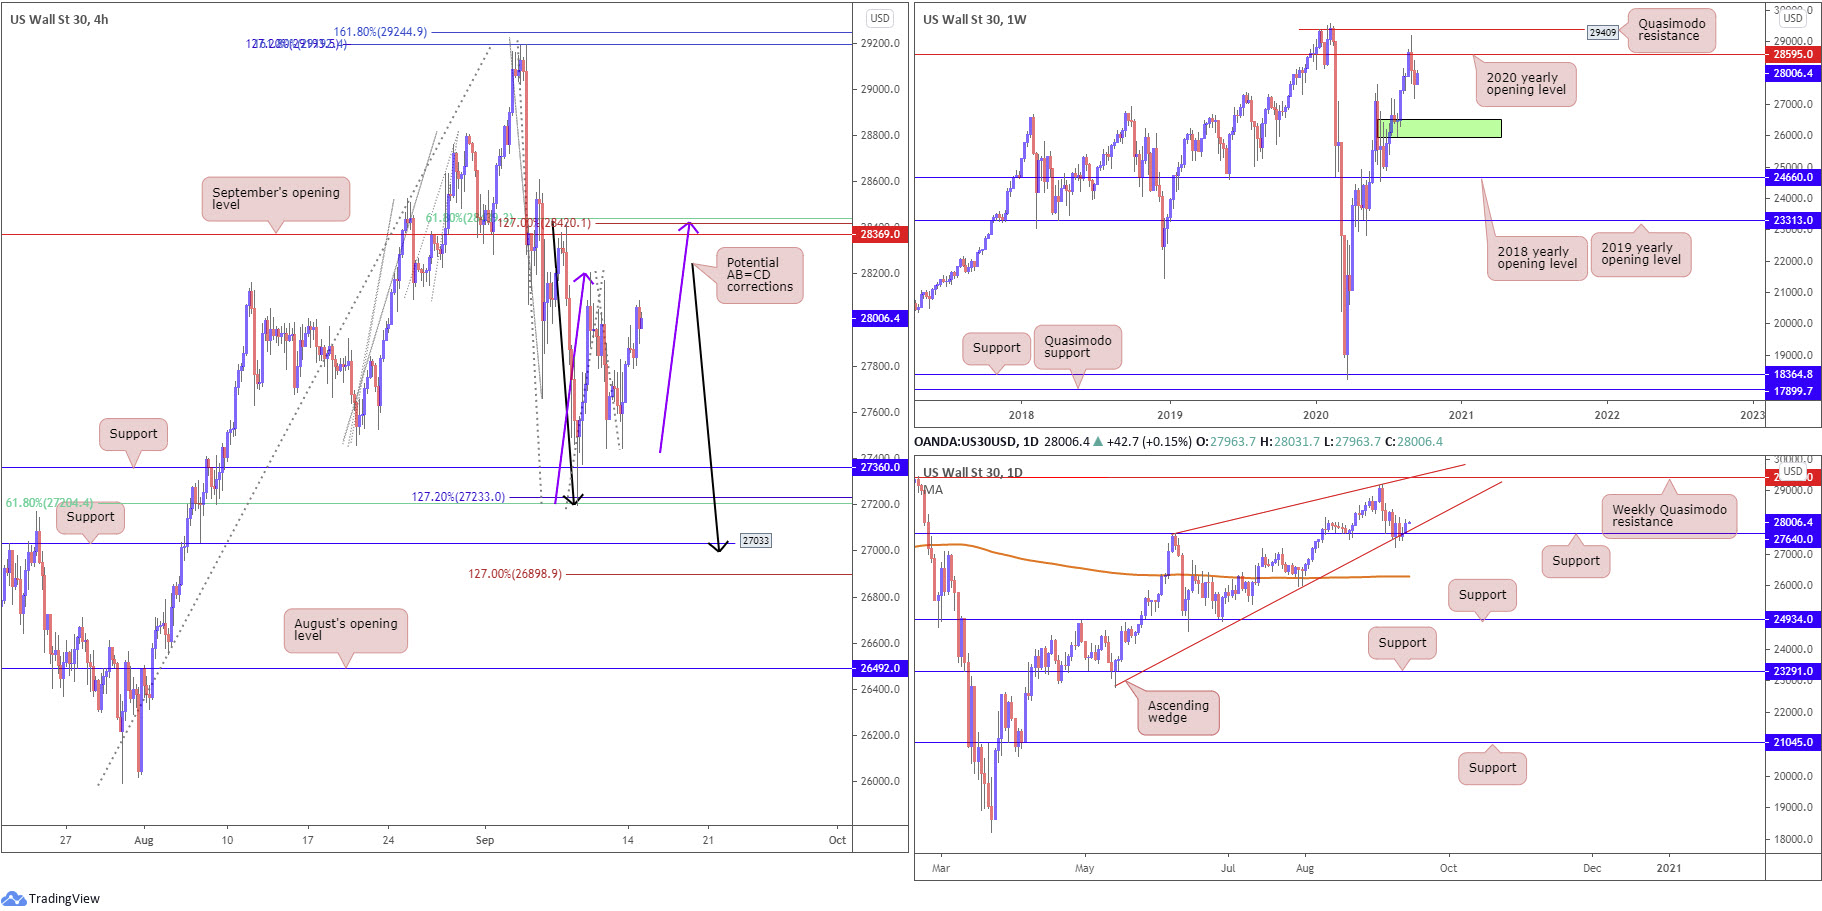
Dow Jones Industrial Average:
Major US equity indices rebounded Monday, lifted amid a recovery in technology shares. The Dow Jones Industrial Average advanced 327.69 points, or 1.18%; the S&P 500 rallied 42.57 points, or 1.27% and the Nasdaq traded higher by 203.11 points, or 1.87%.
Technically, the H4 timeframe reveals support at 27360, shadowed closely by a 127.2% Fibonacci extension point at 27233 and a 61.8% Fibonacci retracement ratio at 27204. Beyond the latter, we’re watching support at 27033, a level that joins closely with a potential AB=CD correction (black arrows) at 26985 and 1.27 BC projection at 26898. To the upside, September’s opening value at 28369 rests as possible resistance, joined by a 61.8% Fibonacci retracement ratio at 28436 and a potential AB=CD bearish pattern (purple arrows) at 28418, along with a 1.27 BC projection at 28420.
Further out, weekly shows price holding south of the 2020 yearly opening value at 28595 (sited just under Quasimodo resistance at 29409). Additional bearish sentiment advertises demand (green) at 25916-26523, an area active buyers may try and defend.
From the daily timeframe, the lower limit of an ascending wedge, taken from the low 22803, along with support from 27640, continues to bolster the unit. Rupturing the aforementioned supports could lead to price crossing paths with the 200-day SMA (orange – 26297), while a recovery positions the 2020 yearly opening level at 28595 (weekly timeframe) in range.
Areas of consideration:
H4 support found between 27204/27360 could hamper downside and perhaps promote bullish themes, as could H4 support at 27033 and joining AB=CD correction. It is also worth pencilling in September’s opening value at 28369 from the H4, having seen its connection with a 61.8% H4 Fibonacci retracement ratio at 28436 and AB=CD confluence.
The accuracy, completeness and timeliness of the information contained on this site cannot be guaranteed. IC Markets does not warranty, guarantee or make any representations, or assume any liability regarding financial results based on the use of the information in the site.
News, views, opinions, recommendations and other information obtained from sources outside of www.icmarkets.com.au, used in this site are believed to be reliable, but we cannot guarantee their accuracy or completeness. All such information is subject to change at any time without notice. IC Markets assumes no responsibility for the content of any linked site.
The fact that such links may exist does not indicate approval or endorsement of any material contained on any linked site. IC Markets is not liable for any harm caused by the transmission, through accessing the services or information on this site, of a computer virus, or other computer code or programming device that might be used to access, delete, damage, disable, disrupt or otherwise impede in any manner, the operation of the site or of any user’s software, hardware, data or property.


