
Key risk events today:
Australia Monetary Policy Meeting Minutes; BOJ Gov Kuroda Speaks; China CPI y/y; BoE Gov. Carney Speaks; UK Average Earnings Index 3m/y; UK Claimant Count Change; UK Unemployment Rate; German ZEW Economic Sentiment; MPC Member Vlieghe Speaks; FOMC Members George and Bullard Speak.
EUR/USD:
Europe’s single currency concluded Monday rangebound vs. an equally subdued dollar amid holiday-thinned trade (US Columbus Day). As a result, much of the following analysis will echo thoughts put forward in Monday’s weekly report (italics).
From the weekly timeframe:
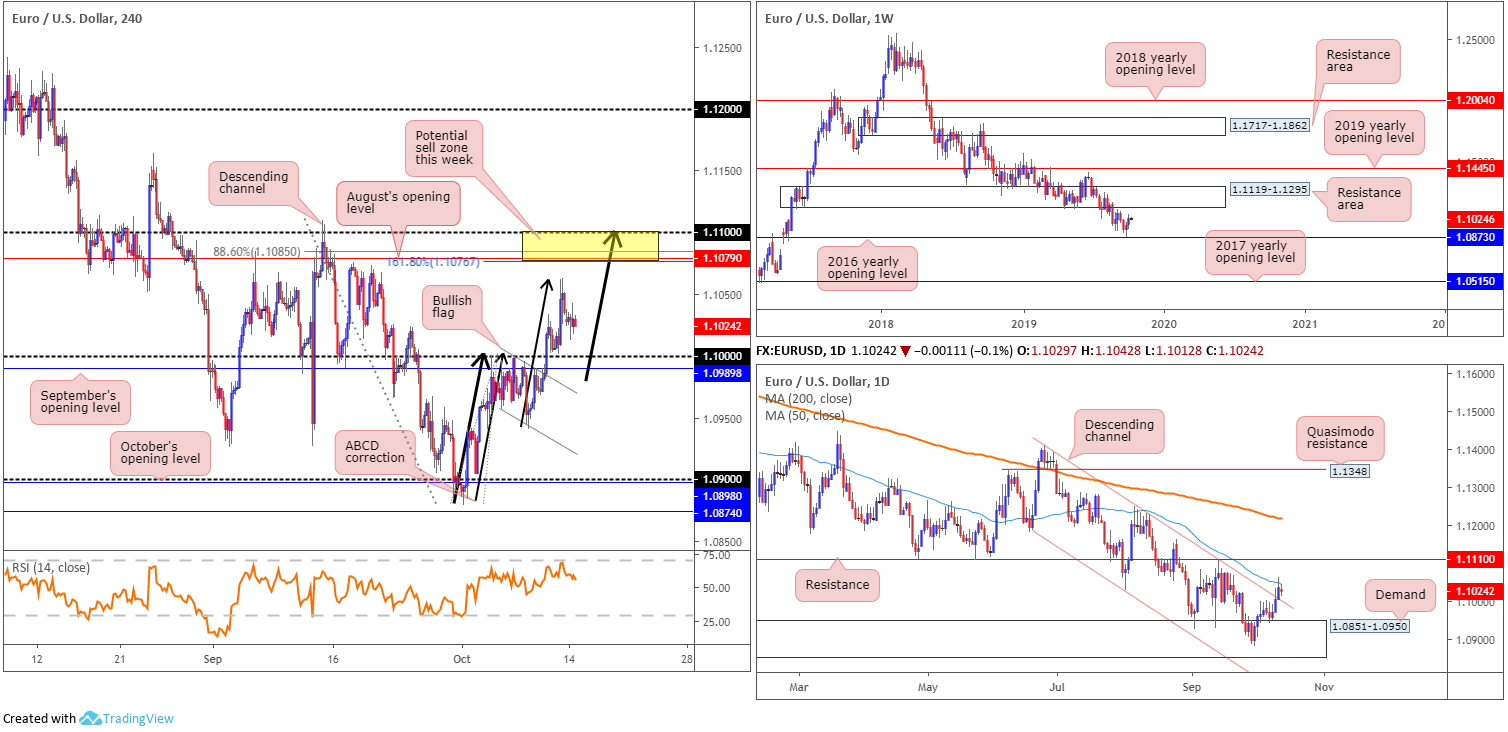
EUR/USD bulls remained on the offensive last week, extending the prior week’s recovery ahead of the 2016 yearly opening level at 1.0873, a reasonably notable support/resistance. Aiding the move was the US dollar index, or DXY, extending losses from prominent weekly resistance at 99.62 – boasts history as far back as mid-2015.
To the upside, the next area of resistance on the EUR/USD falls within 1.1119-1.1295. Concerning trend direction, however, the primary downtrend has been in motion since topping in early 2018 at 1.2555. Therefore, the recent recovery could merely be a correction within the overall trend.
Daily perspective:
Channel resistance (extended from the high 1.1412), active since the later part of June, was overthrown Friday, consequently clearing the pathway for a test of nearby resistance in the shape of the 50-day SMA (blue – 1.1048).
Beyond the said SMA, crosshairs are likely fixed on a well-placed resistance level coming in at 1.1110. Having seen this level serve well as support in April through to May, and denote resistance in September, active sellers likely have this barrier on their radars this week.
H4 perspective:
Leaving the key figure 1.10 unopposed, the H4 candles spun towards the 1.1050 point Friday before mildly pairing gains into the close. Note 1.1050 also brings with it an ABCD correction (light black arrows). Overhead, resistance resides at August’s opening level at 1.1079, which aligns with a 161.8% Fibonacci extension at 1.1076 and an 88.6% Fibonacci retracement ratio at 1.1085 – derived by taking The Golden Ratio, 0.618, square rooting it and square rooting it again to get 0.886. This is also closely shadowed by the 1.11 handle (yellow).
Also, with respect to H4 structure, price broke out north from its bullish flag pattern (1.0957/1.1000) Thursday, which has a measured take-profit target set at 1.11: based on the bullish flag’s preceding move added to the breakout point (heavier black arrows).
Areas of consideration:
Weekly movement advocates additional upside this week, eyeing a resistance area at 1.1119-1.1295. In conjunction with this, daily movement recently engulfed channel resistance, though until the 50-day SMA is cleared which is currently in motion, further buying is problematic. Resistance at 1.1110 is eyed beyond here, nonetheless
H4 action is responding to a recent ABCD completion off 1.1050ish, with the next downside port located at the 1.10 figure. To the upside, the 1.11/1.1076 region (yellow) represents the next port of resistance. With daily resistance plotted just ten points north of this area at 1.1110, 1.11/1.1076 could offer a platform for shorts this week. Though do remain aware, price could potentially push as far north as 1.1119, the underside of a weekly resistance area, before turning lower. Therefore, considering the overall trend remains facing a southerly bearing, the 1.1119-1.1076 (formed to include both weekly and daily resistances noted in bold) region offers robust resistance to consider this week.
GBP/USD:
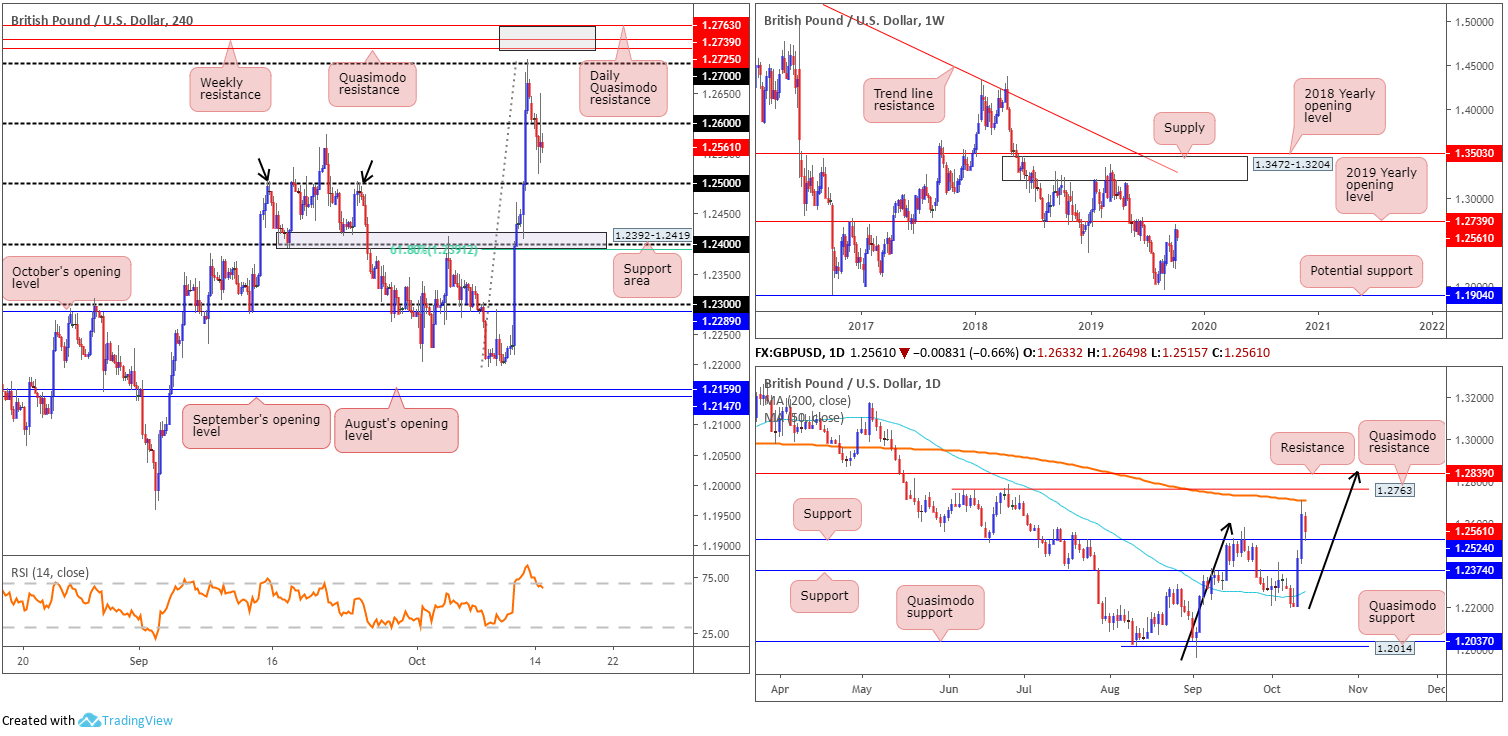
Down 0.70% against the buck, Monday witnessed the British pound turn lower and reclaim a portion of last week’s gains – optimism regarding the prospects of a Brexit deal between the UK and the EU. The move overthrew the 1.26 handle on the H4 timeframe and clocked lows as far south as 1.2515. There was an attempt to retake 1.26 in the early hours of US movement, though the move was fleeting and paused at 1.2649.
The 1.25 handle is in sight as the next viable support – note it served well as resistance in the past (black arrows) – with a break of this figure exposing a support area at 1.2392-1.2419, which happens to encapsulate the 1.24 handle and also boast a connection with the 61.8% Fibonacci ratio at 1.2391.
In terms of weekly flow, focus has now shifted to the 2019 yearly opening level at 1.2739. Having witnessed this long-term level offer both support and resistance since the later part of 2016, the odds favour a reaction materialising from here this week in the event of a test. A violation of this barrier, however, potentially sets the long-term stage for a push to supply at 1.3472-1.3204.
A closer reading of price action on the daily timeframe reveals the 200-day SMA (orange – 1.2709) continues to cap upside, which forced a move towards support at 1.2524 yesterday. Above the said SMA we have Quasimodo resistance located at 1.2763 as well as resistance pencilled in at 1.2839 and a potential AB=CD correction at 1.2842 (black arrows). Below the current support, nevertheless, another layer of support resides at 1.2374.
Areas of consideration:
Seeing daily support recently enter the mix at 1.2524, another retest at 1.26 may form.
On account of the above analysis, traders may find use in the following two zones:
- North of 1.27, H4 Quasimodo resistance is seen at 1.2725, the weekly resistance is also visible at 1.2739 and the daily Quasimodo resistance at 1.2763 (grey). 2763/1.2725 offers an ideal fakeout zone to run stops above 1.27. Grey is a possible sell zone, though waiting for H4 price to close back beneath 1.27 after responding from 1.2763/1.2725 is worth considering as additional confirmation.
- The H4 support area at 1.2392-1.2419, which holds the 1.24 handle and is closely positioned to a 61.8% H4 Fibonacci ratio at 1.2391. For those interested in this zone for possible long entries, you may want to take into account the possibility of a fakeout through to daily support at 1.2374, before serious buyers step in.
AUD/USD:
Monday had the Australian dollar a shade lower against the greenback, mildly paring recent gains. Growing hopes of a trade deal between the two largest economies, the US and China, spurred sentiment last week. US President Trump announced the US and China have come to a ‘substantial’ phase one trade deal, which might take up to five weeks to be signed.
For traders who read Monday’s report you’ll likely recall the following pieces (italics):
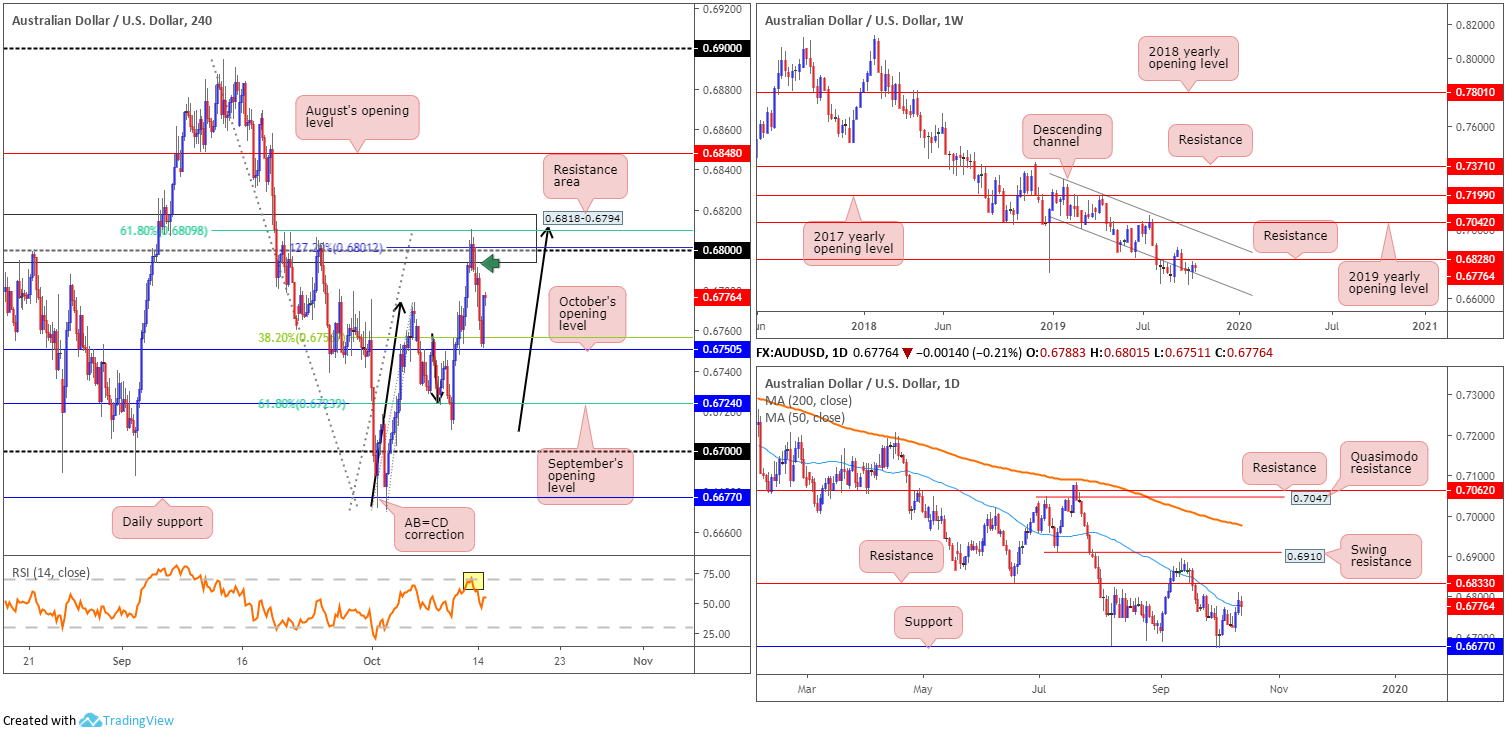
Latest on the weekly timeframe has price action strengthening its grip of channel support (taken from the low 0.7003), consequently clocking its second successive gain. Additional buying may lead to a move towards resistance at 0.6828. A break of the multi-year low at 0.6670 unbolts the door for a run to 0.6359 (not visible on the screen). As is also clear on this scale, the primary downtrend has been in motion since early 2018.
Daily perspective:
Support at 0.6677 remains a dominant structure on the daily timeframe, holding price north in August and more recently at the beginning of October. Last week’s advance struck a monthly peak at 0.6810, marginally toppling the 50-day SMA (blue – 0.6777) and exposing possible resistance around 0.6833.
From the H4 timeframe:
Technical studies reveal price action recently shook hands with a resistance area coming in at 0.6818-0.6794. Not only does this area boast reasonable history, within it contains a 61.8% Fibonacci ratio at 0.6809, the round number 0.68 and a 127.2% AB=CD (black arrows) correction at 0.6801. Indicator-based traders may also wish to acknowledge the relative strength index (RSI) is currently testing overbought territory (yellow).
In view of the H4 timeframe’s closing candle out of the aforementioned resistance area (green arrow), a short could be an option. With a protective stop-loss order plotted above the resistance zone, the first take-profit target can be set around the 38.2% Fibonacci ratio at 0.6756, measured from legs A-D (a common take-profit target).
Areas of consideration:
As evident from the H4 timeframe this morning, traders who sold the H4 bearish rotation candle out of the said H4 resistance area had price strike the initial take-profit target at 0.6754 yesterday. This was a solid cue to think about reducing some of the risk and maybe banking a portion of the position. In the event we continue to explore lower ground and dethrone 0.6754/October’s opening level at 0.6750, the second take-profit target resides at September’s opening level at 0.6724/61.8% Fibonacci ratio.
USD/JPY:
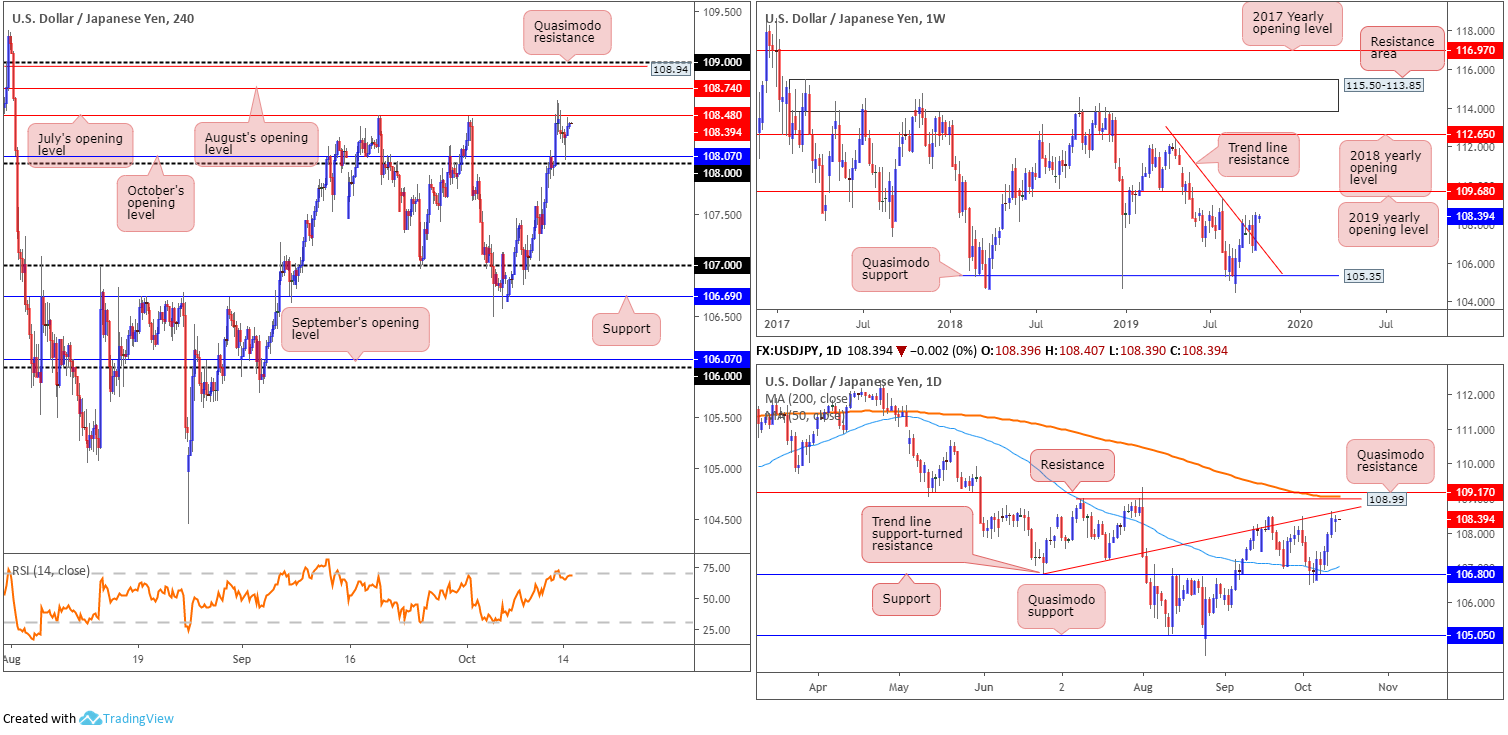
With both the US and Japanese banks shut in observance of respective bank holidays, USD/JPY movement was somewhat limited Monday. Despite this, H4 action established support off October’s opening level at 108.07 amid London hours and produced a clear-cut hammer candlestick formation. The day settled a few points south of July’s opening level at 108.48. 108.74, August’s opening level, Quasimodo resistance at 108.94 and the 109 handle are all worthy barriers to keep an eye on in the event of a break higher.
From the weekly timeframe, long-term flow reclaimed the prior week’s losses and firmed north of trend line resistance taken from the high 112.40. Quasimodo support at 105.35 remains the next downside target on this scale, while to the upside, the 2019 yearly opening level falls in as the next obvious resistance at 109.68.
Although weekly price appears to be gearing up for additional upside this week, daily price recently crossed swords with a trend line support-turned resistance (taken from the low 106.78), shouldered closely together with Quasimodo resistance at 108.99, the 200-day SMA (orange – 109.06) and resistance coming in at 109.17.
Support at 106.80 along with the 50-day SMA (blue – 106.94), also remain of interest.
Areas of consideration:
Outlook unchanged.
Although plotted beneath weekly resistance at 109.68, therefore vulnerable to a whipsaw, 109 is still likely a point of interest for sellers this week. Combining the 109 handle, a H4 Quasimodo resistance at 108.94, a daily Quasimodo resistance at 108.99, the 200-day SMA and another layer of daily resistance at 109.17, this area is certainly worthy of any trader’s watchlist this week. Considering the threat of a fakeout through this area to weekly resistance at 109.68, waiting for a H4 bearish candlestick formation to take shape might be an idea. That way, you have identified seller intent and the candlestick’s structure can be used to base entry and risk levels from.
USD/CAD:
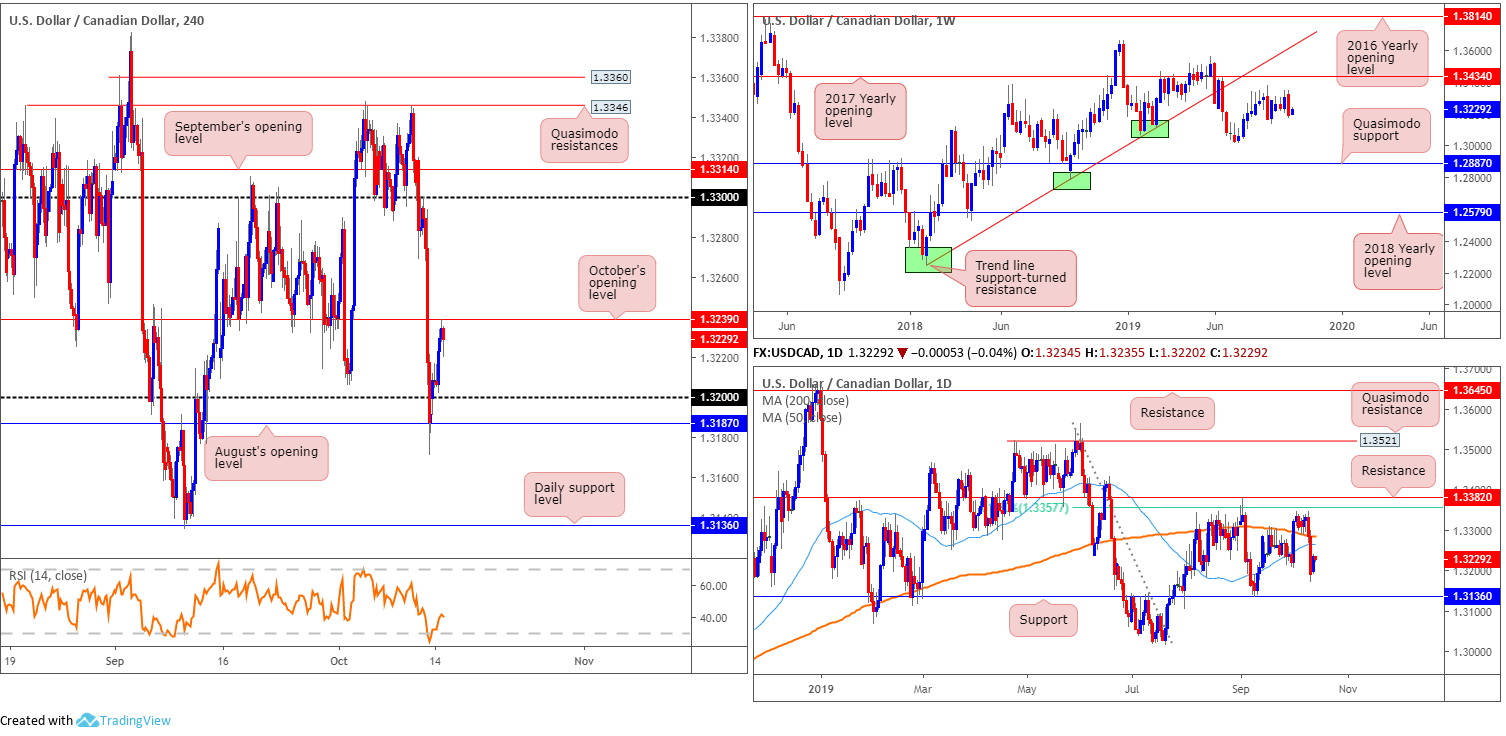
Although both US and Canadian banks closed in observance of respective bank holidays, the USD/CAD wrapped up Monday in positive territory. The sharp drop witnessed in WTI prices – nudged beneath $53.50 – guided the H4 candles north of 1.32 towards October’s opening level at 1.3239. A violation of October’s opening level today and we could witness a run towards the 1.33 handle.
With respect to the higher timeframes this morning, weekly activity witnessed a sharp move to the downside last week, overwhelming the prior week’s bullish outside formation, which may now lead to a possible breakout lower this week. Retreating more than 100 points south of resistance at 1.3434 (the 2017 yearly opening level), support can be seen in the form of the 1.3015 July 15 low, followed by Quasimodo support stationed at 1.2887. The primary trend in this market has remained north since bottoming in September 2017. Currently we’re in a secondary downtrend, with the peak set at 1.3661.
Support on the daily timeframe can be seen at 1.3136 – holding reasonably significant history – as well as resistance drawn from 1.3382, sited just north of a 61.8% Fibonacci ratio at 1.3357. Equally important, though, are the 200-day SMA (orange – 1.3286) and the 50-day SMA (blue – 1.3264) seen closing in on each other (converging) for a possible crossover scenario (also known as the Golden Cross).
Areas of consideration:
The space visible north of October’s opening level at 1.3239 is likely enticing for longs this morning, targeting 1.33. A break above 1.3239 followed up with a retest, therefore, might be of interest to some traders (entry and stops can be positioned according to the rejection candle’s framework). The downsides to this move, however, are that the two simple moving averages plotted on the daily timeframe enter the fold before H4 action reaches 1.33.
Selling October’s opening level may also be on the radar for some traders this morning, targeting 1.32 as the initial port of call.
Both above setups house limited higher-timeframe convergence, so trade with caution.
USD/CHF:
USD/CHF prices are mostly unchanged as we head into Asia Pac hours today, largely due to US banks closing in observance of Columbus Day. With that being the case, much of the following piece will air points stated in Monday’s report (italics).
From the weekly timeframe:
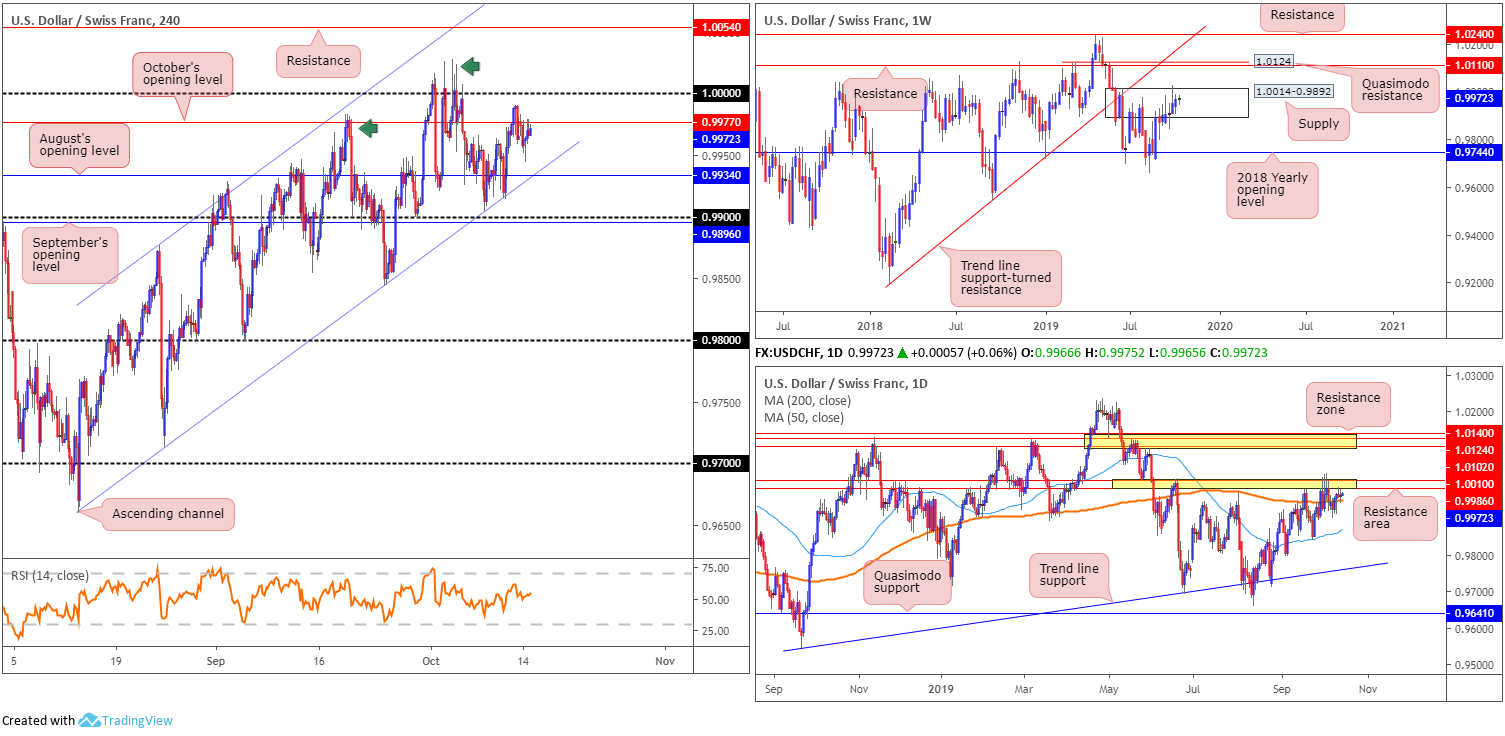
While supply at 1.0014-0.9892 continues to confine price action, sellers are struggling to harvest anything meaningful to the downside. Recent moves struck multi-month peaks at 1.0027, possibly tripping some buy stops and weakening sellers. Therefore, resistance coming in at 1.0110, which happens to merge closely with Quasimodo resistance at 1.0124, may enter the mix over the coming weeks.
According to the primary trend, price reflects a somewhat bullish tone. However, do remain cognisant we have been rangebound since the later part of 2015 (0.9444/1.0240).
Daily perspective:
The resistance area marked yellow at 1.0010/0.9986 remains a prominent structure on this timeframe. Try as it might, recent action attempted to dethrone this area, leaving behind a collection of upper shadows. The retracement from the said zone has been meagre, nonetheless, likely influenced by the 200-day SMA lurking close by (orange – 0.9952).
A close above 1.0010/0.9986 may be viewed as a bullish indicator, suggesting a run towards a resistance area at 1.0140/1.0102, and also signifying a weekly close above supply mentioned at 1.0014-0.9892 could be on the way.
H4 perspective:
Since mid-August, the pair has been compressing within an ascending channel formation (0.9659/0.9877). Although the vibe on the higher timeframes emphasise more of a bullish scenario, buyers appear to be weakening on the H4. The two highs marked with green arrows at 0.9983 and 1.0027 both failed to reach the opposing channel resistance, suggesting lack of buying interest and a possible break of the channel formation this week.
Key levels going forward are the 1.0000 barrier (parity) and the 0.99 handle. A decisive break of either figure will likely portend future direction. Above 1.0000, resistance is seen at 1.0054, whereas sub 0.99 the 0.9843 September 24 low is in sight, followed by the 0.98 region.
Areas of consideration:
While there are a number of support and resistances plotted between 1.0000 and 0.99 on the H4 scale, which could be traded on an intraday basis, medium-term focus is on the two said psychological boundaries. A decisive close beyond either number offers the trader a potential trading opportunity, targeting the levels highlighted above in bold.
Conservative traders may opt to wait for a retest of the broken level before taking action, whereas more aggressive traders may simply buy/sell the breakout candle and position stop-losses accordingly.
Dow Jones Industrial Average:
US equities eked out marginal losses Monday amid holiday-thinned trade. This Follows Friday’s advance, fuelled on the back of US President Donald Trump stating China and the US reached the first phase of a substantial trade deal. The Dow Jones Industrial Average lost 29.23 points, or 0.11%; the S&P 500 also lost 4.12 points, or 0.14%, and the tech-heavy Nasdaq 100 erased 1.54 points, or 0.02%.
In light of Monday’s lacklustre movement, the following will largely mirror Monday’s outlook (italics).
Kicking things off from the weekly timeframe:
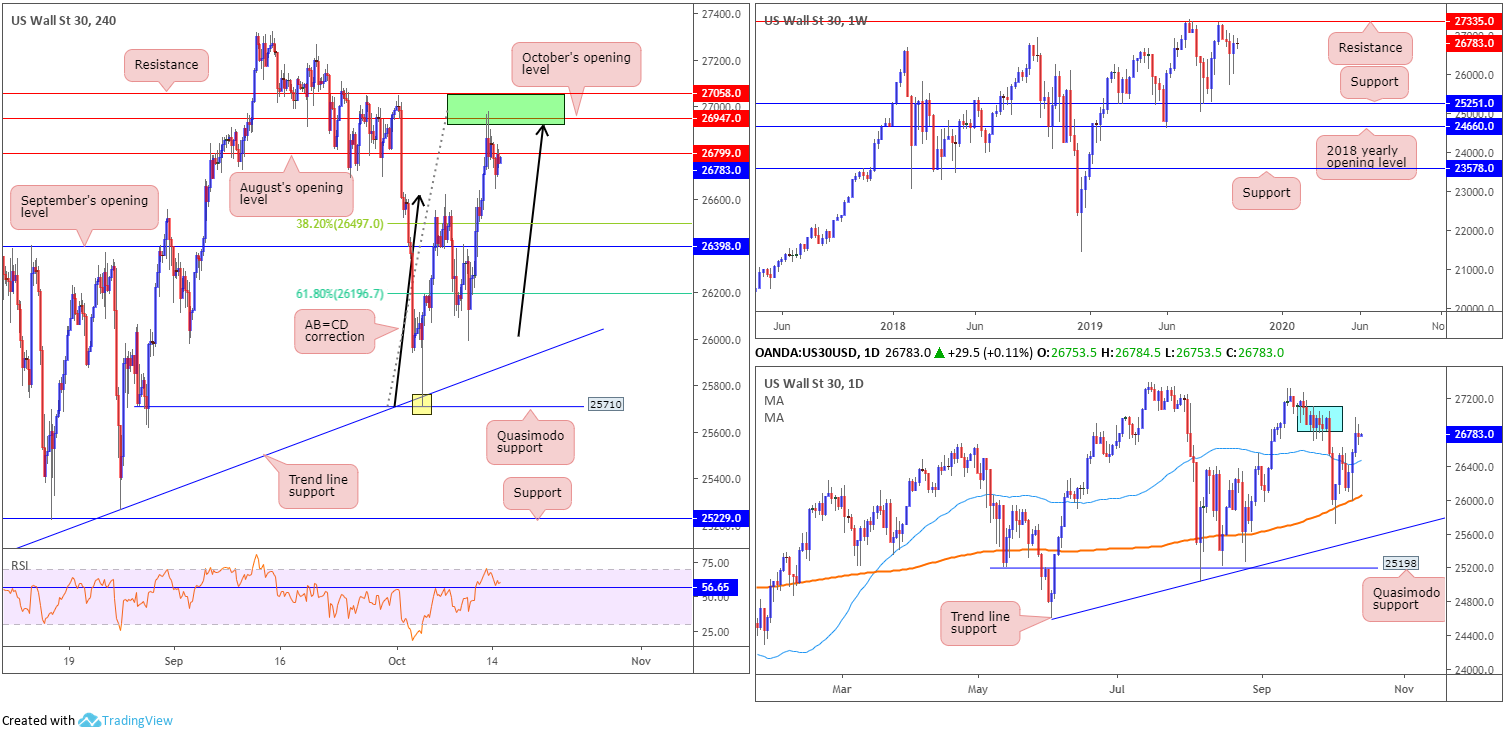
Finishing the week in positive territory and breaking a three-week bearish phase, long-term action is now poised to approach resistance at 27335. Note this barrier is sited only a few points south of the all-time high 27388. Levels of support remain fixed at 25251 and the 2018 yearly opening level at 24660.
Despite a minor setback to 21452, the primary trend in this market remains facing northbound.
Daily perspective:
Latest on the daily timeframe saw price tunnel through the 50-day SMA (blue – 26431) after finding support off the 200-day SMA (orange – 26017). The move exposed supply between 27110-26813 (blue – positioned just south of weekly resistance at 27335), which entered the fold Friday and sported a mild end-of-day upper shadow.
H4 perspective:
The area between H4 resistance at 27058, October’s opening level at 26947 and a H4 AB=CD correction (black arrows) marked in green is likely a zone of interest for sellers today/next week. Even more so knowing the area is housed within daily supply at 27110-26813. However, given the area is susceptible to a fakeout to weekly resistance at 27335, traders may consider waiting for additional candlestick confirmation to form before pulling the trigger. That way, seller intent is visible and additional entry and risk levels are available to trade.
As evident from the chart, price responded from the H4 zone going into the week’s close and printed a reasonably attractive H4 bearish candle that closed nearby its lows.
The H4 rotation out of the said H4 resistance area is likely enough to entice sellers into the market today, with protective stop-loss orders placed either above 27058 or Friday’s high 26980, and the first target set at the 38.2% Fibonacci ratio of legs A-D at 26497. Target points beyond here are seen at September’s opening level drawn from 26398 and the 61.8% Fibonacci ratio at 26196.
Areas of consideration:
Traders short based on the green H4 sell zone have the unit establishing mild resistance beneath August’s opening level at 26799. This is a good sign for sellers, targeting 26497.
XAU/USD (GOLD):
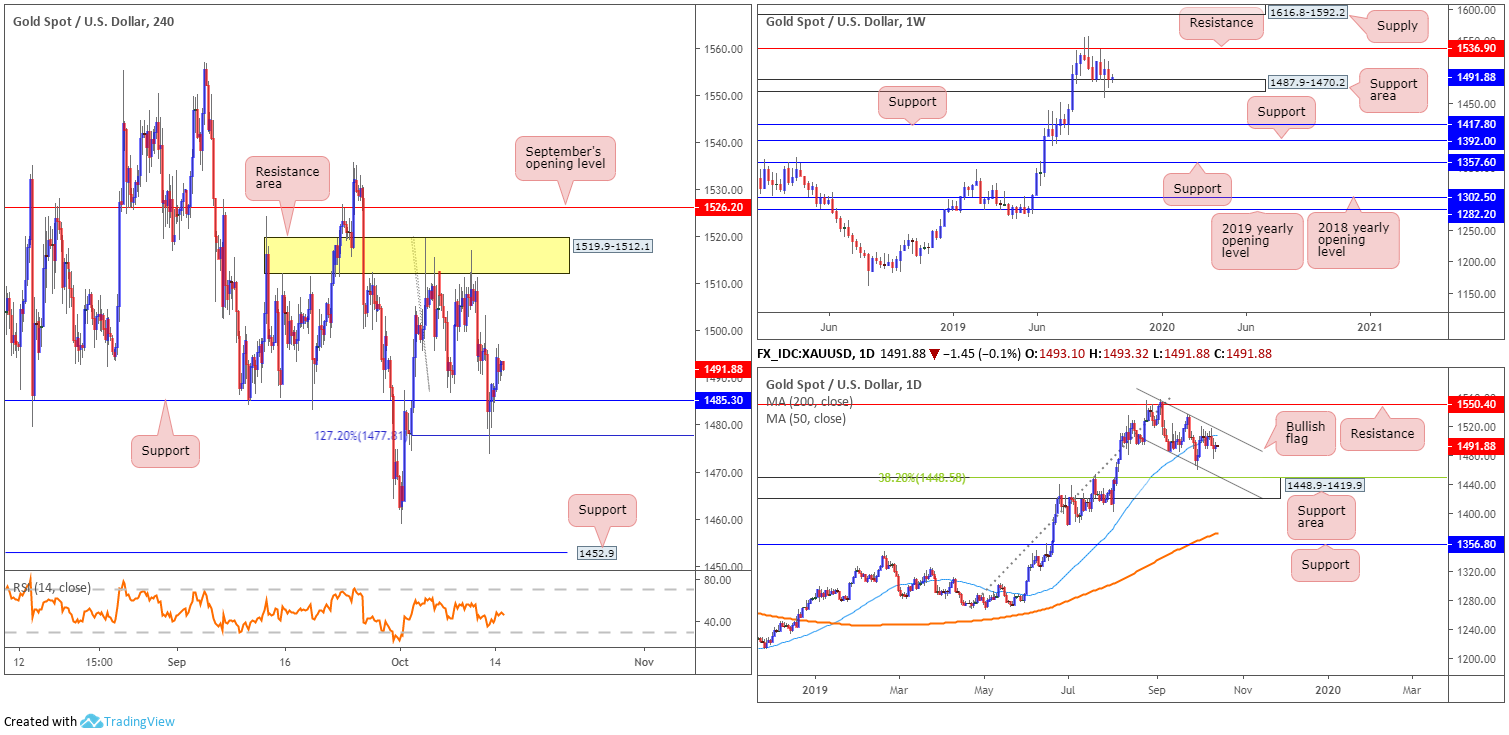
Bullion finished Monday a touch lower against the dollar, offering little change from a technical perspective as we head into Tuesday. Subdued holiday-thinned markets kept the yellow metal above H4 support at 1485.3, located just north of a 127.2% Fibonacci extension at 1477.8. This may, if buyers remain buoyant, set the stage for an intraday rally towards a port of resistance marked in yellow at 1519.9-1512.1.
The story on the weekly timeframe, as highlighted in Monday’s weekly report, shows a support area at 1487.9-1470.2 currently in motion, though appears to be running out of steam following the break of its lower edge two weeks ago. To the upside, nonetheless, resistance is seen at 1536.9, whereas two layers of support are seen at 1392.0 and 1417.8 in the event we push for lower ground. In terms of the longer-term primary trend, gold has been trading northbound since the later part of 2015.
Daily flow shows a bullish flag has been in motion since early September (1557.1/1485.3), though the recent recovery from the lower limit of the formation was unable to test the upper boundary. Last week saw the unit cross beneath its 50-day SMA (blue – 1506.7), consequently opening downside to a possible test of a support area coming in at 1448.9-1419.9 (which happens to have its upper edge bolstered by a 38.2% Fibonacci ratio 1448.5).
Areas of consideration:
Outlook unchanged.
The primary trend, clearly visible on the weekly timeframe, appears in good shape. However, the current weekly support area looks to be waning. This highlights the option for a run to the daily support area at 1448.9-1419.9 and converging channel support (the lower edge of the current bullish flag) for a possible opportunity to join the primary trend.
Medium term, however, buyers are unlikely to reach the H4 resistance area at 1519.9-1512.1, but if a strong retest at H4 support 1485.3 is seen, a long may still be worthy of consideration at this point (entry and risk can be set according to the rejection candle’s frame).
The accuracy, completeness and timeliness of the information contained on this site cannot be guaranteed. IC Markets does not warranty, guarantee or make any representations, or assume any liability regarding financial results based on the use of the information in the site.
News, views, opinions, recommendations and other information obtained from sources outside of www.icmarkets.com.au, used in this site are believed to be reliable, but we cannot guarantee their accuracy or completeness. All such information is subject to change at any time without notice. IC Markets assumes no responsibility for the content of any linked site.
The fact that such links may exist does not indicate approval or endorsement of any material contained on any linked site. IC Markets is not liable for any harm caused by the transmission, through accessing the services or information on this site, of a computer virus, or other computer code or programming device that might be used to access, delete, damage, disable, disrupt or otherwise impede in any manner, the operation of the site or of any user’s software, hardware, data or property.


