
A note on lower timeframe confirming price action…
Waiting for lower timeframe confirmation is our main tool to confirm strength within higher timeframe zones, and has really been the key to our trading success. It takes a little time to understand the subtle nuances, however, as each trade is never the same, but once you master the rhythm so to speak, you will be saved from countless unnecessary losing trades. The following is a list of what we look for:
- A break/retest of supply or demand dependent on which way you’re trading.
- A trendline break/retest.
- Buying/selling tails/wicks – essentially we look for a cluster of very obvious spikes off of lower timeframe support and resistance levels within the higher timeframe zone.
- Candlestick patterns. We tend to stick with pin bars and engulfing bars as these have proven to be the most effective.
We search for lower timeframe confirmation between the M15 and H1 timeframes, since most of our higher-timeframe areas begin with the H4. Stops are usually placed 5-10 pips beyond confirming structures.
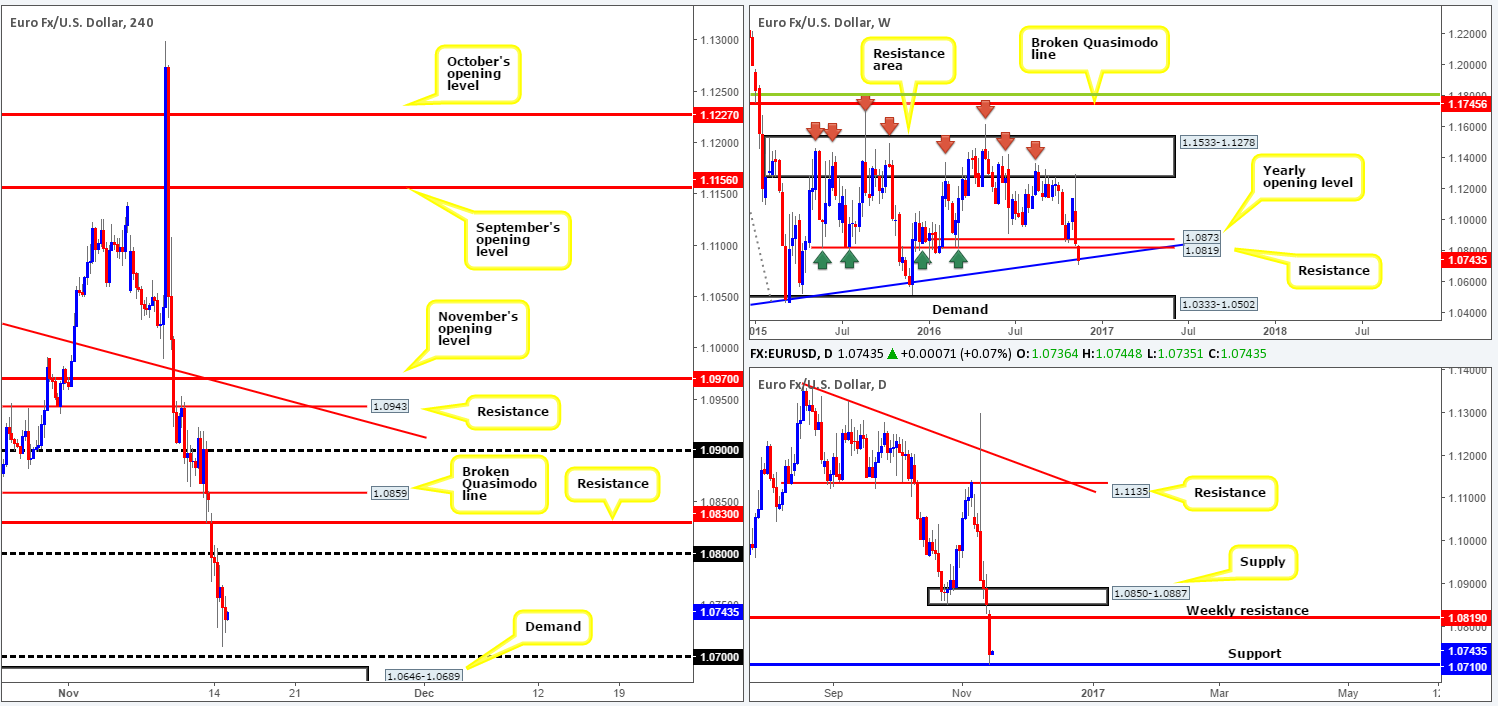
EUR/USD:
Across the board, we saw the US dollar extend higher yesterday, consequently pressuring the shared currency to fresh lows of 1.0709 on the day. What this move also accomplished was a clean break through weekly support at 1.0819, which, as you can see from the chart, has now positioned the weekly candle around a trendline support drawn from the low 0.8231. In addition to this, the daily candles are also currently seen flirting with a support level penciled in at 1.0710. The last time this barrier was visited was at the beginning of the year, and the response from here managed to propel the EUR over 900 pips north! So it’s definitely not a level one wants to overlook!
Given H4 action bottomed just ahead of the 1.07 handle yesterday, we feel this level could be tested today. However, a fakeout through the hurdle is almost guaranteed, since there is a small, almost hidden, demand lurking just below it at 1.0646-1.0689 (visible on the H1).
Our suggestions: Buying at current prices is tempting given the daily support and weekly trendline in play. Be that as it may, our desk has no interest in buying right now. Instead, what we’re looking to do is trade the potential fakeout through 1.07. A nice-looking H4 buying tail that extends through 1.07 into the 1.0646-1.0689 would be a fine confirming signal to jump in long this market, targeting the 1.08 handle.
Data points to consider: German Prelim GDP at 7am, US Retail sales at 1.30pm and FOMC member Fischer speaks at 6.30pm GMT.
Levels to watch/live orders:
- Buys: 1.07 region ([watch for a H4 buying tail to form prior to pulling the trigger] stop loss: either beyond the demand at 1.0643 or beyond the H4 buying tail).
- Sells: Flat (stop loss: N/A).
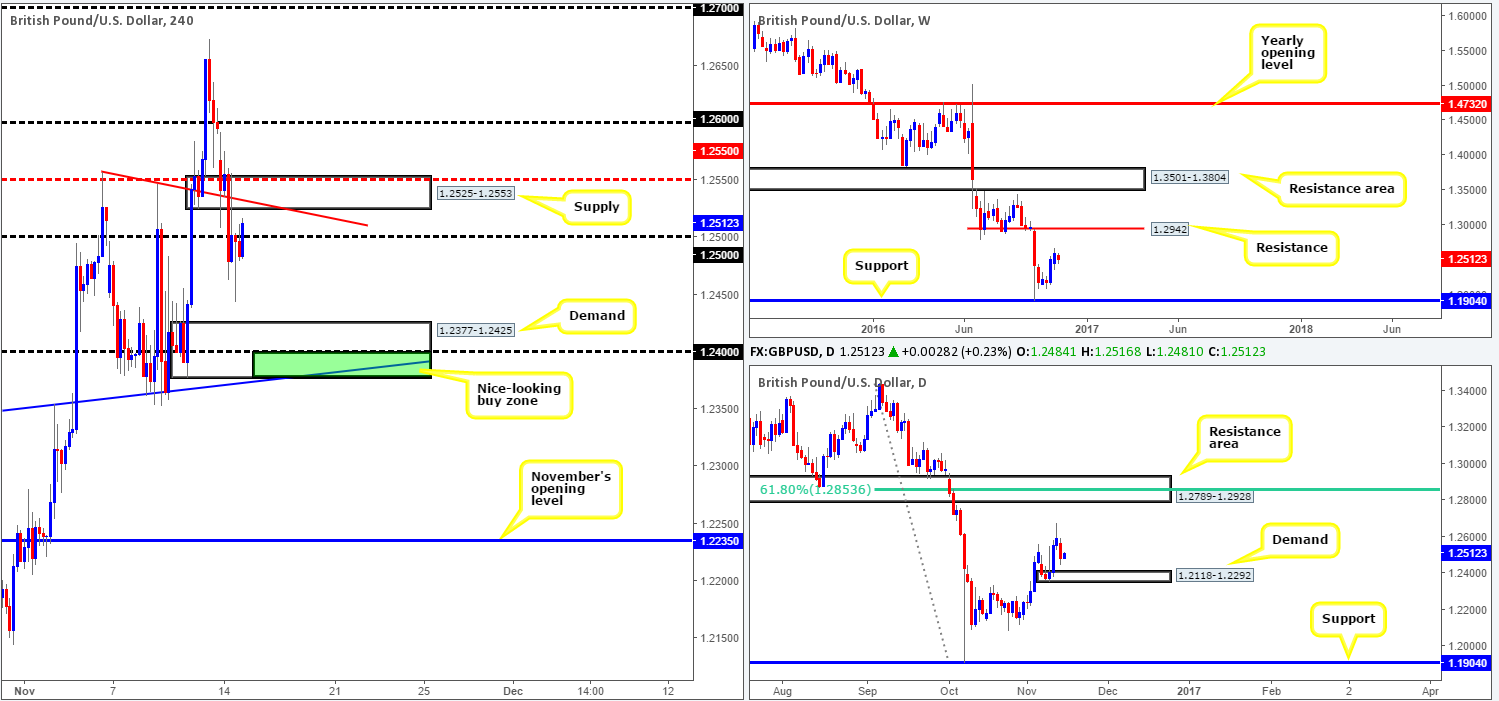
GBP/USD:
For those who read Monday’s report on cable you may recall our team highlighting the possibility of a long trade from H4 demand at 1.2525-1.2553. Fortunately, the H4 candles didn’t print a sufficient H4 bullish close – a prerequisite to this setup – so we passed. Following this, the pair aggressively took out both the H4 demand and the 1.25 handle in one fell swoop going into the early hours of the European session, managing to clock lows of 1.2444 as US traders entered the fight.
As we write, the pound is seen trading back above 1.25 and looks to be on course to retest 1.2525-1.2553 as supply. Technically speaking, a response could be seen from here due to the barrier fusing with a H4 trendline resistance extended from the high 1.2557. Nevertheless, both the weekly and daily timeframes show room for this market to claw higher, with the nearest upside target seen on the daily chart at 1.2789-1.2928: a resistance area which happens to blend with a 61.8% Fib resistance at 1.2853.
Our suggestions: While the current H4 supply at 1.2525-1.2553 may produce a reaction, we cannot justify a short trade here knowing that the higher timeframes suggest further upside is a possibility. The only area that really tickles our fancy, so to speak, is seen deep within the H4 demand at 1.2377-1.2425 (green area). Between 1.2377 (the lower edge of the demand) and the 1.24 handle, as well as its supporting H4 trendline support stretched from the high 1.2332 is, at least in our opinion, an area worthy of consideration given that it sits on top of the aforementioned daily demand!
Data points to consider: UK CPI inflation release at 9.30am, UK inflation report hearings at 10am, US Retail sales at 1.30pm and FOMC member Fischer speaks at 6.30pm GMT.
Levels to watch/live orders:
- Buys: 1.2377/1.24 region ([reasonably sized H4 bullish close required prior to pulling the trigger] stop loss: ideally beyond the trigger candle).
- Sells: Flat (stop loss: N/A).
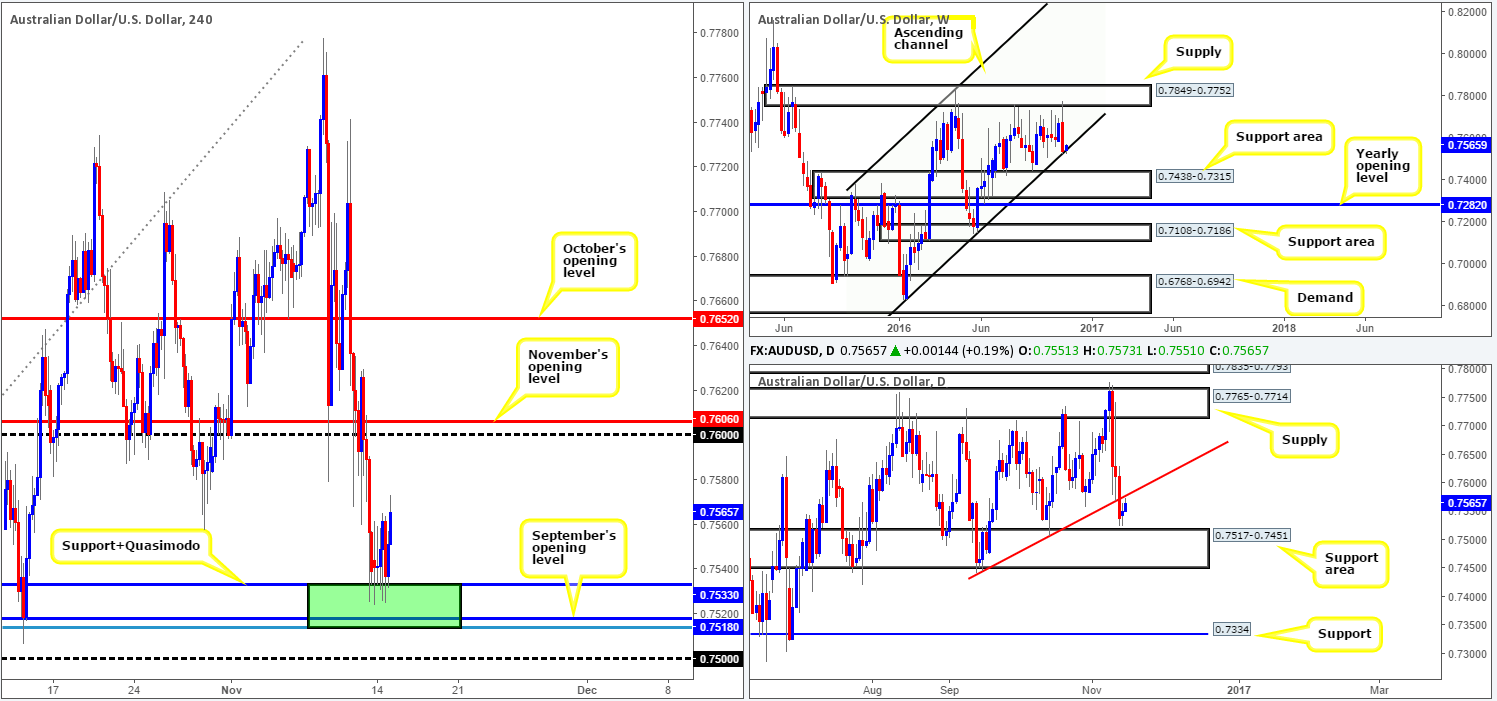
AUD/USD:
Kicking this morning’s analysis off with a look at the weekly timeframe, we can see that the weekly candle is currently toying with a channel support line taken from the low 0.6827. For now, this barrier looks to be in good shape, possibly opening up the possibility for a move north back up to supply at 0.7849-0.7752. Conversely, should the current line be taken out, the next downside target is seen at a support area drawn from 0.7438-0.7315.
Yesterday’s daily session, as you can see, printed a clear-cut indecision candle between a support area coming in at 0.7517-0.7451 and a trendline resistance taken from the low 0.7442. At the time of writing, nonetheless, the bulls look poised to test the underside of this trendline, which could cause problems for weekly bulls off the channel support hurdle.
Stepping across to the H4 chart, the H4 buy zone we discussed yesterday at 0.7513/0.7533 (green rectangle comprising of a support/Quasimodo at 0.7533, September’s opening level at 0.7518 and a 78.6% Fib support at 0.7513) managed to maintain a bullish stance during yesterday’s sessions. Be that as it may, the H4 buyers now have to compete with the daily trendline resistance mentioned above, thus, we could possibly see a change in sentiment today.
Our suggestions: While weekly action indicates buying to be the better approach, and daily price suggesting market participants to be wary of buying until at least the current trendline resistance is consumed, we still feel the best levels for longs are September’s opening barrier at 0.7518 and the 0.75 handle. The reason being, as can be seen on the daily chart, is there’s still room seen for the market to stretch lower and connect with the top edge of above said daily support area, which are where these levels are situated!
Data points to consider: RBA monetary policy meeting at 12.30am, RBA Gov. Lowe speaks at 8.15am, US Retail sales at 1.30pm and FOMC member Fischer speaks at 6.30pm GMT.
Levels to watch/live orders:
- Buys: 0.7518 region ([reasonably sized H4 bullish close required prior to pulling the trigger] stop loss: ideally beyond the trigger candle). 0.75 mark ([reasonably sized H4 bullish close required prior to pulling the trigger] stop loss: ideally beyond the trigger candle).
- Sells: Flat (stop loss: N/A).
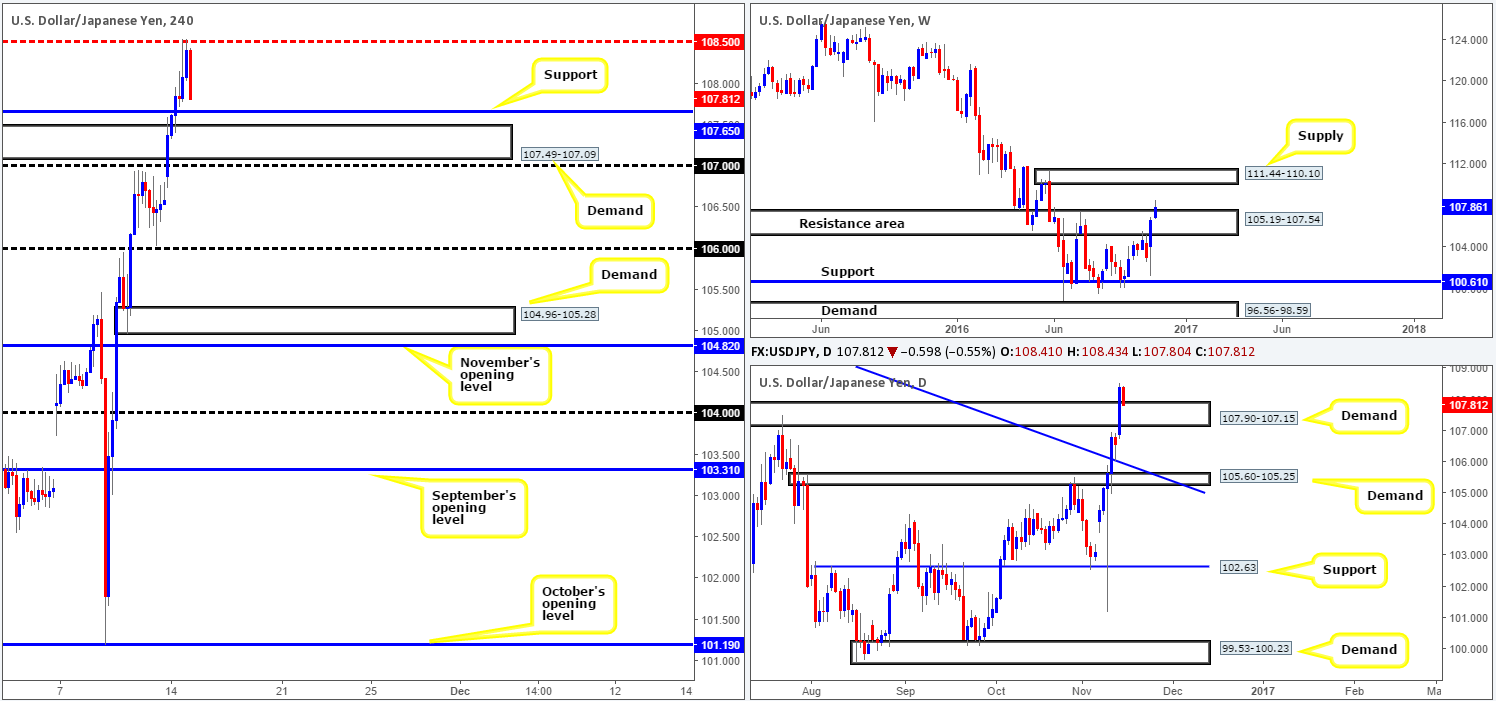
USD/JPY:
In our previous report, we mentioned that our team placed a pending sell order at 107.64 with a stop-loss order set at 107.90. Our order was filled going into the early hours of yesterday’s European trading and, if you look on the M15 chart, you’ll see price managed to drive a clear 25 pips lower. Given that our risk was 26 pips along with the possibility of the recently faked H4supply now becoming demand, our team reduced risk to breakeven here. Unfortunately, it was not too long after that our stop was taken out. Following this, the pair continued to increase in value until reaching the H4 mid-way resistance point at 108.50 going into the US segment.
With the unit now seen within touching distance of retesting the 107.65 level as support, where does our desk stand on the higher-timeframe picture? Well, yesterday’s bullish assault managed to remove daily supply at 107.90-107.15, which is, as we write, being retested as demand. As long as the daily bulls can preserve this area, there’s a good chance we may see a weekly close above the weekly resistance area coming in at 105.19-107.54, which does appear to be struggling at the moment.
Our suggestions: Personally, we like the look of 107.65 for a bounce today given its connection with the aforementioned daily demand. The reason we say ‘bounce’, rather than reversal, is simply due to the fact that price has yet to close above the weekly resistance area yet. To be on the safe side, we would advise waiting for at least a H4 bullish close to form prior to risking capital here, as there’s a possibility that 107.65 could be faked down into the H4 demand base seen directly below at 107.49-107.09.
Data points to consider: US Retail sales at 1.30pm and FOMC member Fischer speaks at 6.30pm GMT.
Levels to watch/live orders:
- Buys: 107.65 region ([reasonably sized H4 bullish close required prior to pulling the trigger] stop loss: ideally beyond the trigger candle).
- Sells: Flat (stop loss: N/A).
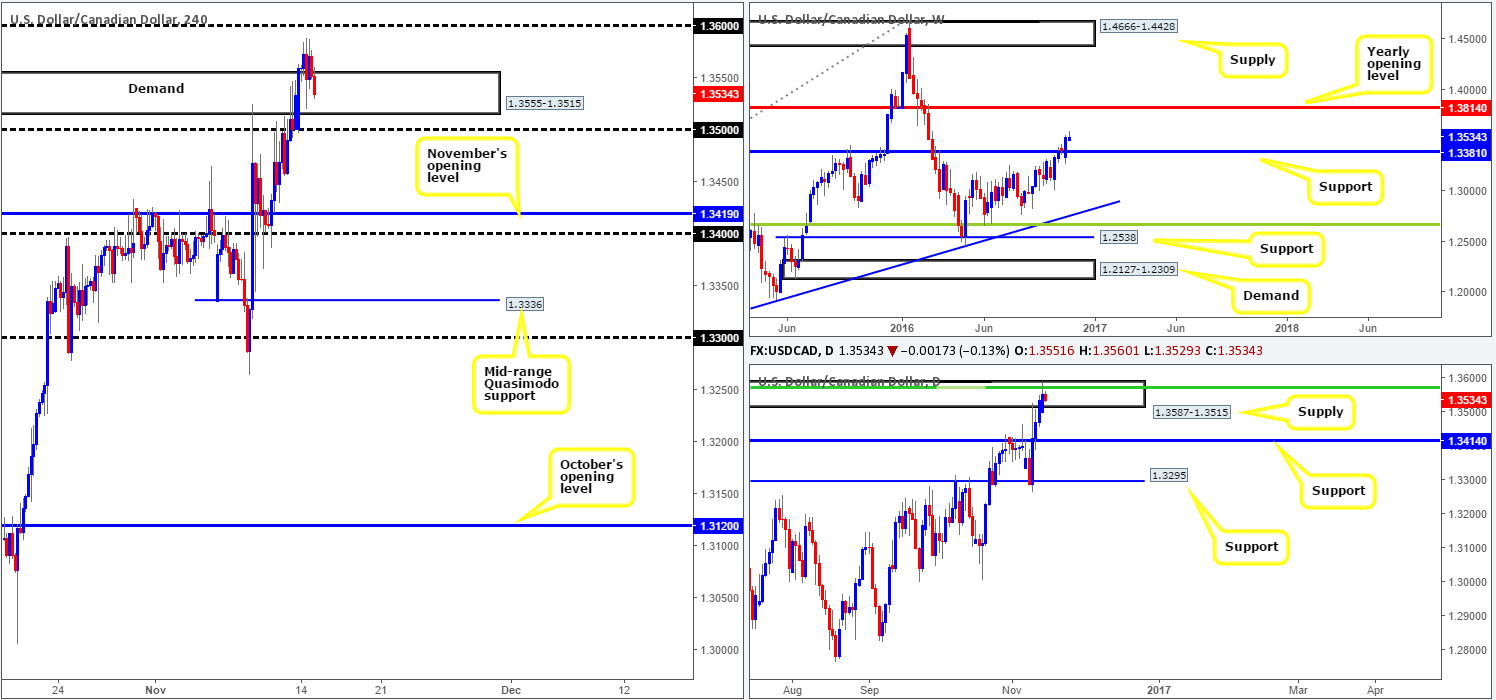
USD/CAD:
During the course of yesterday’s sessions, the USD/CAD surpassed both the H4 supply at 1.3555-1.3515 and also the nearby H4 Quasimodo resistance at 1.3564, before topping at 1.3588. In consequence to this, the H4 candles are, at the present, seen retesting the recently broken H4 supply as demand.
Looking over to the weekly picture, the trail north appears clear up to the yearly opening level drawn from 1.3814. However, before advancing there’s a possibility that we may see price retest 1.3381 as support. Meanwhile, on the daily chart, the unit respected supply coming in at 1.3587-1.3515, which, as you can see, happens to coincide nicely with a 61.8% Fib resistance at 1.3832.
Our suggestions: Although the weekly chart shows a relatively clear runway north and the H4 is currently testing a demand base, we’re hesitant buying this market given the daily candles response to supply. For us to become buyers, we’d ideally like to see the 1.36 handle taken out. This would, as far as we can see, confirm upside strength on the weekly timeframe, and also, more importantly, take out sellers’ stops from above the current daily supply zone.
Given the above points, our team will take a back seat for the time being and see how today’s action progresses.
Data points to consider: US Retail sales at 1.30pm and FOMC member Fischer speaks at 6.30pm GMT.
Levels to watch/live orders:
- Buys: Currently watching for a close above 1.36.
- Sells: Flat (stop loss: N/A).
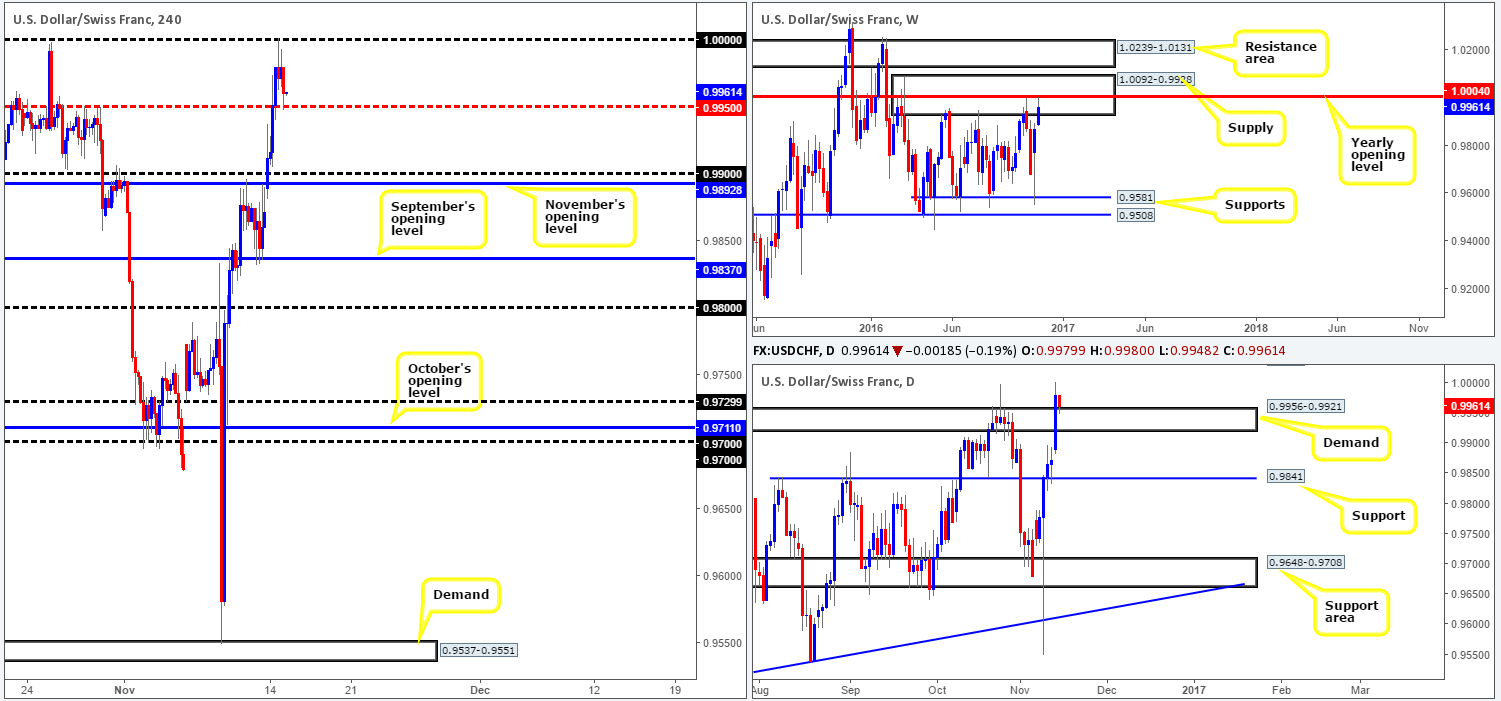
USD/CHF:
The buyers managed to find their feet early on in the day yesterday, consequently bidding price above both the 0.99 hurdle and the H4 mid-way resistance point at 0.9950, and driving right into the hands of parity (1.0000). As is evident from the H4 chart, parity, as expected, provided the Swissy resistance, and has, at the time of writing, pushed prices back down to the 0.9950 region.
Now, from the weekly chart we can see that price came within a few pips of striking the yearly opening level at 1.0004, which happens to be positioned within a major supply zone drawn from 1.0092-0.9928. With that, traders would naturally imagine the H4 mid-way level 0.9950 is likely to give way, right? Not necessarily. In light of yesterday’s buying, daily supply at 0.9956-0.9921 was taken out and is now being retested as demand. Therefore, there is still an outside chance that the daily candles may rally from here and connect with 1.0037: a Quasimodo resistance.
Our suggestions: Taking into account how well bid the US dollar has been since Trump prevailed, we believe the dollar could remain bullish from the current daily demand. Given that, would we trade based on this assumption? No! Especially considering what we’ve noted on the weekly chart!
In regard to shorting this market, however, a firm daily close beyond the daily demand base is required before we’d consider becoming sellers here.
Data points to consider: US Retail sales at 1.30pm and FOMC member Fischer speaks at 6.30pm GMT.
Levels to watch/live orders:
- Buys: Flat (stop loss: N/A).
- Sells: Flat (stop loss: N/A).
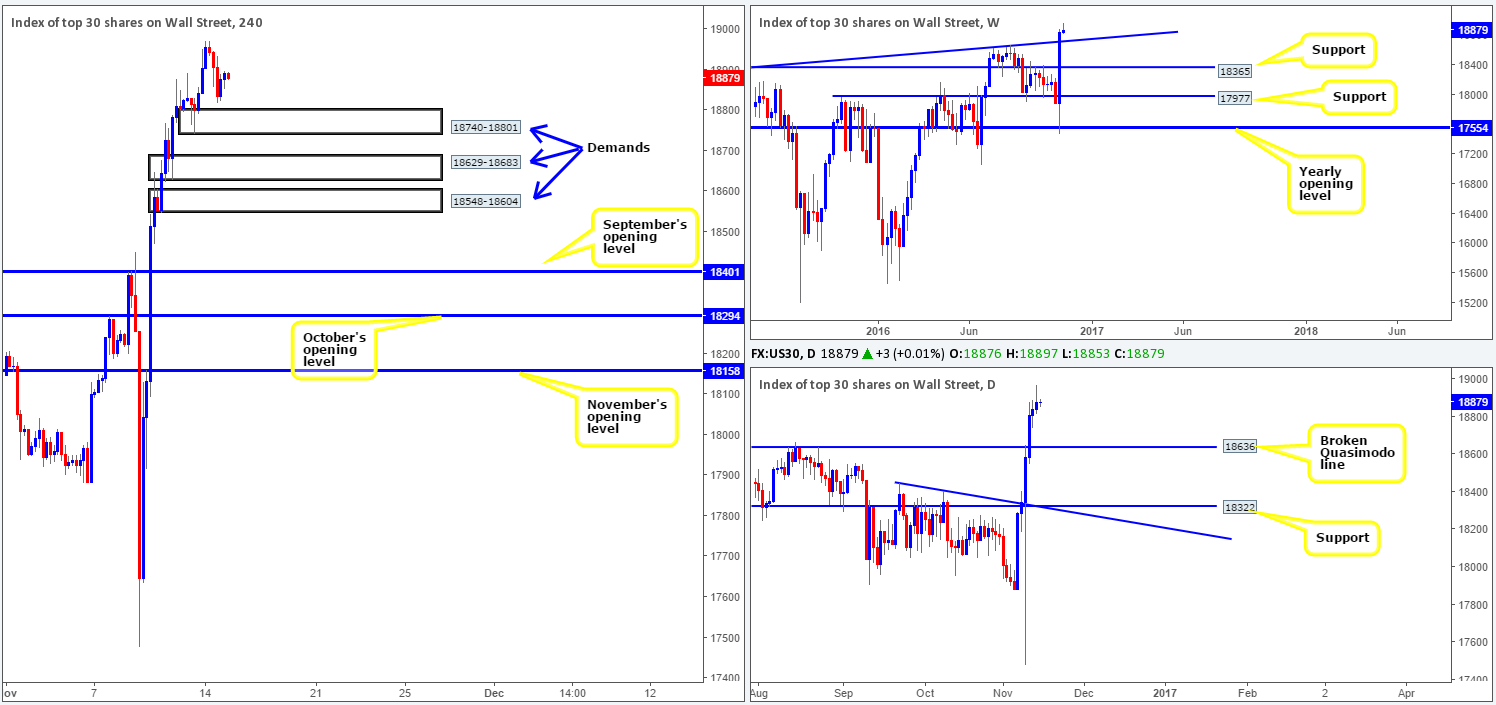
DOW 30:
Recent action saw equities top out going into the early hours of the London segment yesterday, forcing the index down to lows of 18817. Despite yesterday’s selloff, the unit still succeeded in clawing out its sixth consecutive daily gain. With that in mind, much of the following report will echo thoughts put forward in Monday’s analysis.
To our way of seeing things, the overall tone remains biased to the upside. We have three noted areas of interest this morning. The first, the lowest of the three, comes in at 18548-18604: a H4 demand which was formed following the break of the daily Quasimodo resistance level at 18636 (the next downside target on the daily timeframe). The second, the middle of the three is seen at 18629-18683: a H4 demand base that intersects beautifully with the weekly trendline support extended from the high 18365 (the next downside target on the weekly timeframe), boosting its appeal for longs. The third area drawn from 18740-18801, which is also a H4 demand barrier unfortunately has little higher-timeframe significance so is, in our book, liable to be faked should price reach this low.
Our suggestions: In light of the higher-timeframe picture displaying room to continue advancing north, the two lower H4 demands are stable enough zones to consider entering at market given their connection with the higher timeframes. The upper area, whilst it has no connection to the bigger picture, could still react. However, we’d advise waiting for at least a H4 bullish close to form prior to pulling the trigger here to avoid the possibility of getting caught on any fakeout.
Data points to consider: US Retail sales at 1.30pm and FOMC member Fischer speaks at 6.30pm GMT.
Levels to watch/live orders:
- Buys: 18740-18801 ([reasonably sized H4 bullish close required prior to pulling the trigger] stop loss: ideally beyond the trigger candle). 18629-18683 ([a possible area to consider entering at market from] stop loss: 18618). 18548-18604 ([a possible area to consider entering at market from] stop loss: 18537).
- Sells: Flat (stop loss: N/A).
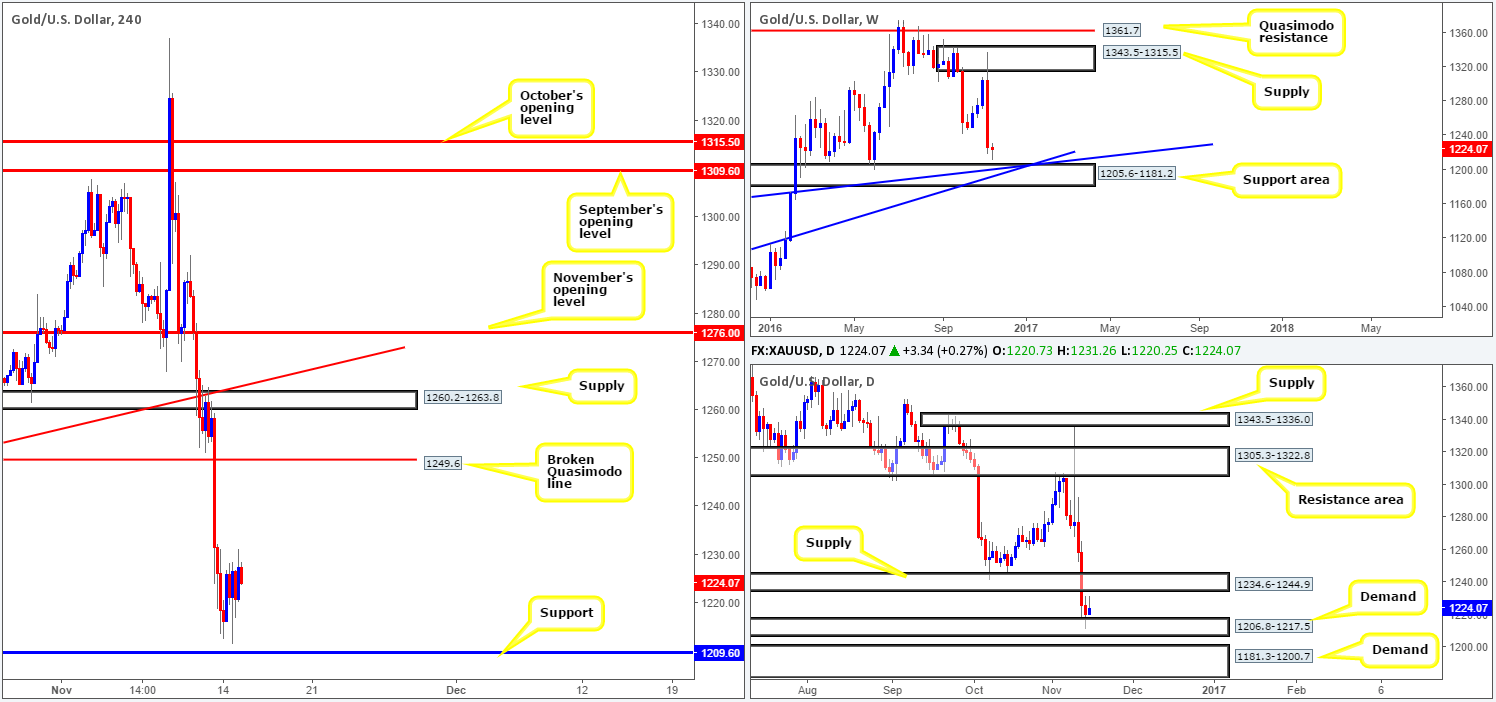
GOLD:
Although the daily candles seem to have found support around the top edge of a daily demand area at 1206.8-1217.5, offers at 1234.6, the underside of a daily supply area, are still potentially problematic. Additionally, up on the weekly chart, we can see that price has bottomed just ahead of a major support seen at 1205.6-1181.2, which not only stretches as far back as mid-June 2015, but also happens to coincide with two trendline supports (1130.1/1071.2). Slipping across to the H4 chart, we can see that the yellow metal caught a bid just ahead of a support barrier coming in at 1209.6, followed closely by another H4 support registered at 1201.2.
Despite the daily candles teasing the top edge of demand at 1206.8-1217.5, we feel further downside is likely on the cards to daily demand at 1181.3-1200.7. The reason as to why simply comes down to the weekly chart showing room to drive south down to the weekly support area at 1205.6-1181.2, which is located below the current daily demand.
Our suggestions: Between 1200.7 (the top edge of the daily demand mentioned above) and the current H4 support 1209.6 is, at least in our opinion, a reasonably nice-looking buy zone. It is certainly somewhere we anticipate a bullish presence since it is associated with the current weekly support area! With this being the case, our desk will be watching for a reasonably sized H4 bullish candle to take shape between 1200.7/1209.6. Should this come to fruition, we would, dependent on the time of day, look to enter long with stops ideally placed beyond the trigger candle.
Levels to watch/live orders:
- Buys: 1200.7/1209.6 ([reasonably sized H4 bullish close required prior to pulling the trigger] stop loss: ideally beyond the trigger candle).
- Sells: Flat (stop loss: N/A).


