
EUR/USD:
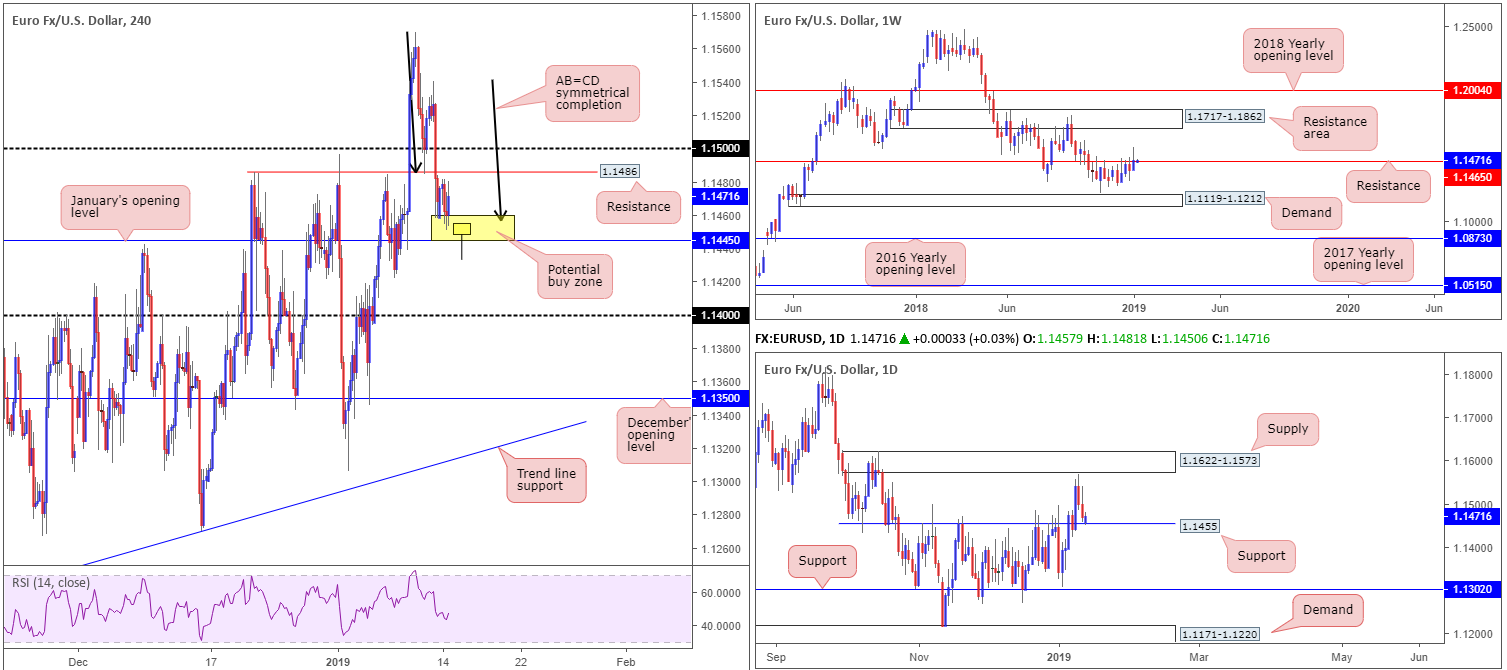
The single currency traded sideways against its US counterpart throughout its session Monday, taking cues from a docile dollar and sidestepping lower-than-expected industrial production figures.
Traders who read Monday’s briefing may recall the piece highlighting the yellow H4 zone at 1.1445/1.1460 as a potential platform for buyers. Though the area (comprised of reasonably attractive confluence: a H4 AB=CD symmetrical completion point around 1.1460s [black arrows], January’s opening level [also positioned on the H4] at 1.1445 and daily support at 1.1455) is holding ground, the research team remains troubled by weekly resistance at 1.1465. Traders are urged not to overlook the weekly resistance level based on last week’s push to highs of 1.1569, as the barrier boasts strong historical significance dating as far back as early February 2015. In addition to this, there’s also some concern surrounding the nearby H4 resistance level priced in at 1.1486 and the 1.15 handle.
Areas of consideration:
In light of the above reading and Monday’s movement seen defending the top edge of the yellow H4 zone mentioned above at 1.1445/1.1460, buyers are clearly active in spite of the threat of selling from weekly resistance (see above).
As underlined in Monday’s report, traders are urged to wait for additional confirmation to form before pressing the buy button in a bid to help overcome the threat of weekly selling.
A bullish candlestick pattern that forms within the lower limits of the buy zone, for example, would serve well (see chart for a visual image: a pin-bar formation), offering a defined entry and exit point. By entering lower within the H4 buy zone, traders are able to target more favourable risk/reward numbers.
In regards to targets out of 1.1445/1.1460, keep eyes on H4 resistance at 1.1486/1.15 as an initial take-profit zone.
Today’s data points: ECB President Draghi Speaks; US PPI m/m and Core PPI m/m; FOMC Member George Speaks.
GBP/USD:
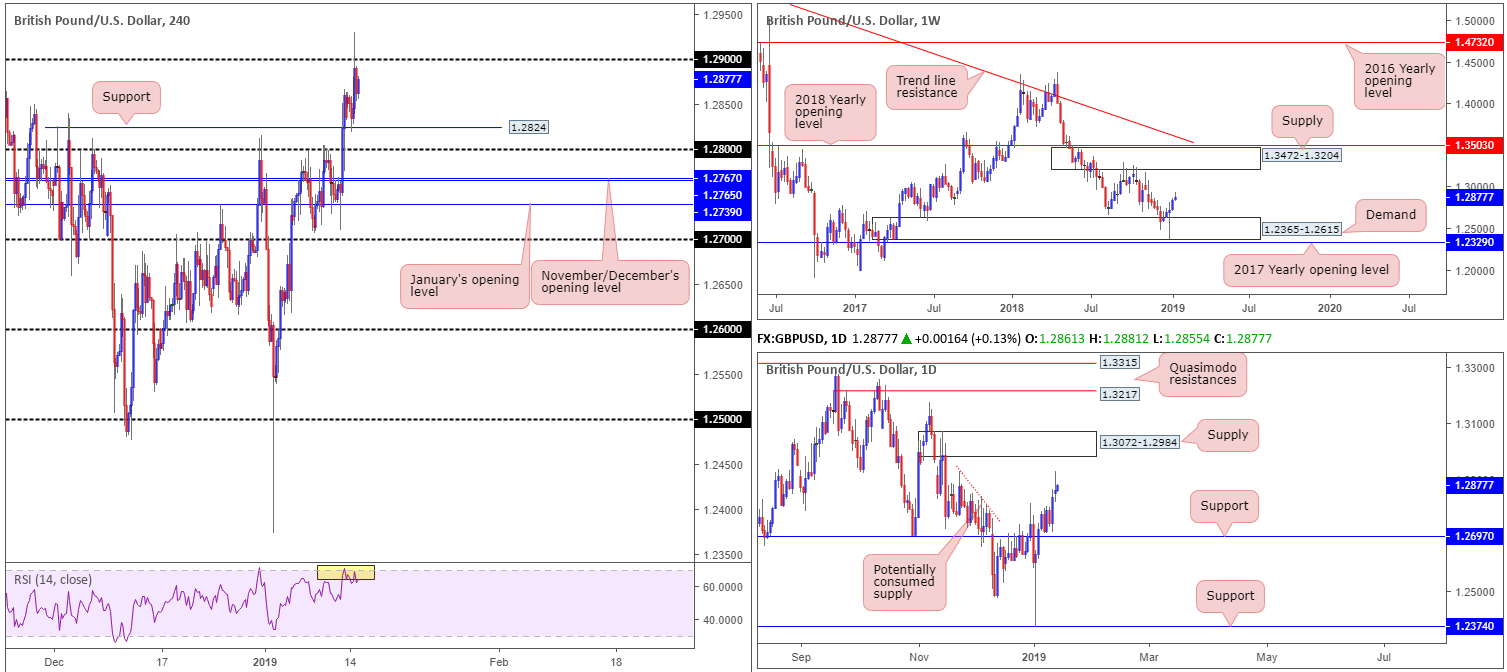
The GBP/USD clocked highs of 1.2929 amid early US trade Monday, following headlines that ERG Brexiteers will be voting with Theresa May and the government today. The source was later denied by Conservative lawmaker Steve Baker, who, as part of the ERG, stated they are planning to vote against the deal. This witnessed the market pullback and reclaim 1.29 to the downside, settling around 1.2861 into the close (+0.08%).
For those who read Monday’s briefing, our technical report highlighted a long opportunity from H4 support at 1.2824/the 1.28 handle. Well done to any of our readers who managed to jump aboard this move. We liked this area due to both the weekly and daily charts displaying room to press higher. A run towards supply painted at 1.3472-1.3204 may be in store over the coming weeks, after weekly price respected demand coming in at 1.2365-1.2615. In conjunction with weekly movement, daily activity concluded recent trade closing firmly above resistance priced in at 1.2697 (now acting support).Continued buying from this point could lead to a test of supply at 1.3072-1.2984, according to our technical studies. Above 1.2697, limited supply is visible, with a major portion likely consumed as price declined lower in late November of 2018 (see red descending line).
Areas of consideration:
Today is likely to bring with it robust market movement, particularly in the GBP/USD market. Three possible outcomes to today’s Brexit vote are: UK PM May wins, the PM loses by a narrow margin and the PM loses by a wide margin.
Should May win (highly unlikely), the research team expects sterling to advance as far north as 1.35ish. If May loses by a narrow margin, expect a pop towards 1.30ish. And if the PM loses by a wide margin we’re looking at the 1.25 area.
We expect the British Pound to see plenty of volatility today, with the possibility of wider spreads and price gaps throughout this risk event. For that reason, traders are urged to trade with caution.
Today’s data points: UK Parliament Brexit Vote; US PPI m/m and Core PPI m/m; FOMC Member George Speaks.
AUD/USD:
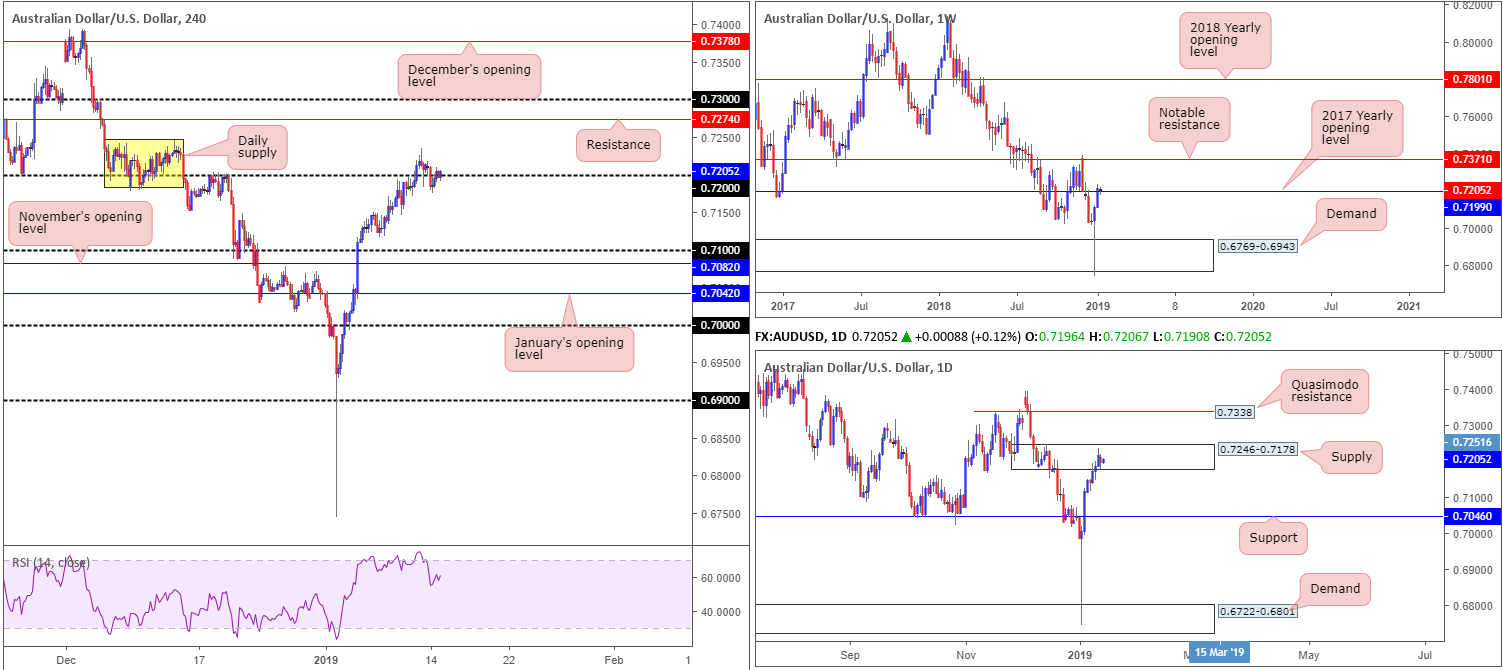
Down 0.20% on the day, the Australian dollar traded in a subdued fashion Monday against its US counterpart. Despite disappointing Chinese trade balance in which exports unexpectedly fell 4.4%, and imports marked the largest decline since July 2016, the AUD/USD H4 candles spent the day cycling around its 0.72 region.
In view of the somewhat lackluster performance, much of the following piece will echo similar thoughts put forward in Monday’s briefing.
From the top of the pile, we can see weekly flow engaging with its 2017 yearly opening level at 0.7199 after suffering a marginal breach to the upside last week. Should buyers remain in the driving seat here this week, notable resistance at 0.7371 is in range.
Contrary to weekly structure, daily supply at 0.7246-0.7178 remains in the picture and could possibly hamper upside this week. Failure to hold, however, not only confirms bullish strength above the 2017 yearly opening level at 0.7199 on the weekly timeframe, it also frees upside in the direction of a daily Quasimodo resistance at 0.7338.
Areas of consideration:
Having seen 0.72 fail to offer support Monday, intraday buyers are likely fearful here. This is likely a combination of sub-standard Chinese data, a docile greenback and daily technical supply mentioned above at 0.7246-0.7178.
In view of recent movement, the research team is cautious in this market. Before considering a long in this market, waiting for a H4 close above the aforementioned daily supply is recommended. This, in theory, is likely to clear out sellers from within the zone and open up the path north for further buying. Should the market observe a using) are considered high probability, targeting H4 resistance at 0.7274 as the next upside target.
Today’s data points: US PPI m/m and Core PPI m/m; FOMC Member George Speaks.
USD/JPY:
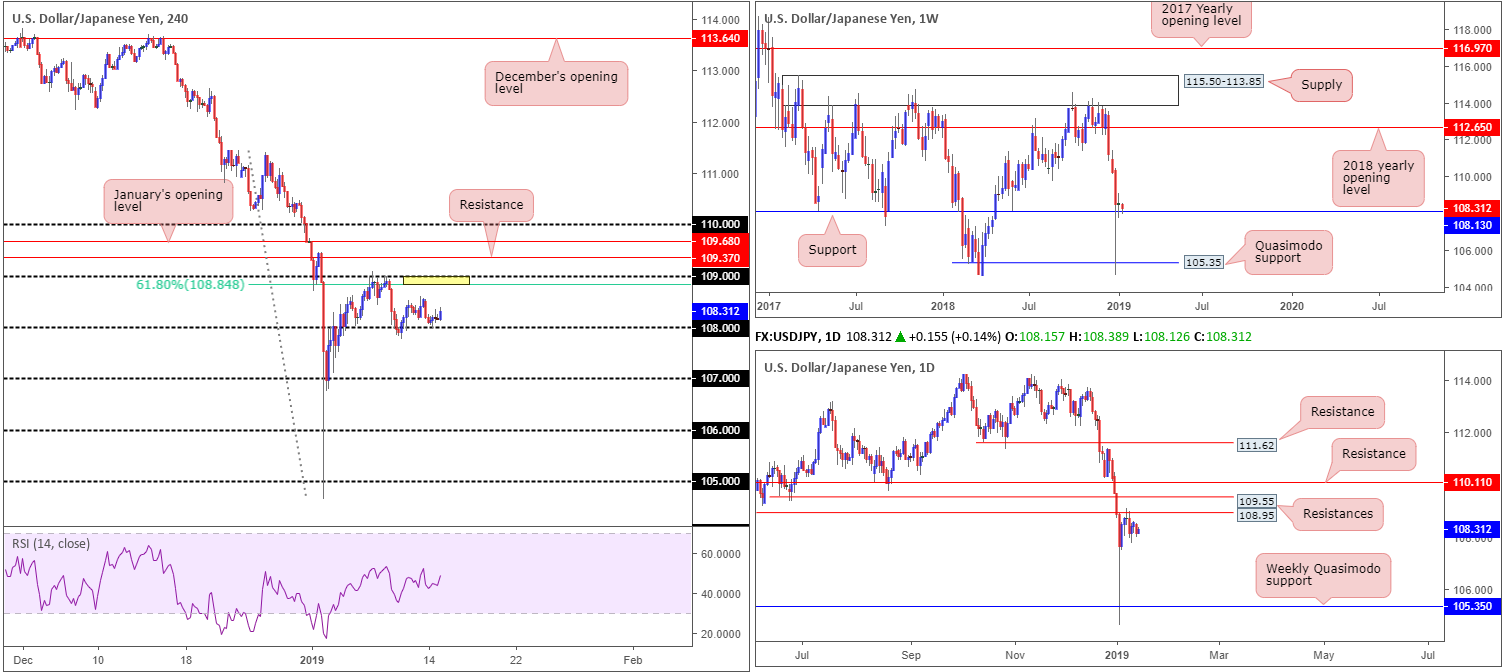
In lockstep with US equities, the USD/JPY began the week on a negative footing. Under pressure from disappointing data out of China in early Asian hours ignited demand for the safe-haven Japanese yen.
Following a slump towards 108 on the H4 timeframe, the candles established support and staged a modest recovery, though still concluded Monday’s session down 0.32%. The 109 handle remains in the firing range as a viable upside target, according to our technical studies, given it joins closely with a 61.8% Fibonacci resistance value at 108.84 (yellow).
Support emerging from 108 is likely a mixture of a tame US dollar, technical buying off the 108 round number and longer-term buyers entering the fold off weekly support at 108.13. The only grumble, technically speaking, for the buyers right now is daily resistance at 108.95 (a Quasimodo support-turned resistance that merges beautifully with the 109 handle highlighted above on the H4 scale) currently capping upside. In addition to this, another layer of daily resistance (also a Quasimodo support-turned resistance) is seen directly above at 109.55.
Areas of consideration:
On the whole, the technical setting presented here offers a somewhat bullish bias until we shake hands with 109ish. Weekly price is establishing support off 108.13, H4 action defending its round number 108 and daily movement displaying room to press as far north as resistance at 108.95.
Therefore, the research team will be keeping a close eye on how H4 action responds from 108 today. An ideal condition would be for a H4 bullish candlestick formation to print. This – coupled with the surrounding support and room to press higher – is likely enough to entice buyers into the market towards 109 today. This not only offers traders a defined entry and exit point, it also shows whether or not buyers are active.
Today’s data points: US PPI m/m and Core PPI m/m; FOMC Member George Speaks.
USD/CAD:
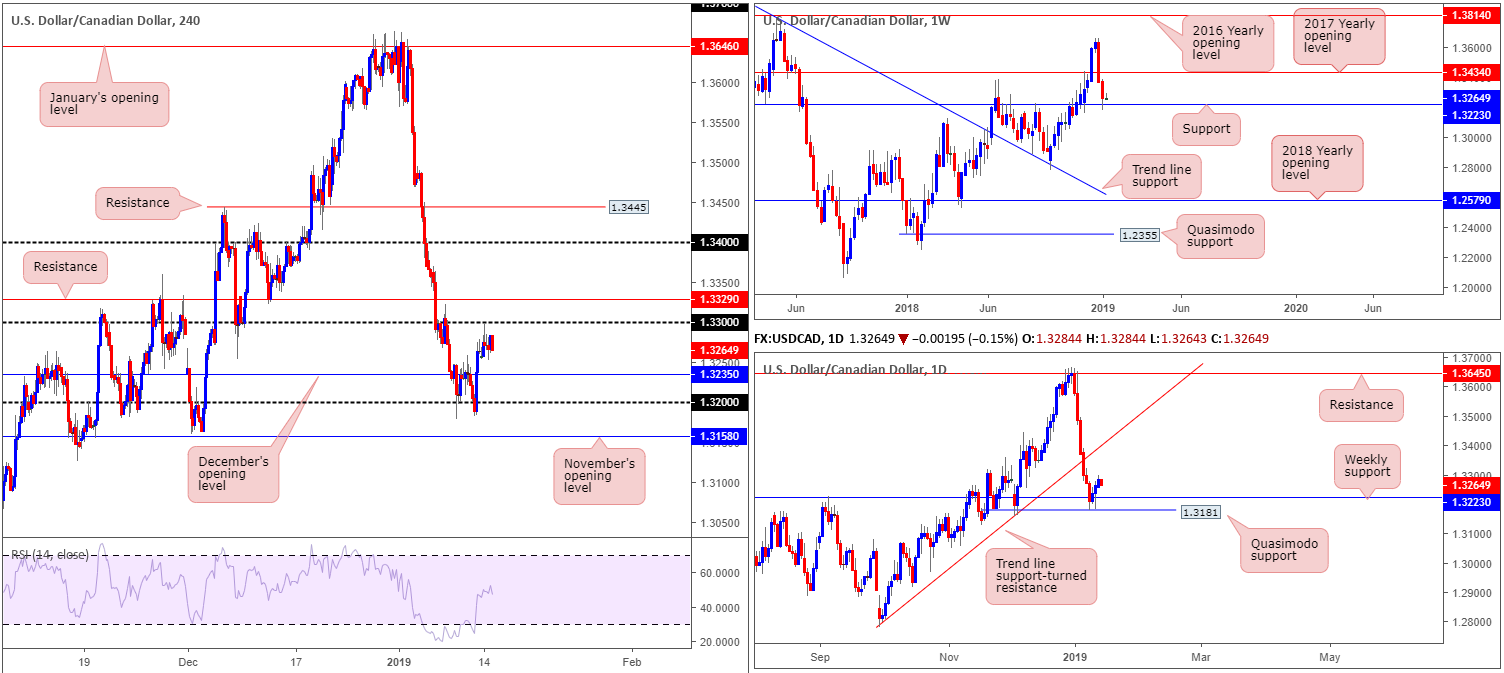
Having seen the US dollar index offer little in terms of movement Monday, and WTI record its second consecutive day in negative territory, the USD/CAD popped higher for a third consecutive daily session.
From a technical standpoint this was an expected move. For weekly traders, support at 1.3223 is currently offering a floor to base potential longs from. The next upside objective from this point falls in at 1.3434: the 2017 yearly opening level.
Closer analysis of this market on the daily timeframe reveals the unit shook hands with a daily Quasimodo support at 1.3181 last week. This level, as you can see, is situated just south of the current weekly support level. As long as the buyers continue to defend the said supports, the next port of call to the upside from here falls in around trend line support-turned resistance (extended from the low 1.2782).
Areas of consideration:
Although both weekly and daily structure suggest buyers are in the driving seat, entering long on the H4 timeframe is precarious. Not only do we have to contend with nearby resistance at 1.33, there’s also another layer of resistance positioned directly overhead at 1.3329.
With the above in mind, the research team feels waiting for a H4 close to form above 1.3329 before looking to buy this market is a logical path to explore. This would not only confirm bullish intent on the bigger picture, it’d also clear upside on the H4 scale towards 1.34ish which aligns nicely with the daily trend line support-turned resistance highlighted above.
Aggressive traders will likely enter on the close of a H4 breakout candle above 1.3329 and locate stops beneath the candlestick’s tail. Conservative traders, on the other hand, may opt to wait and see if a retest of 1.3329/1.33 takes shape before pulling the trigger (stop-loss orders can be positioned below the rejecting candle’s tail or beneath 1.33).
Today’s data points: US PPI m/m and Core PPI m/m; FOMC Member George Speaks.
USD/CHF:
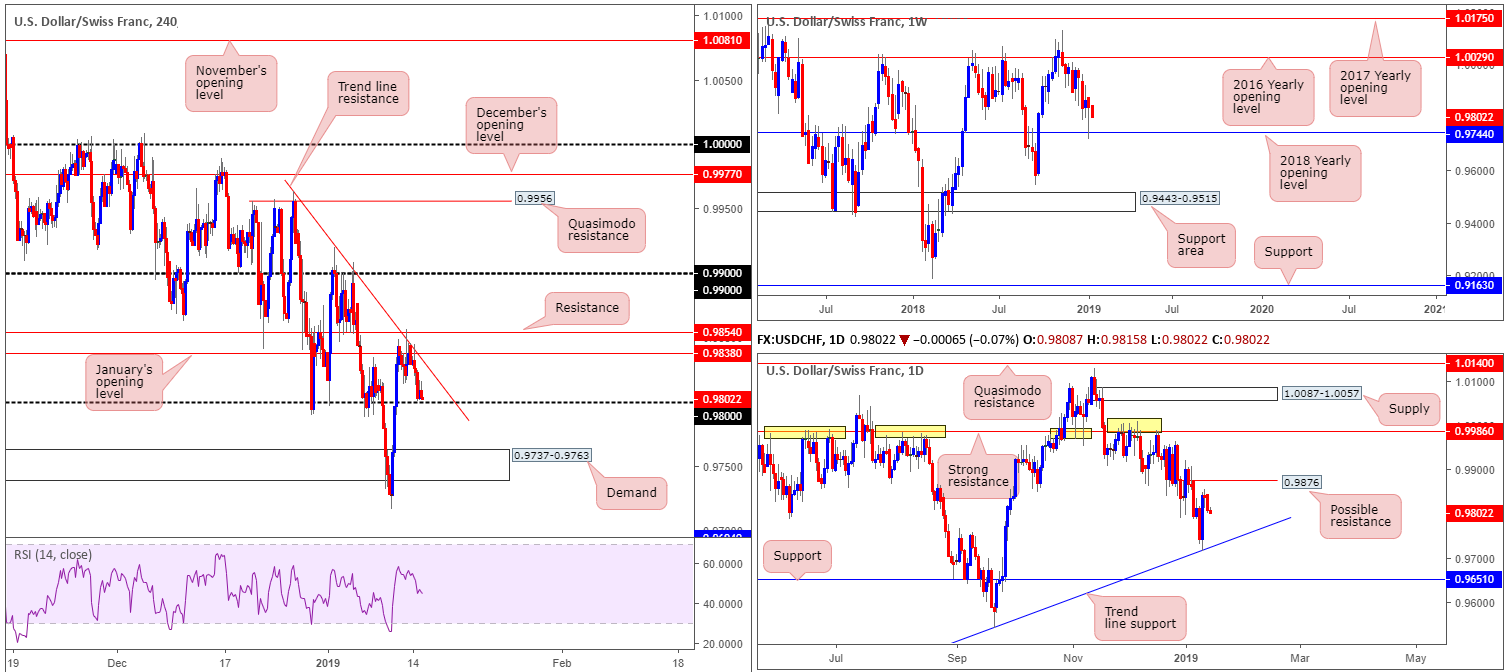
Disappointing trade data out of China and industrial production data from the Eurozone triggered a flight to safety Monday, favouring the Swiss franc.
H4 resistance at 0.9854 along with its converging H4 trend line resistance (extended from the high 0.9963), and January’s opening level at 0.9838, as you can see, held firm in recent trade. Selling pressure from these areas weighed on the USD/CHF, bringing the H4 candles to lows just north of 0.98 into Monday’s close. In the event further losses are observed today, 0.98 is likely to be engulfed and H4 demand at 0.9737-0.9763 likely to be brought into the mix. Although this H4 demand suffered a breach to its lower edge last week, there are potentially still active buyers remaining here based on unfilled orders from traders unable to buy following the fakeout lower.
Our technical reading on the weekly timeframe reveals price tested its 2018 yearly opening level at 0.9744 last week and recovered in robust fashion. Although forming in the shape of a bullish pin-bar formation, buyers appear to be struggling at this point. In terms of where we stand on the daily timeframe, the candles are meandering between a daily trend line support (taken from the low 0.9187 – merges with the current weekly support at 0.9744) and daily resistance at 0.9876.
Areas of consideration:
At current price, we do not see a whole lot to hang our hat on.
Sub 0.98 into H4 demand at 0.9737-0.9763, however, is an interesting area for a possible bounce higher today. Not only does the zone house weekly support at 0.9744, it also fuses closely with daily trend line support highlighted above. Should H4 price test this area today and chalk up a reasonably nice-looking bullish candlestick formation (entry/stop parameters can be defined from this structure), a round of buying towards at least 0.98 is likely on the cards.
Today’s data points: US PPI m/m and Core PPI m/m; FOMC Member George Speaks.
Dow Jones Industrial Average:
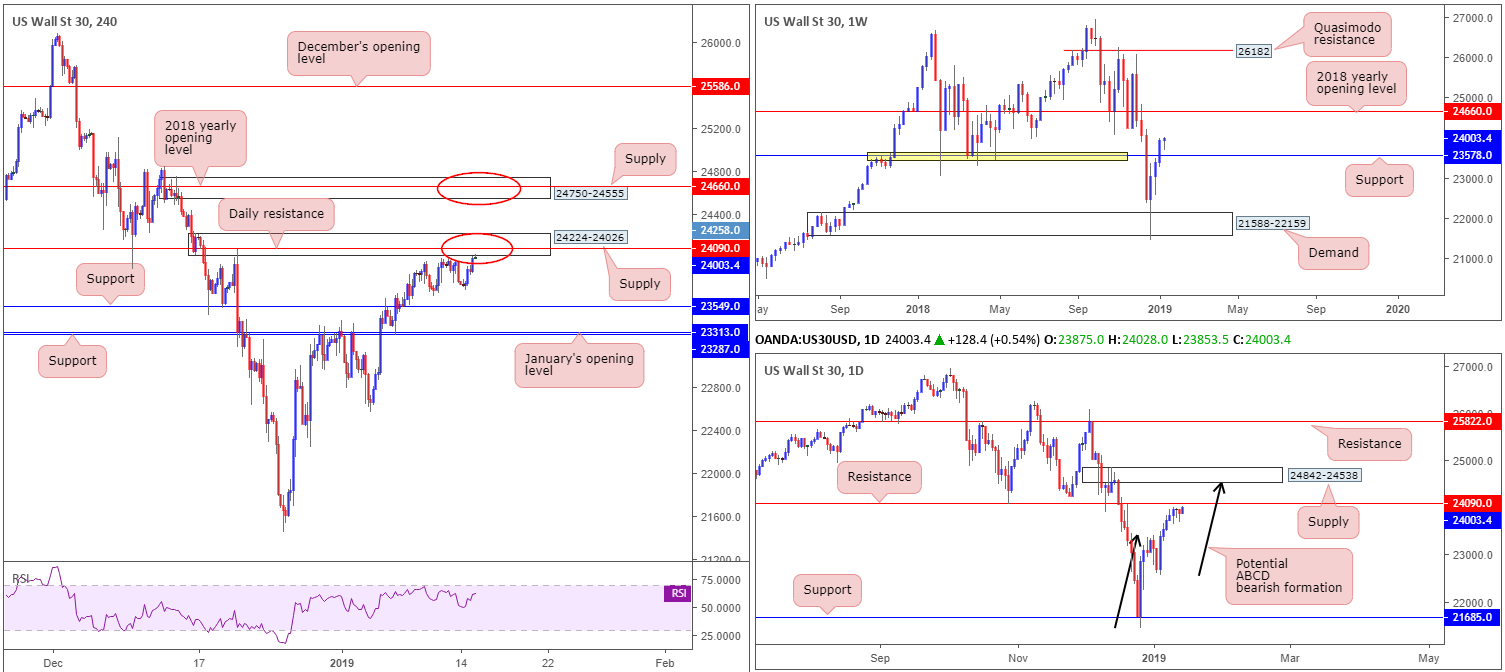
In recent hours, the H4 candles crossed swords with supply priced in at 24224-24026 and appears to be holding, as we write. What’s interesting about this area from a technical perspective is it engages with daily resistance coming in at 24090. As a result, the market could observe a pullback take shape from this area today.
An alternative to the above is the next layer of H4 supply seen at 24750-24555. This area houses the 2018 yearly opening level on the weekly timeframe at 24660, and is firmly positioned within the walls of a daily supply zone at 24842-24538. In addition to this, the daily supply has the added bonus of being accompanied by a daily ABCD approach (black arrows).
Areas of consideration:
On account of the above, there are two clear supply areas worthy of attention for potential shorts: 24224-24026 and 24750-24555. As highlighted above, both zones display higher-timeframe convergence, though the upper area at 24750-24555 has the edge in terms of confluence, according to our technical drawings. That does not mean to say the lower H4 supply at 24224-24026 will not hold price, though. To help avoid an unnecessary loss, however, it might be worth considering entering on the back of bearish candlestick confirmation. This not only offers traders a defined entry and exit point, it also shows whether or not sellers are active.
The first take-profit target from 24224-24026 falls in around H4 support at 23549.
Today’s data points: US PPI m/m and Core PPI m/m; FOMC Member George Speaks.
XAU/USD (Gold):
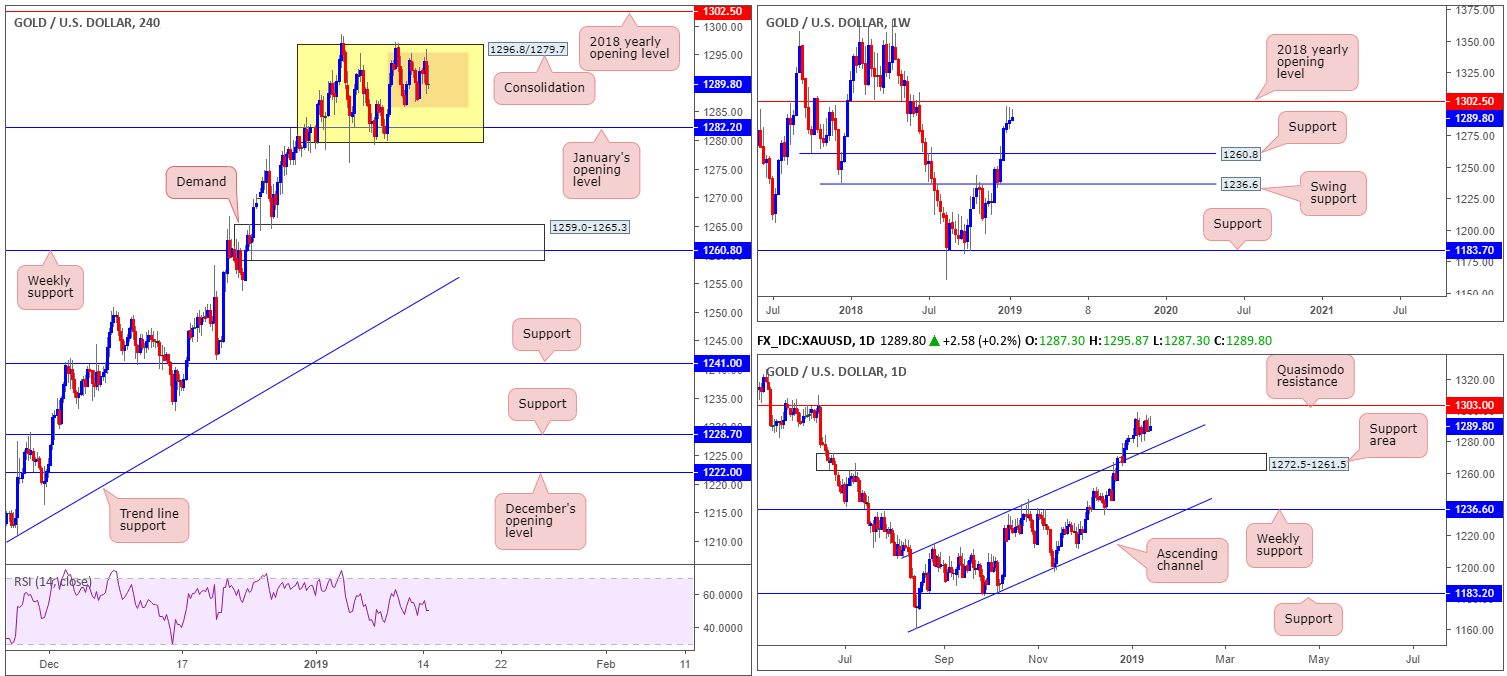
Bullion offered little to shout about Monday, ranging between 1295.4/1285.8: a small H4 consolidation (brown) that begun forming Thursday last week. Traders may also want to acknowledge the surrounding landscape, molded in the shape of larger consolidation (yellow) seen at 1296.8/1279.7. Inside the lower limits of this range, it’s also worth keeping an eye on January’s opening level at 1282.2 as this number could serve as support at a point over the coming week.
Beneath 1296.8/1279.7, space for the sellers to stretch their legs towards H4 demand plotted at 1259.0-1265.3 is visible, which happens to fuse nicely with weekly support at 1260.8. Note this H4 demand is also sited within the lower limits of the daily support area coming in at 1272.5-1261.5. It might also be worth mentioning before we reach the aforementioned H4 demand, daily buyers may try to defend the channel resistance-turned support (etched from the high 1214.3) that’s positioned just north of the said daily support area.
Above the current H4 range, however, we have the 2018 yearly opening level positioned nearby at 1302.5 (weekly timeframe), shadowed closely by a daily Quasimodo resistance at 1303.0.
Areas of consideration:
Over the past week, the yellow metal has served well as a range trader’s sanctuary on the H4 scale. Given the recent strength of gold over the past couple of weeks, however, a break of this range to the upside is possible this week. Should this come to fruition, traders’ crosshairs will likely be fixed on the 2018 yearly opening level mentioned above at 1302.5/daily Quasimodo resistance for medium/long-term short posiitons. Irrespective of this forecast, though, range traders will likely continue taking advantage of gold’s medium-term position until the extremes of the H4 range (yellow) are violated.
For those interested in trading the current H4 ranging motion, the research team recommends waiting for additional confirmation to form before pulling the trigger. A bullish/bearish candlestick signal would suffice. This not only offers traders a defined entry and exit point, it also shows whether or not buyers/sellers are active.
The use of the site is agreement that the site is for informational and educational purposes only and does not constitute advice in any form in the furtherance of any trade or trading decisions.
The accuracy, completeness and timeliness of the information contained on this site cannot be guaranteed. IC Markets does not warranty, guarantee or make any representations, or assume any liability with regard to financial results based on the use of the information in the site.
News, views, opinions, recommendations and other information obtained from sources outside of www.icmarkets.com.au, used in this site are believed to be reliable, but we cannot guarantee their accuracy or completeness. All such information is subject to change at any time without notice. IC Markets assumes no responsibility for the content of any linked site. The fact that such links may exist does not indicate approval or endorsement of any material contained on any linked site.
IC Markets is not liable for any harm caused by the transmission, through accessing the services or information on this site, of a computer virus, or other computer code or programming device that might be used to access, delete, damage, disable, disrupt or otherwise impede in any manner, the operation of the site or of any user’s software, hardware, data or property.


