
EUR/USD:
In recent sessions, China broadcasted its decision to hike tariffs on $60 billion worth of American imports despite US President Trump’s warnings, consequently escalating trade tension and weighing on the market sentiment.
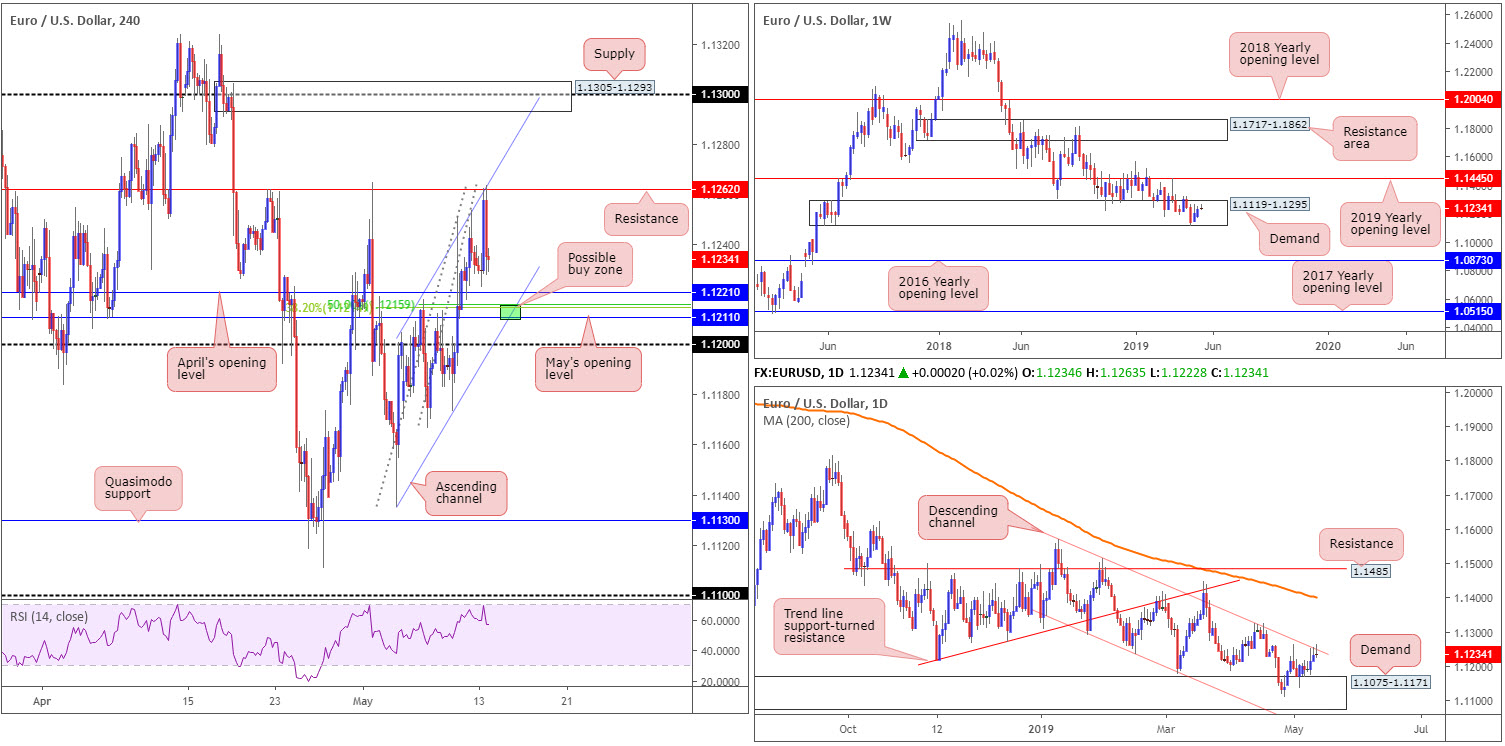
The euro gained ground at the expense of the dollar in early US hours Monday, though rapidly shook hands with sturdy resistance on both daily and H4 timeframes. H4 resistance came in at 1.1262, which, as you can see, has proven itself as a valid line since late April. In addition to this, the barrier merges with a channel resistance taken from the high 1.1204 and a daily channel resistance extended from its respective high 1.1569.
Although weekly players remain warring for position within the parapets of a long-standing demand zone at 1.1119-1.1295 (potentially absorbing sellers from the current daily channel resistance), the combination of daily and H4 resistance in motion was still likely appealing for many traders. Well done to any of our readers who managed to spot the confluence and cash in on the move.
The next downside target on the H4 timeframe can be seen at April’s opening level coming in from 1.1221, shadowed closely by May’s opening level at 1.1211 and the H4 channel support etched from the low 1.1135.
Areas of consideration:
A technically pleasing point on the H4 chart is seen around May’s opening level at 1.1211. The level combines (green) with a 38.2% Fibonacci retracement value at 1.1214, a 50.0% support value at 1.1215 and an intersecting channel support (highlighted above). While this area offers limited higher-timeframe convergence, a bounce is still likely to be observed owing to its locally supporting confluence.
Given the lack of higher-timeframe connection 1.1211 offers as support, however, traders are urged to consider waiting for additional confirmation to take shape before pulling the trigger (entry and risk parameters can be determined according to the selected confirmation technique).
Today’s data points: German ZEW Economic Sentiment; FOMC Members Williams and George Speak.
GBP/USD:
As we head into Tuesday’s Asia Pac time zone, the GBP/USD is nursing recent losses off 1.2950ish. Monday witnessed a wave of selling amid US trade after the US and China failed to rescue a last-minute deal to avoid the latest US tariff hikes. The market’s risk-off mood intensified, however, following China’s decision to retaliate against the US and raise tariffs.
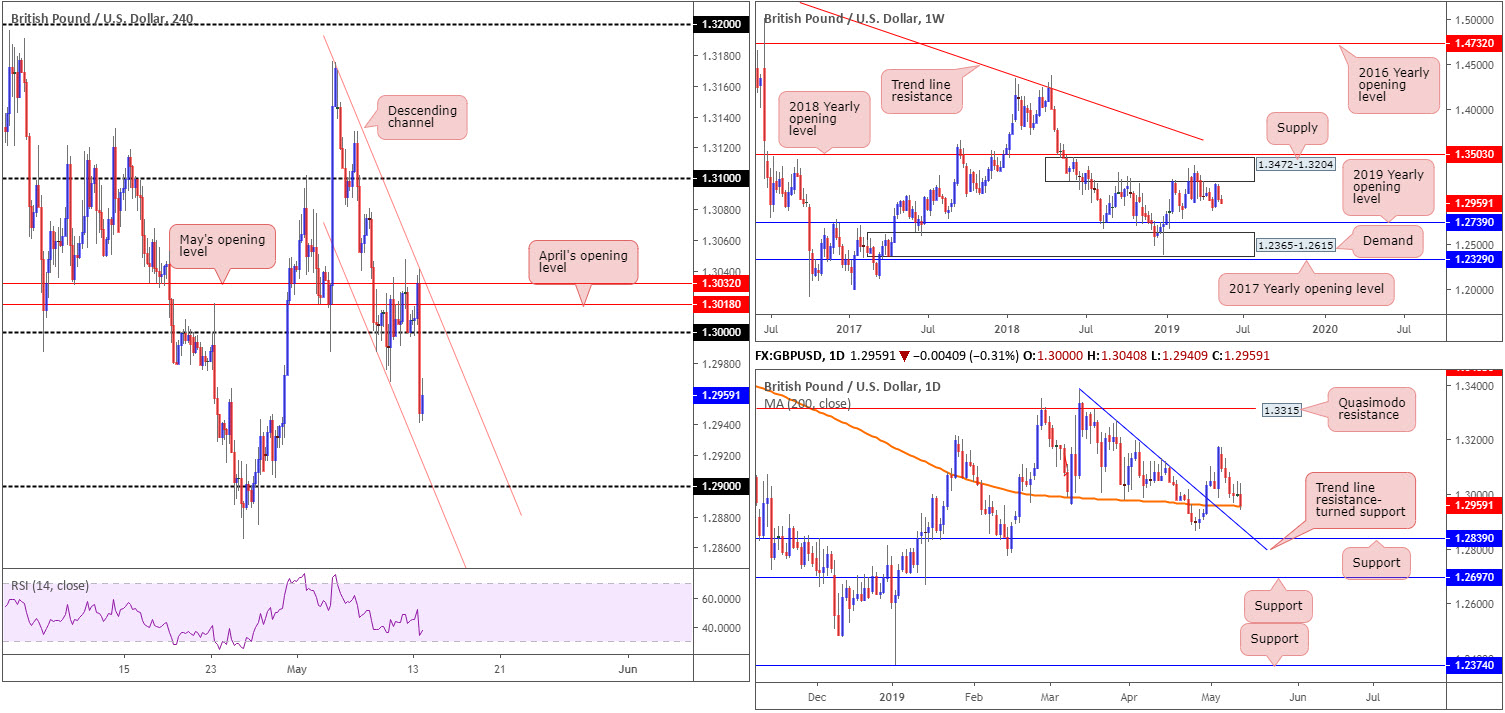
From a technical perspective, H4 action is languishing beneath the key figure 1.30, eyeing a possible run towards nearby channel support etched from the low 1.2987, followed closely by the round number 1.29. It might also be worth noting the RSI indicator is nearing its oversold value on this timeframe.
Higher up on the curve, weekly price continues to head lower after coming within touching distance of supply at 1.3472-1.3204 in recent trading, situated a few points south of the 2018 yearly opening level at 1.3503. Follow-through selling from this point could attempt an approach towards the 2019 yearly opening level at 1.2739, shadowed closely by a demand area at 1.2365-1.2615.
Closer analysis of price action on the daily timeframe shows the unit touching gloves with the 200-day SMA (orange). Traders may also wish to acknowledge the merging trend line resistance-turned support (extended from the high 1.3380) and support level at 1.2839, in the event we overthrow the SMA.
Areas of consideration:
Having seen the 200-day SMA enter the fold recently, there will already be traders long this market based solely on this connection. Conservative traders, however, may opt to wait and see how H4 action behaves before pressing the buy button, as the candles could just as easily dip lower to bring in fresh buyers from nearby H4 channel support (1.2987) and stop out ones who are currently long the market.
Irrespective of the entry technique applied, the first upside target in view is the underside of 1.30, which happens to unite closely with channel resistance on the H4 timeframe taken from the high 1.3176.
Today’s data points: UK Average Earnings Index 3m/y; UK Unemployment Rate; UK Claimant Count Change; FOMC Members Williams and George Speak.
AUD/USD:
The commodity-linked currency came under renewed pressure vs. its US counterpart Monday, in response to trade concerns. After the US boosted tariffs on China last week, the nation retaliated, announcing it was increasing tariffs on around 5000 US products.
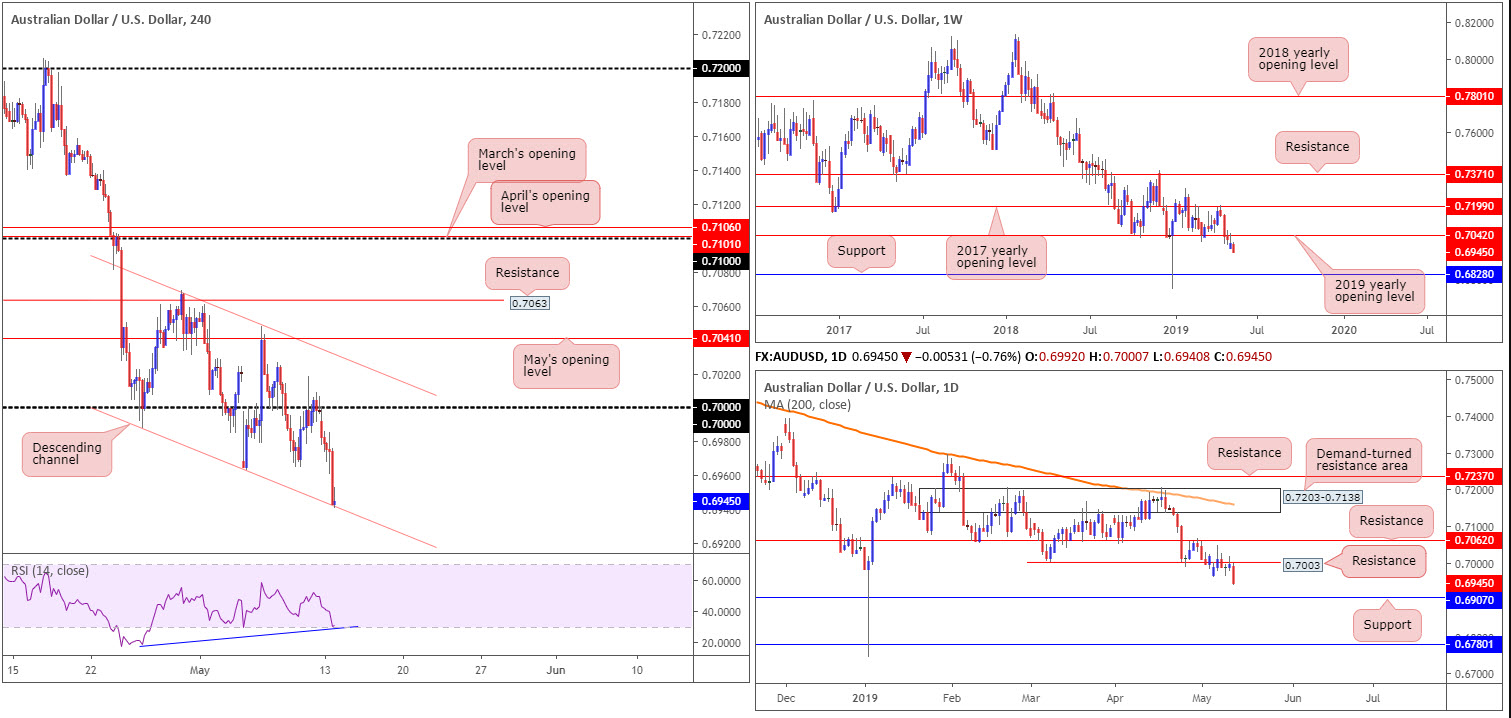
Distancing itself further from the underside of its 2019 yearly opening level at 0.7042 on the weekly timeframe, the pair is, according to our technical studies, starved of support until shaking hands with 0.6828.
Resistance coming in at 0.7003 on the daily timeframe remains in focus, with the possibility of further selling materialising in the direction of support pencilled in at 0.6907. Note 0.7003 is likely strengthened on the back of weekly sellers possibly in the mix from 0.7042 (see above).
Contrary to weekly and daily technicals, the H4 candles are knocking on the door of a channel support extended from the low 0.6988, confirmed by the RSI indicator offering positive divergence ahead of its oversold area (blue line) . As of current price, though, the buyers are struggling to make much headway. This could, as the higher timeframes suggest, call for a move towards the 0.69 handle (not seen on the screen).
Areas of consideration:
On account of the technical picture, entering long from the current H4 channel support line is a chancy move, even with confirming RSI divergence. With that being the case, price action is likely to engulf the said channel and head for 0.69 (remember daily support also comes in at 0.6907). To take advantage of this move, traders could sell the breakout candle and position a protective stop-loss order beyond its upper shadow, or wait and see if a retest develops and enter on the back of the rejecting candle’s structure. Whichever technique is employed, ensure risk/reward provides more than a 1:1 ratio to 0.6907.
Today’s data points: FOMC Members Williams and George Speak.
USD/JPY:
Risk aversion dominated global markets Monday, following the escalation of the US-China trade war. This paved the way for the Japanese yen to push higher against the US dollar in a safe-haven bid, as global equity indexes wrapped up Monday in a sea of red.
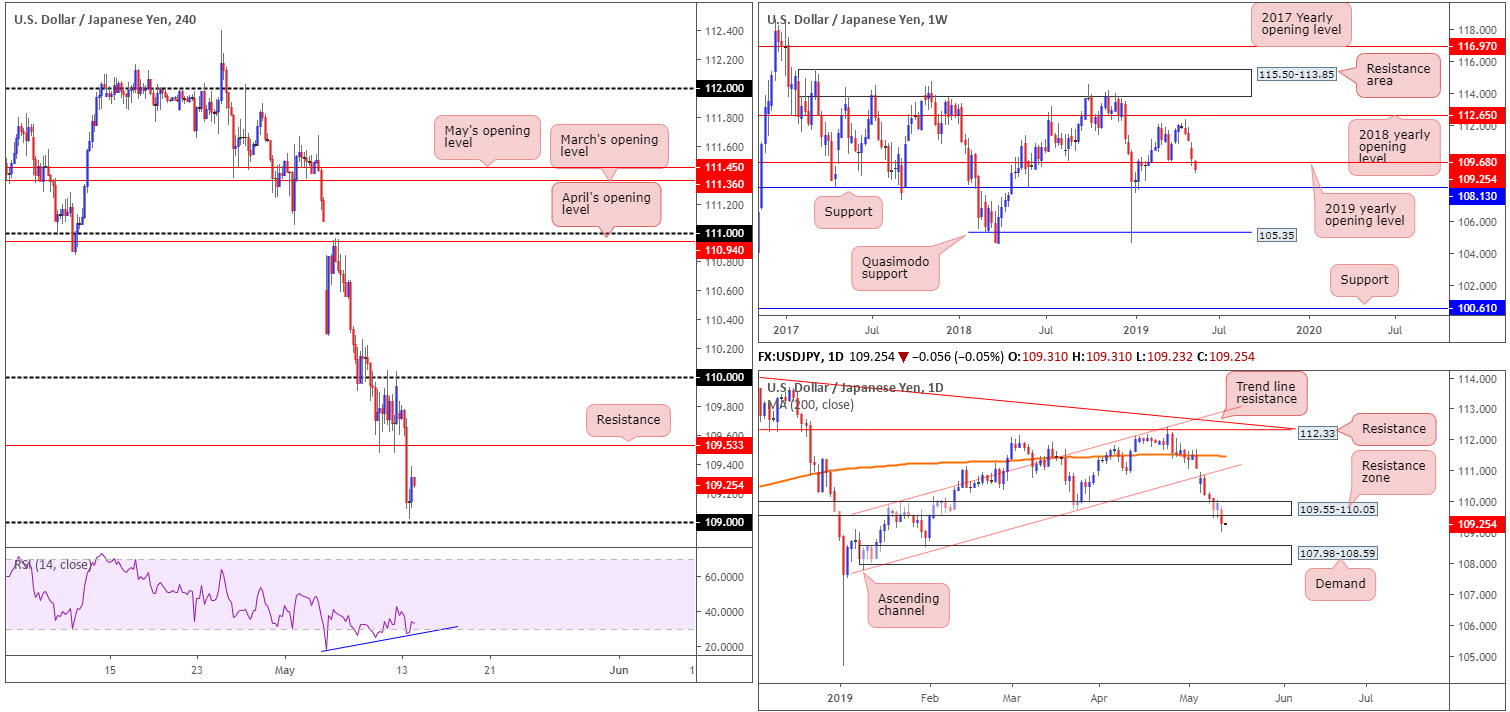
Down more than 0.50% on the day, the technical side of things show weekly price crossed below its 2019 yearly opening level at 109.68, possibly exposing support coming in at 108.13. In conjunction with weekly movement, daily activity punched beneath its support area at 109.55-110.05 (now an acting resistance zone) and potentially cleared the runway south towards a demand based at 107.98-108.59.
Confirmed by a positive divergence/oversold reading (blue line), price action on the H4 timeframe is seen turning higher just north of the 109 handle after smashing through support above at 109.53 (now acting resistance). Having observed weekly and daily price press through supportive structures, a retest of the current H4 resistance might be in order today.
Areas of consideration:
In view of all three timeframes, the research team feels the pendulum is swinging in favour of the sellers at this time.
A retest of H4 resistance at 109.53 by way of a H4 or H1 bearish candlestick formation – think shooting star or bearish engulfing pattern – would, owing to the higher-timeframe picture, likely be sufficient evidence to generate seller interest in this market (traders can determine entry and risk levels according to the selected candlestick’s rules of engagement), targeting 109 as the initial take-profit zone.
Today’s data points: FOMC Members Williams and George Speak.
USD/CAD:
The US dollar rose in response to a weaker Canadian dollar Monday, thanks to crude oil prices dipping back beneath its $61.00/bbl mark.
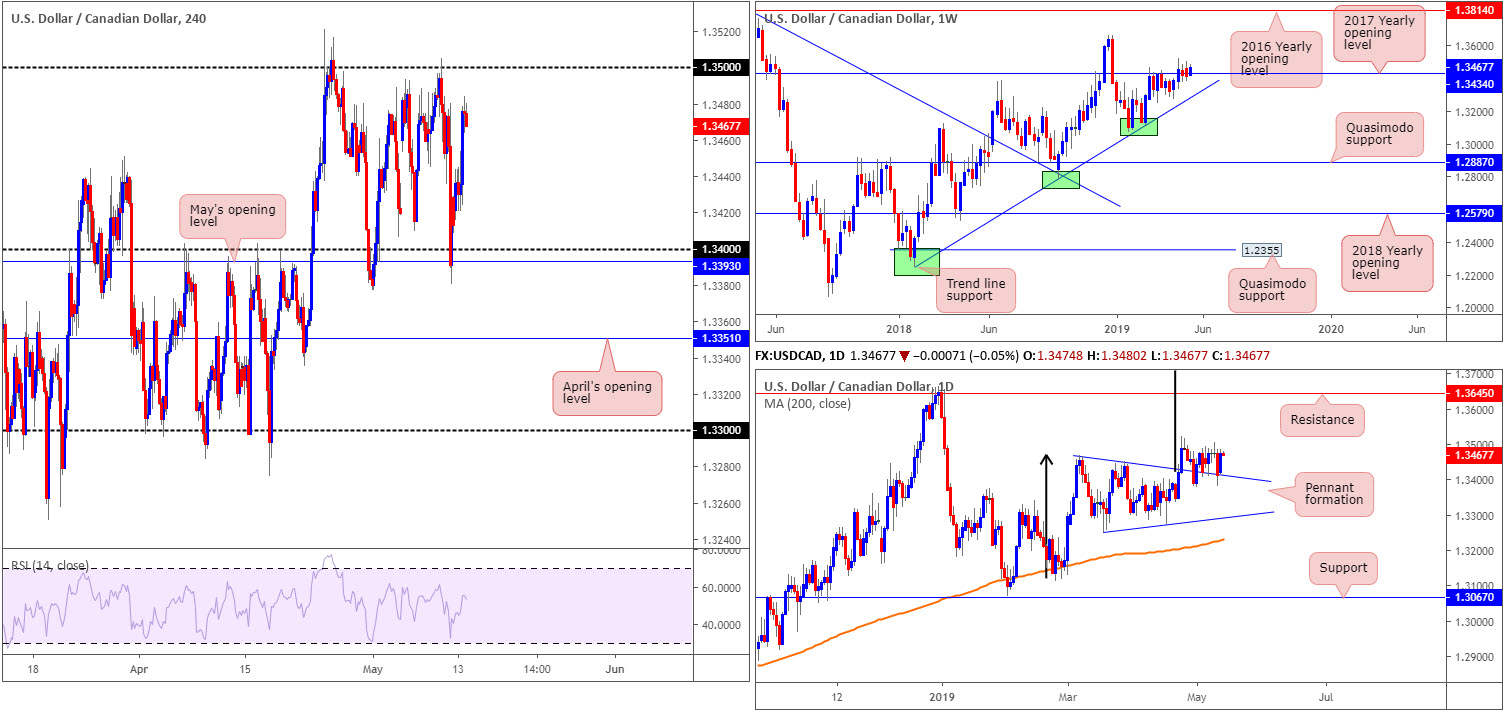
Testing highs of 1.3484 and erasing all of Friday’s losses, the H4 candles are seen poised to approach, and perhaps overthrow, the 1.35 handle. Note the H4 timeframe has been entrenched within a range between 1.34/May’s opening level at 1.3393 and 1.35 since late April. The next area of resistance beyond 1.35 falls in around 1.3570 (not seen on the screen).
On a wider perspective, weekly price is seen establishing ground above its 2017 yearly opening level at 1.3434, heightening the idea we may push in the direction of the 2018 yearly high of 1.3664.
Closer analysis of price action on the daily timeframe shows the unit continues to feed off support drawn from the top edge of a pennant pattern (1.3467). Although the traditional price target (calculated by taking the distance from the beginning of the preceding move and adding it to the breakout price) remains on the chart at 1.3768 (black arrows), the next upside target from a structural standpoint falls in around resistance at 1.3645.
Areas of consideration:
In the event further buying develops, the market may observe a H4 close form above 1.35. Should this occur, traders have the choice of either buying the breakout candle and placing stop-loss orders beneath its tail, or waiting and seeing if a retest scenario takes shape and entering on the back of the rejection candle’s structure.
As highlighted above, the next bordering upside target on the H4 scale can be seen around 1.3570, though according to the higher timeframes we could be heading much higher.
Today’s data points: FOMC Members Williams and George Speak.
USD/CHF:
In light of recent trade developments between the US and China, demand for safe-haven assets increased Monday, consequently boosting the Swiss franc, the Japanese yen and bullion.
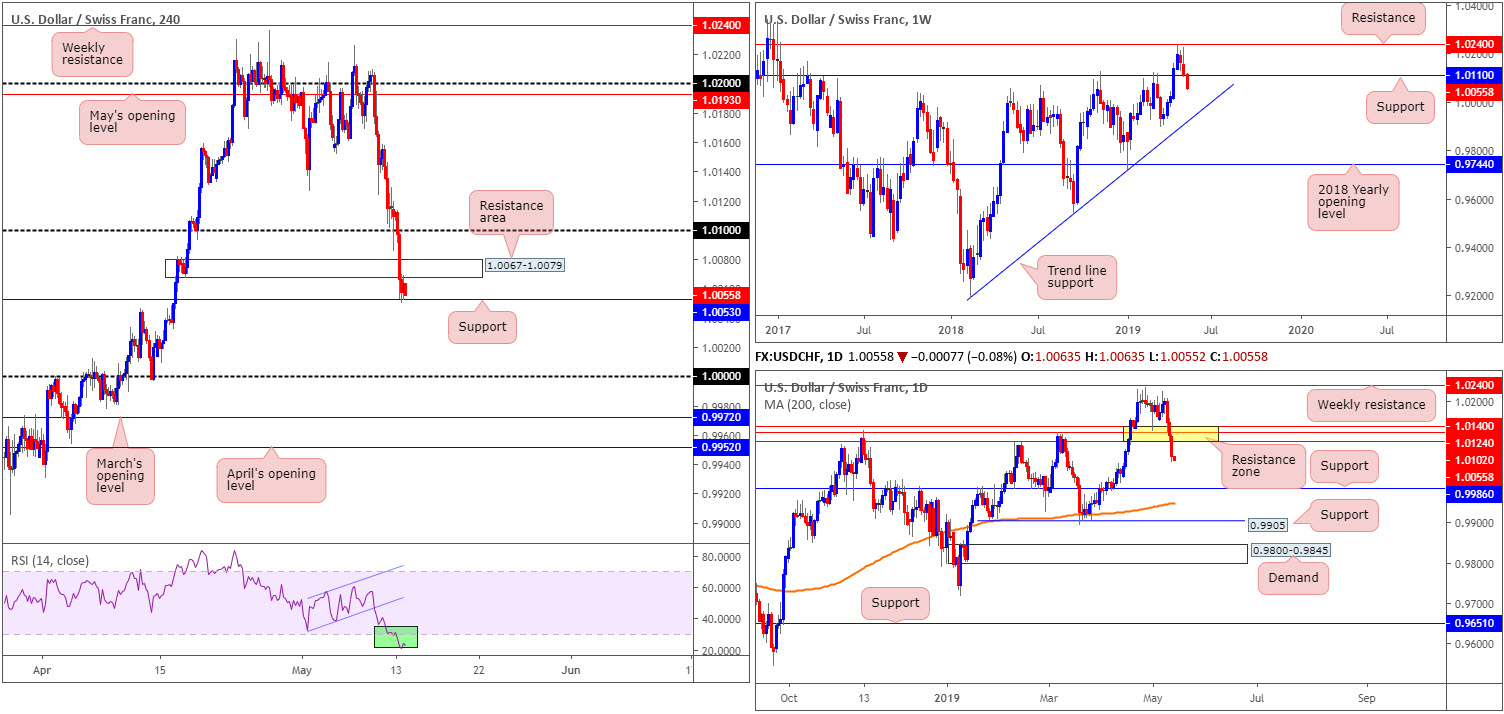
The buck’s retreat from the 2019 high 1.0236 on the weekly timeframe set towards the end of May continues, pencilling in a strong bearish push beneath support at 1.0110. Continued selling from this point has
trend line support etched from the low 0.9187 in the firing range. In union with our weekly reading, a support zone comprised of 1.0102/1.0140 (yellow) was taken out yesterday, exposing a free run towards support plotted at 0.9986.
Across on the H4 timeframe, however, support is seen in motion at 1.0053 after thrusting through demand at 1.0067-1.0079 (now an acting resistance area). Beyond the current support, traders may be interested to note parity (1.0000) resides lower down on the curve, trailed closely by March’s opening level at 0.9972. Another point to keep in mind is the RSI indicator seen testing oversold waters (green).
Areas of consideration:
Although we have H4 support at 1.0053 confirmed by an RSI oversold reading, higher-timeframe structure suggests additional selling could be in store, at least until we reach parity.
With the above points in mind, today’s focus is on a close beneath the aforementioned H4 support. Breakout traders may look to simply sell the breakout candle (and position stops accordingly), whereas a more conservative approach (although this may cause traders to miss the selloff) might be to wait and see if the unit retests the underside of 1.0053 following the push lower (entry and risk can then be determined on the back of the rejecting candle’s structure).
Today’s data points: FOMC Members Williams and George Speak.
Dow Jones Industrial Average (DOW 30):
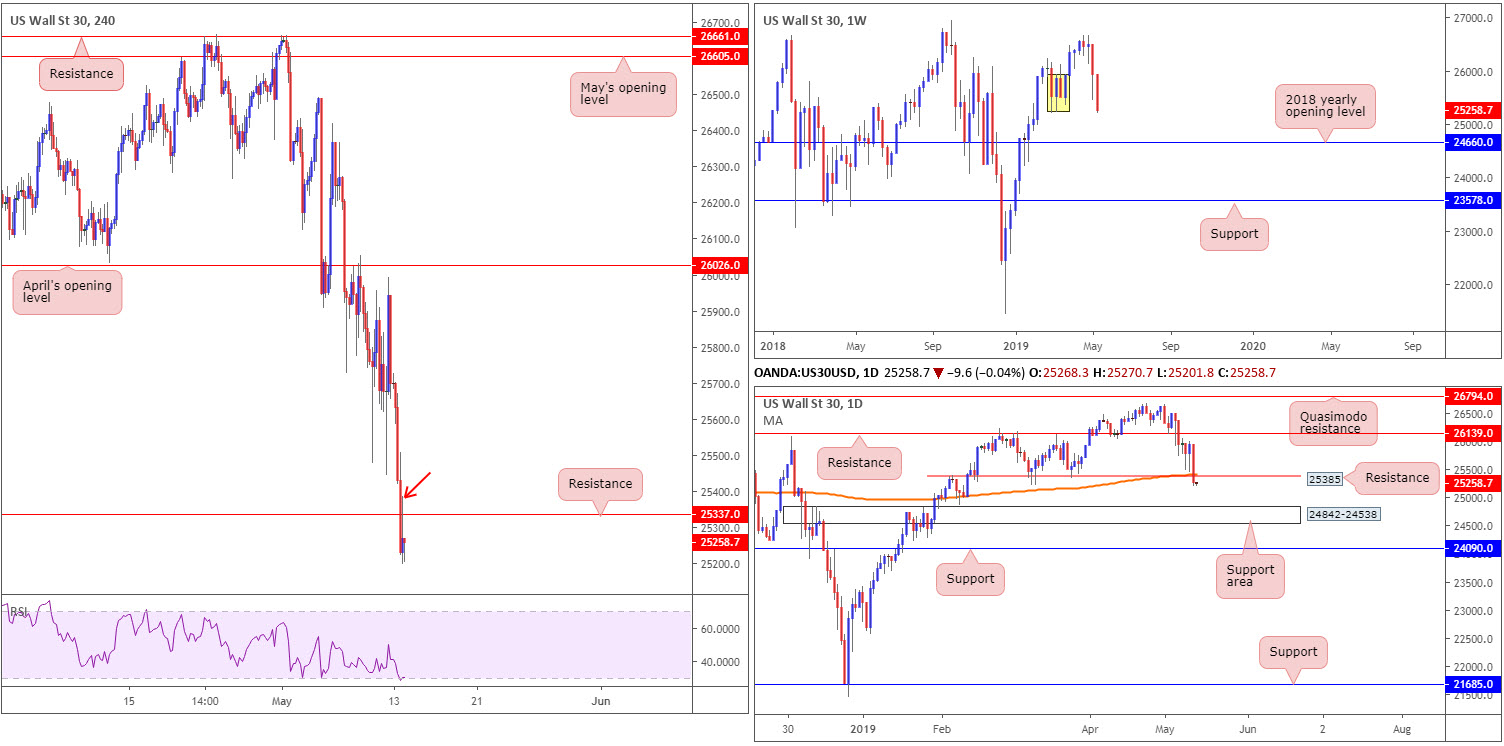
Global equity markets were in a spin Monday, with US equities tumbling more than 2% as the trade dispute between the US and China escalated. The Dow wrapped up the day down by 2.38%, the S&P 500 ended in the red at 2.41 and tech-heavy Nasdaq nudged lower by 3.46%.
Technically speaking on the DJIA, we have the H4 candles languishing beneath resistance at 25337 (a previous Quasimodo support formation). Note this level was already retested in recent hours and closed forming a reasonably strong upper shadow. Further selling from this point has support (not seen on the screen) at 24992.
Over on the bigger picture, the weekly timeframe appears poised to continue exploring lower ground towards its 2018 yearly opening level at 24660, after testing levels beneath demand marked in yellow at 25217-25927. The story on the daily timeframe also has price action trading marginally beneath support at 25385, along with its 200-day SMA.
Areas of consideration:
Shorts at current price, based on all three timeframes suggesting we could be heading for lower ground, are an option this morning on the H4 timeframe, targeting the H4 support level highlighted above at 24992. As for a protective stop-loss order placement, above the H4 rejecting candle’s upper shadow is a possibility at around 25385 (red arrow).
Today’s data points: FOMC Members Williams and George Speak.
XAU/USD (GOLD):
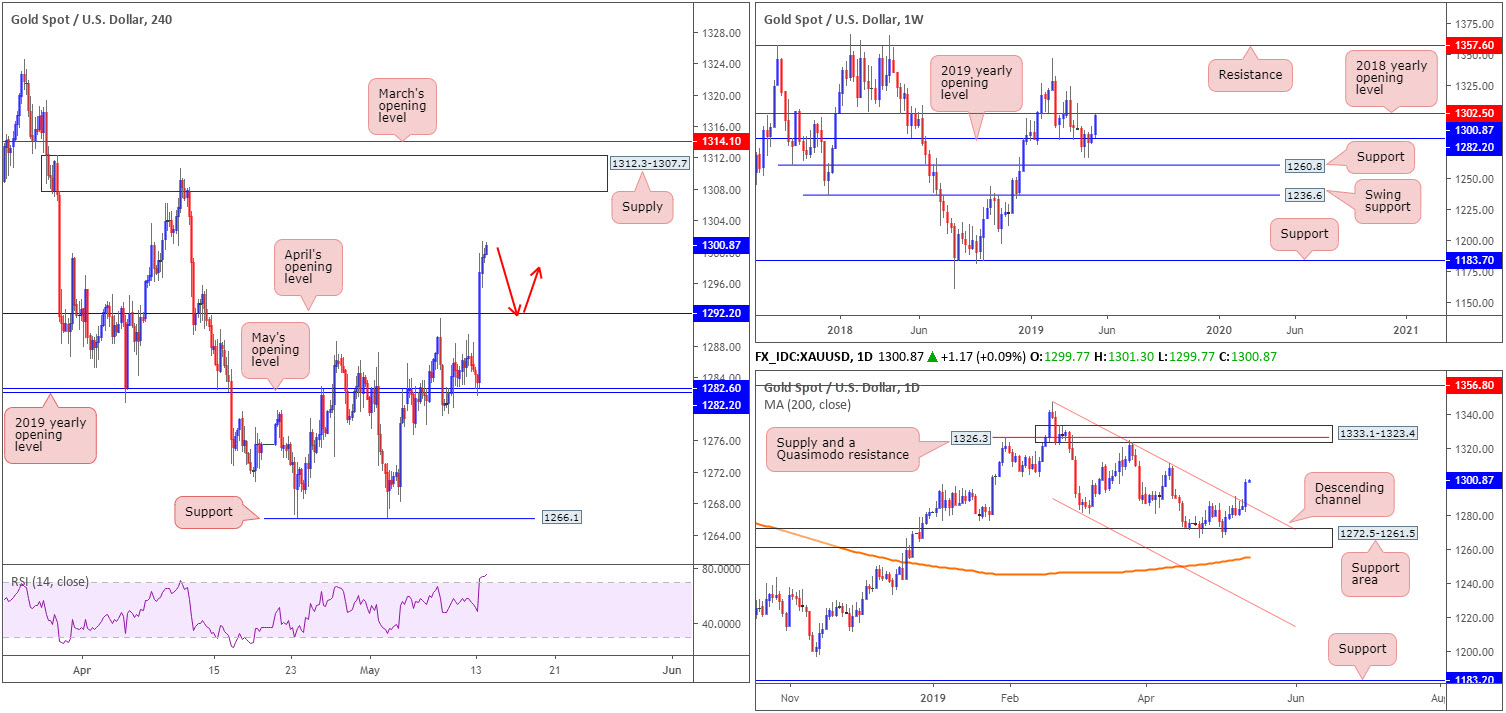
Demand for the safe-haven metal increased Monday, amid escalating trade tensions between the US and China. Rebounding from its 2019 yearly opening level at 1282.2, seen on the weekly and H4 timeframes, bullion overthrew April’s opening level at 1292.2 on the H4 timeframe and potentially cleared the runway north towards a supply zone coming in at 1312.3-1307.7.
Further supporting a run north is the daily timeframe, which, in strong fashion, dethroned channel resistance etched from the high 1346.7. Continued buying has the 1310.6 April 10 high to contend with, followed by a supply zone at 1333.1-1323.4. The only grumble for buyers stems from the weekly timeframe, seen hovering inches from possible resistance by way of the 2018 yearly opening level at 1302.5.
Areas of consideration:
As both daily and H4 timeframes exhibit scope to press higher, a retest of April’s opening level at 1292.2 as support is likely of interest today. However, seeing as we’re also trading nearby a form of weekly resistance, traders are recommended to wait for additional confirmation to materialise before pulling the trigger. This could be anything from a bullish candlestick reversal signal, an MA crossover or even drilling down to the lower timeframes and entering based on local structure: support and resistance.
Failure to retest 1292.2, focus is drawn towards the H4 supply at 1312.3-1307.7 for shorts, given the close connection the area has to weekly resistance at 1302.5. Conservative stop-loss placement is seen above March’s opening level at 1314.1.
The accuracy, completeness and timeliness of the information contained on this site cannot be guaranteed. IC Markets does not warranty, guarantee or make any representations, or assume any liability with regard to financial results based on the use of the information in the site.
News, views, opinions, recommendations and other information obtained from sources outside of www.icmarkets.com.au, used in this site are believed to be reliable, but we cannot guarantee their accuracy or completeness. All such information is subject to change at any time without notice. IC Markets assumes no responsibility for the content of any linked site. The fact that such links may exist does not indicate approval or endorsement of any material contained on any linked site.
IC Markets is not liable for any harm caused by the transmission, through accessing the services or information on this site, of a computer virus, or other computer code or programming device that might be used to access, delete, damage, disable, disrupt or otherwise impede in any manner, the operation of the site or of any user’s software, hardware, data or property.


