
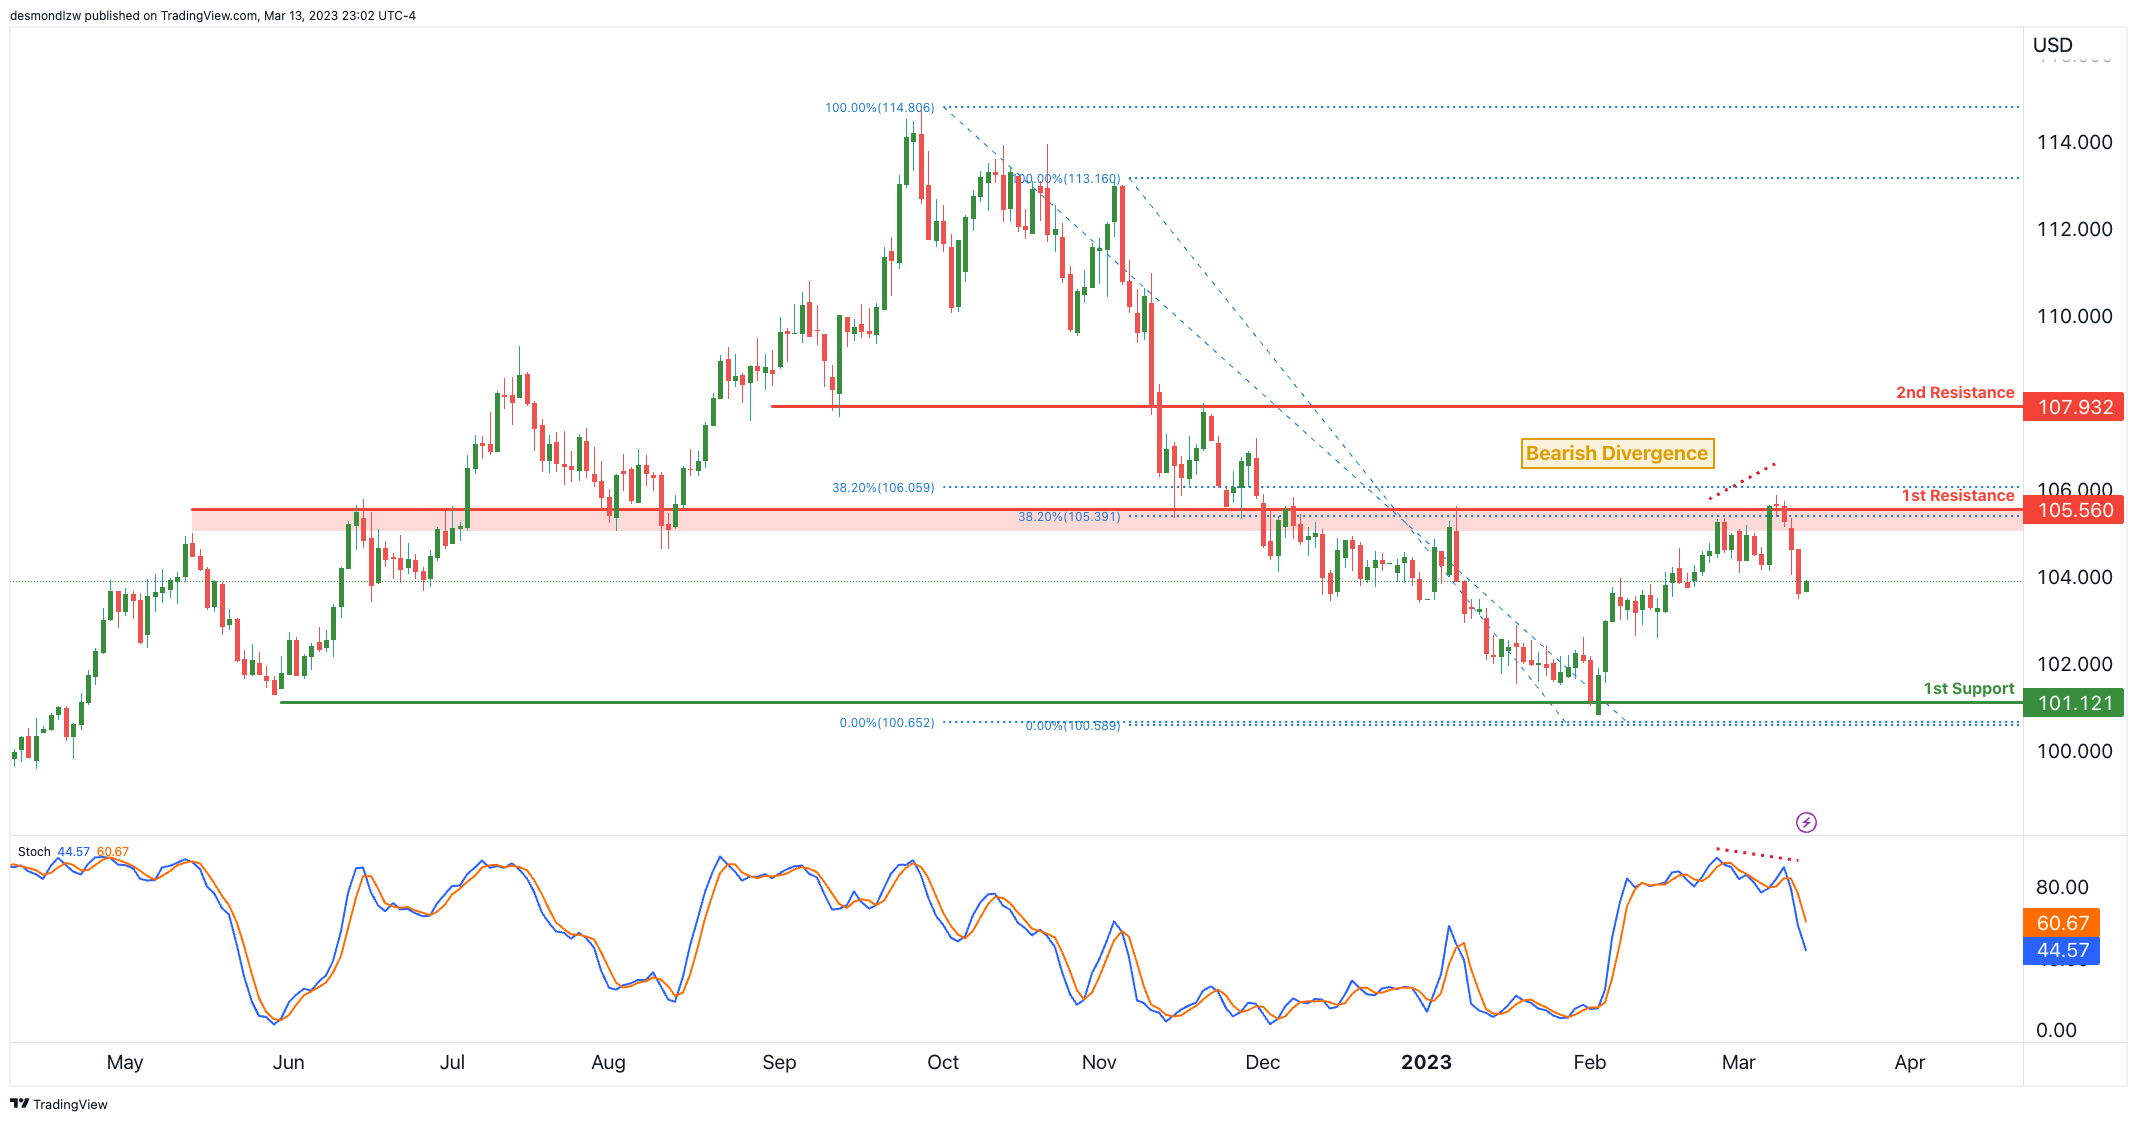
DXY:
Price has started to reverse from our 1st resistance at 105.56 really nicely and has also started to form a bearish divergence vs Stochastic. We could see a reversal from this level to push prices all the way down to 1st support which is a multi-swing low support.
Stochastic is also reversing from an overbought zone with significant downside potential.
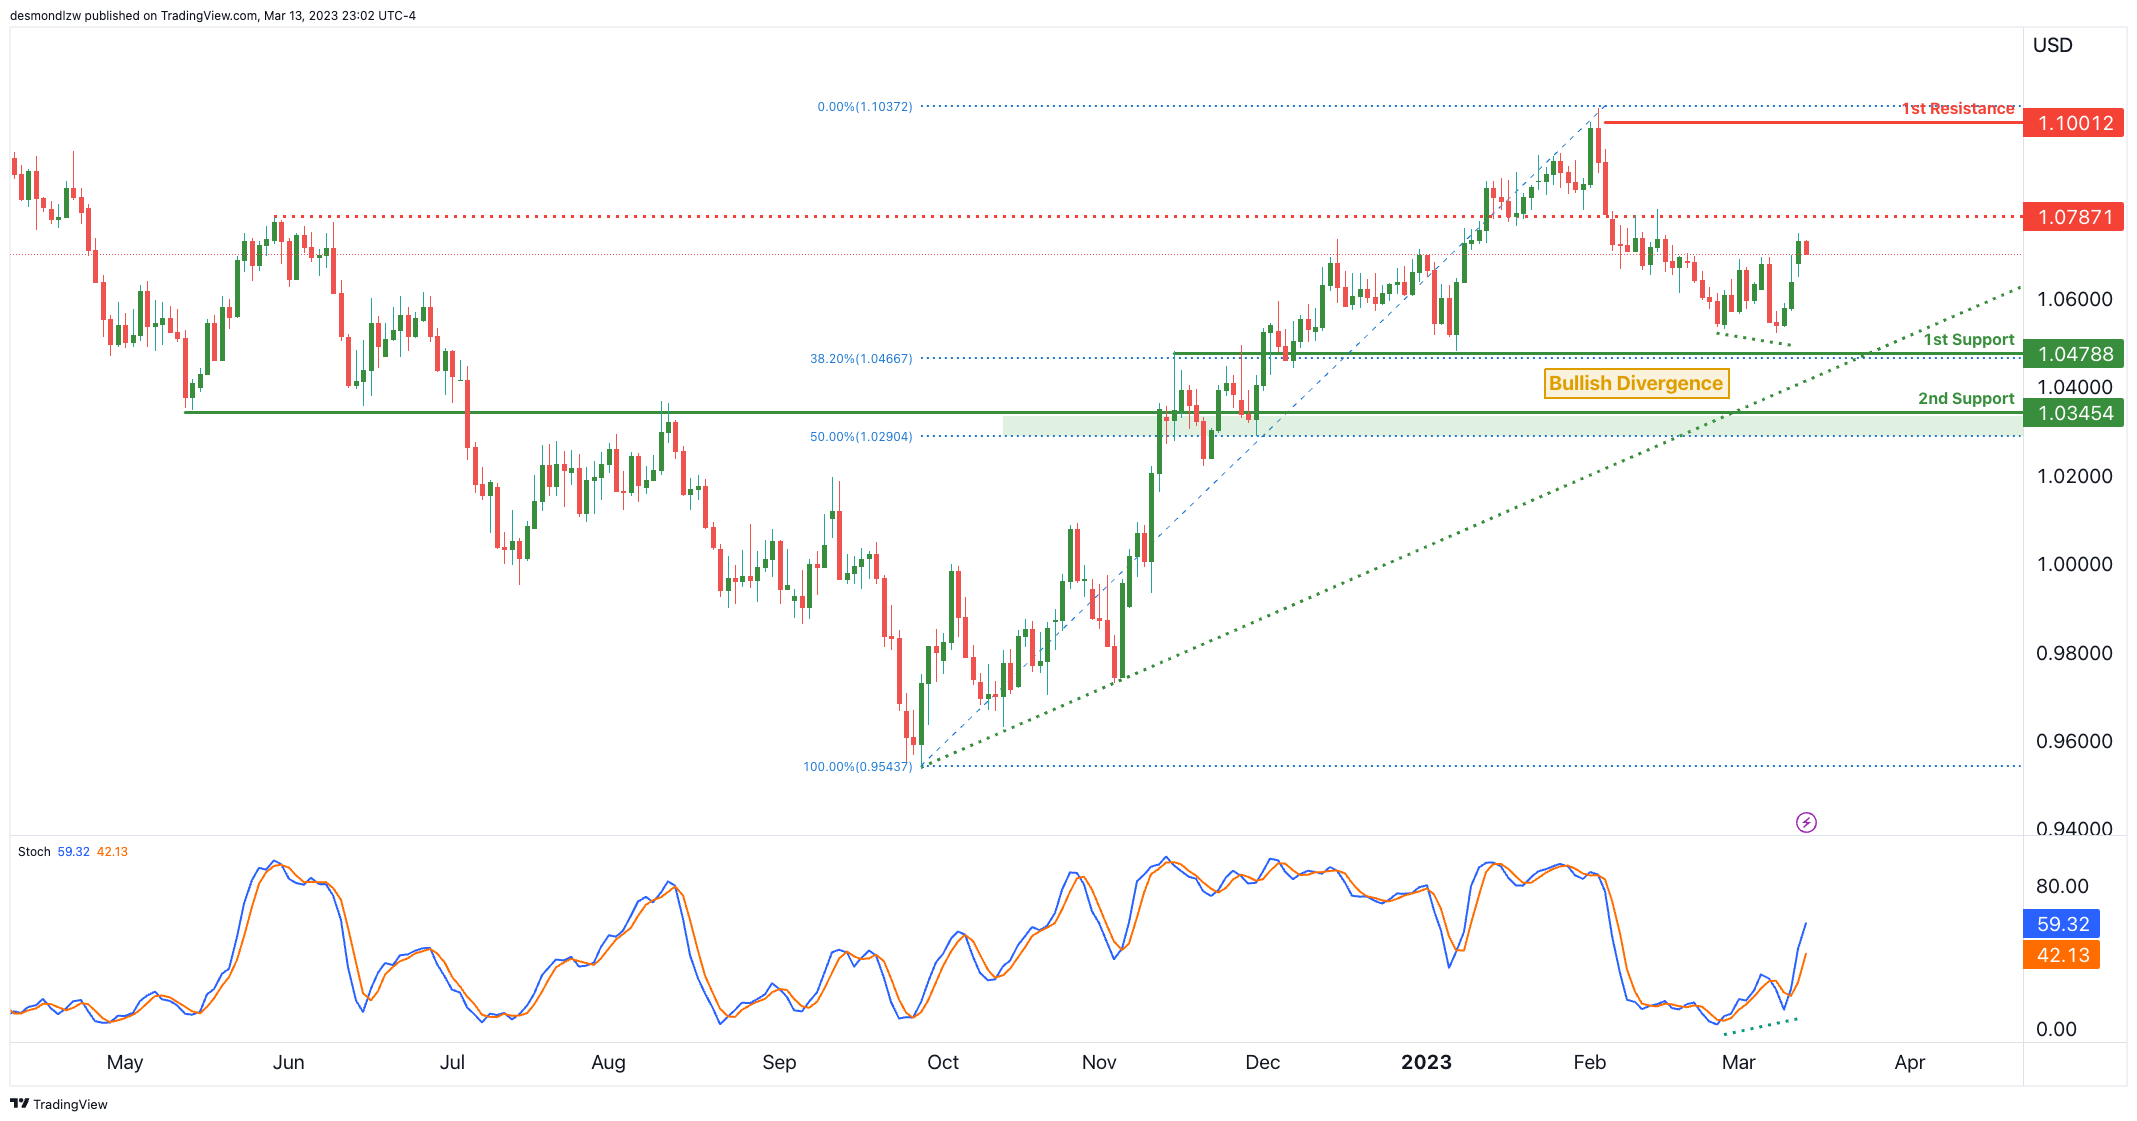
EUR/USD:
Price has started to bounce nicely off 1st support and at the same time, is displaying bullish divergence vs Stochastic suggesting that there might be a further move up. We see an ascending trend line suggesting there’s a bit more bullish momentum for EURUSD.
In terms of resistance, there is an intermediate resistance at the 1.0787 level where price needs to break past to trigger a further move to 1.1000 level which is a swing high resistance and big figure.
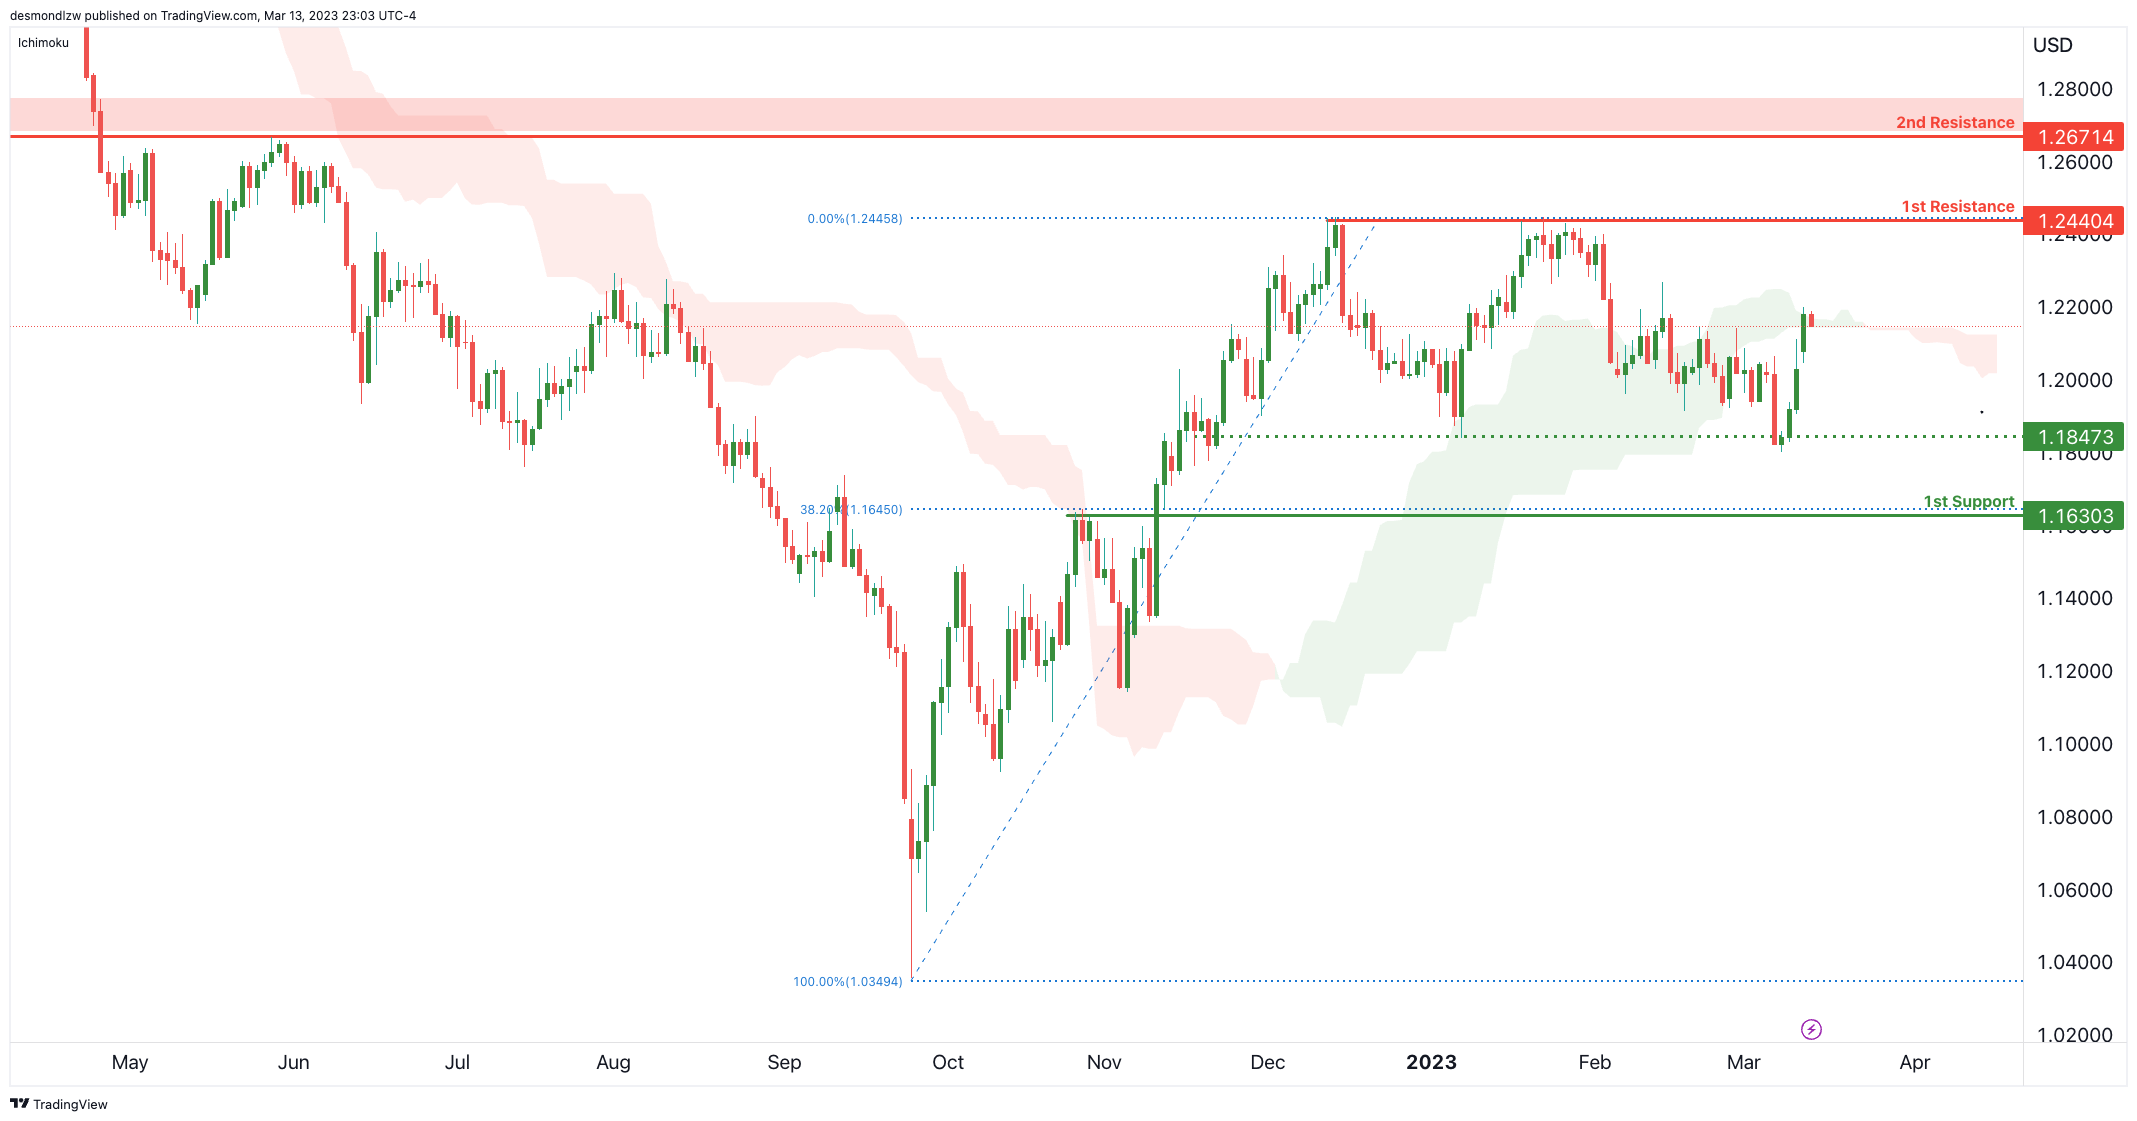
GBP/USD:
Price continues to hold well above our intermediate support at 1.1847 which needs to be broken to trigger a double top reversal. It has also crossed below the Ichimoku cloud suggesting there might be more bearishness in this move.
1st resistance remains at 1.2440 which is a multi-swing high resistance level that price needs to break past to reach the 2nd long-tern resistance at 1.2671.
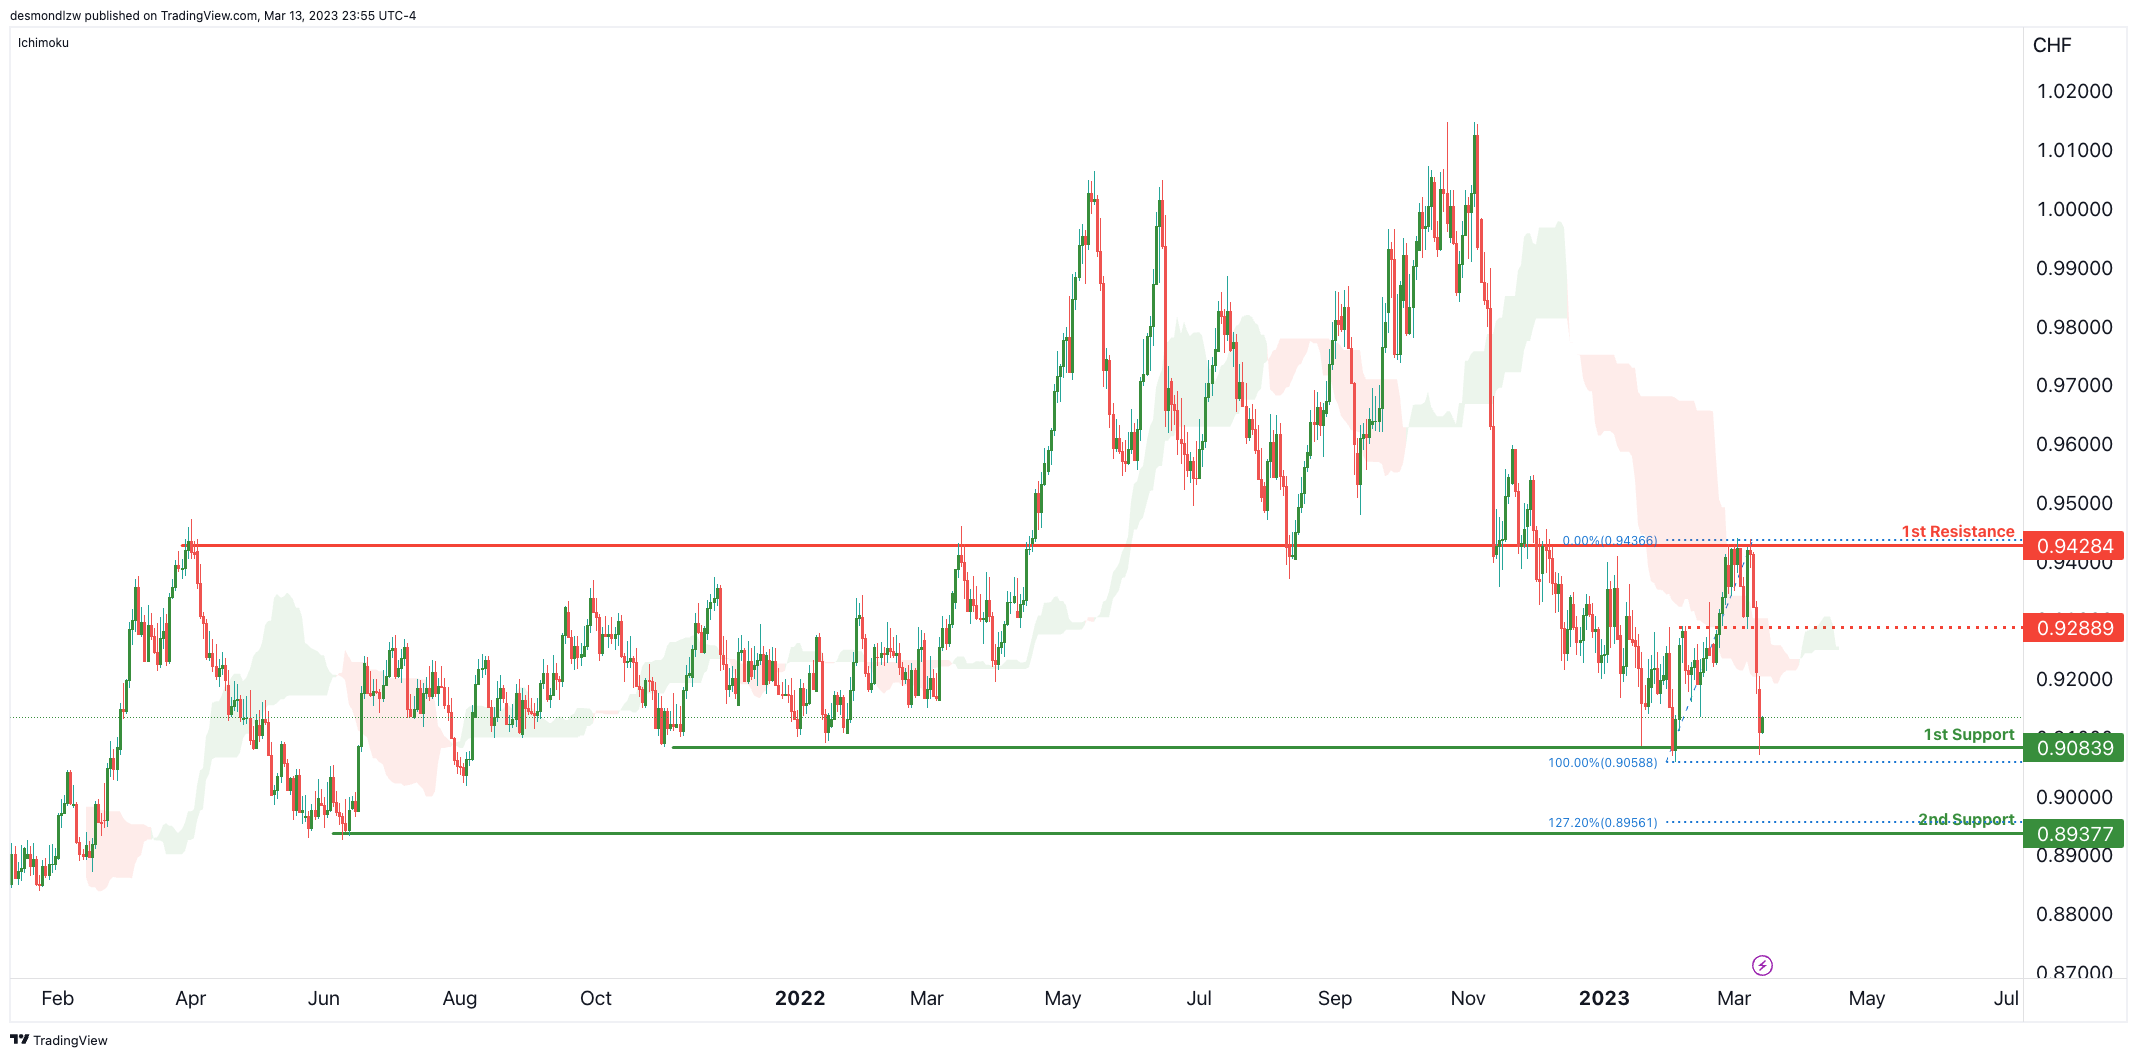
USD/CHF:
Price has dropped really nicely from our forecasted 1st resistance at 0.9428 previously and is back at major support at 0.9083 which is a multi-swing low support. It’s worth noting that price has also dropped below the Ichimoku cloud suggesting a bit more bearishness.
Price needs to brak the 1st support to trigger the next move down to 2nd support at 0.8937 which is a major swing low support from June 2021.
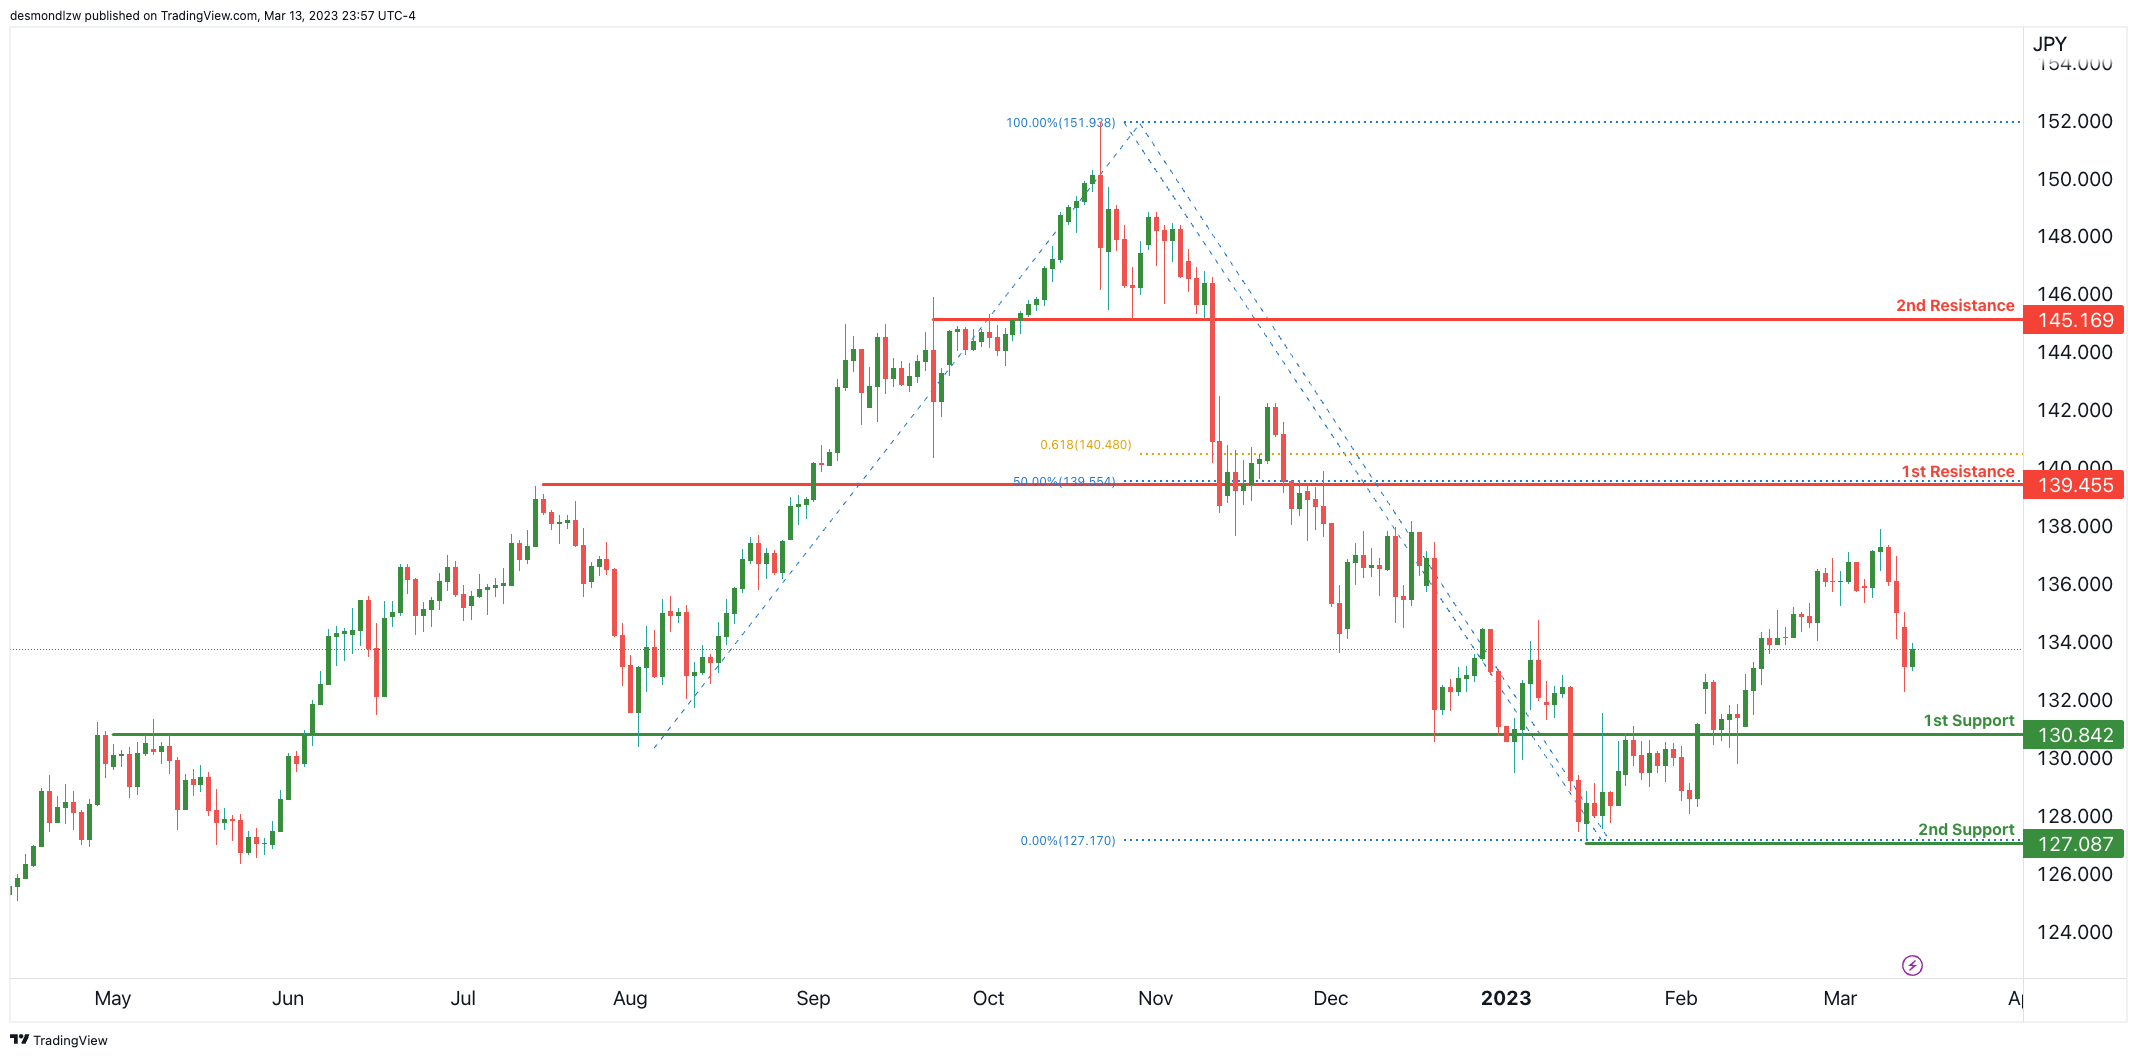
USD/JPY:
Price has dropped strongly and is fast approaching a major overlap support at 130.84. This level needs to be broken to trigger a drop to 2nd support at 127.08 which is the recent major swing low support.
In terms of resistance, there’s 1st resistance at 139.45 which is an overlap resistance and a 50% Fibonacci retracement along with a 61.8% Fibonacci projection.
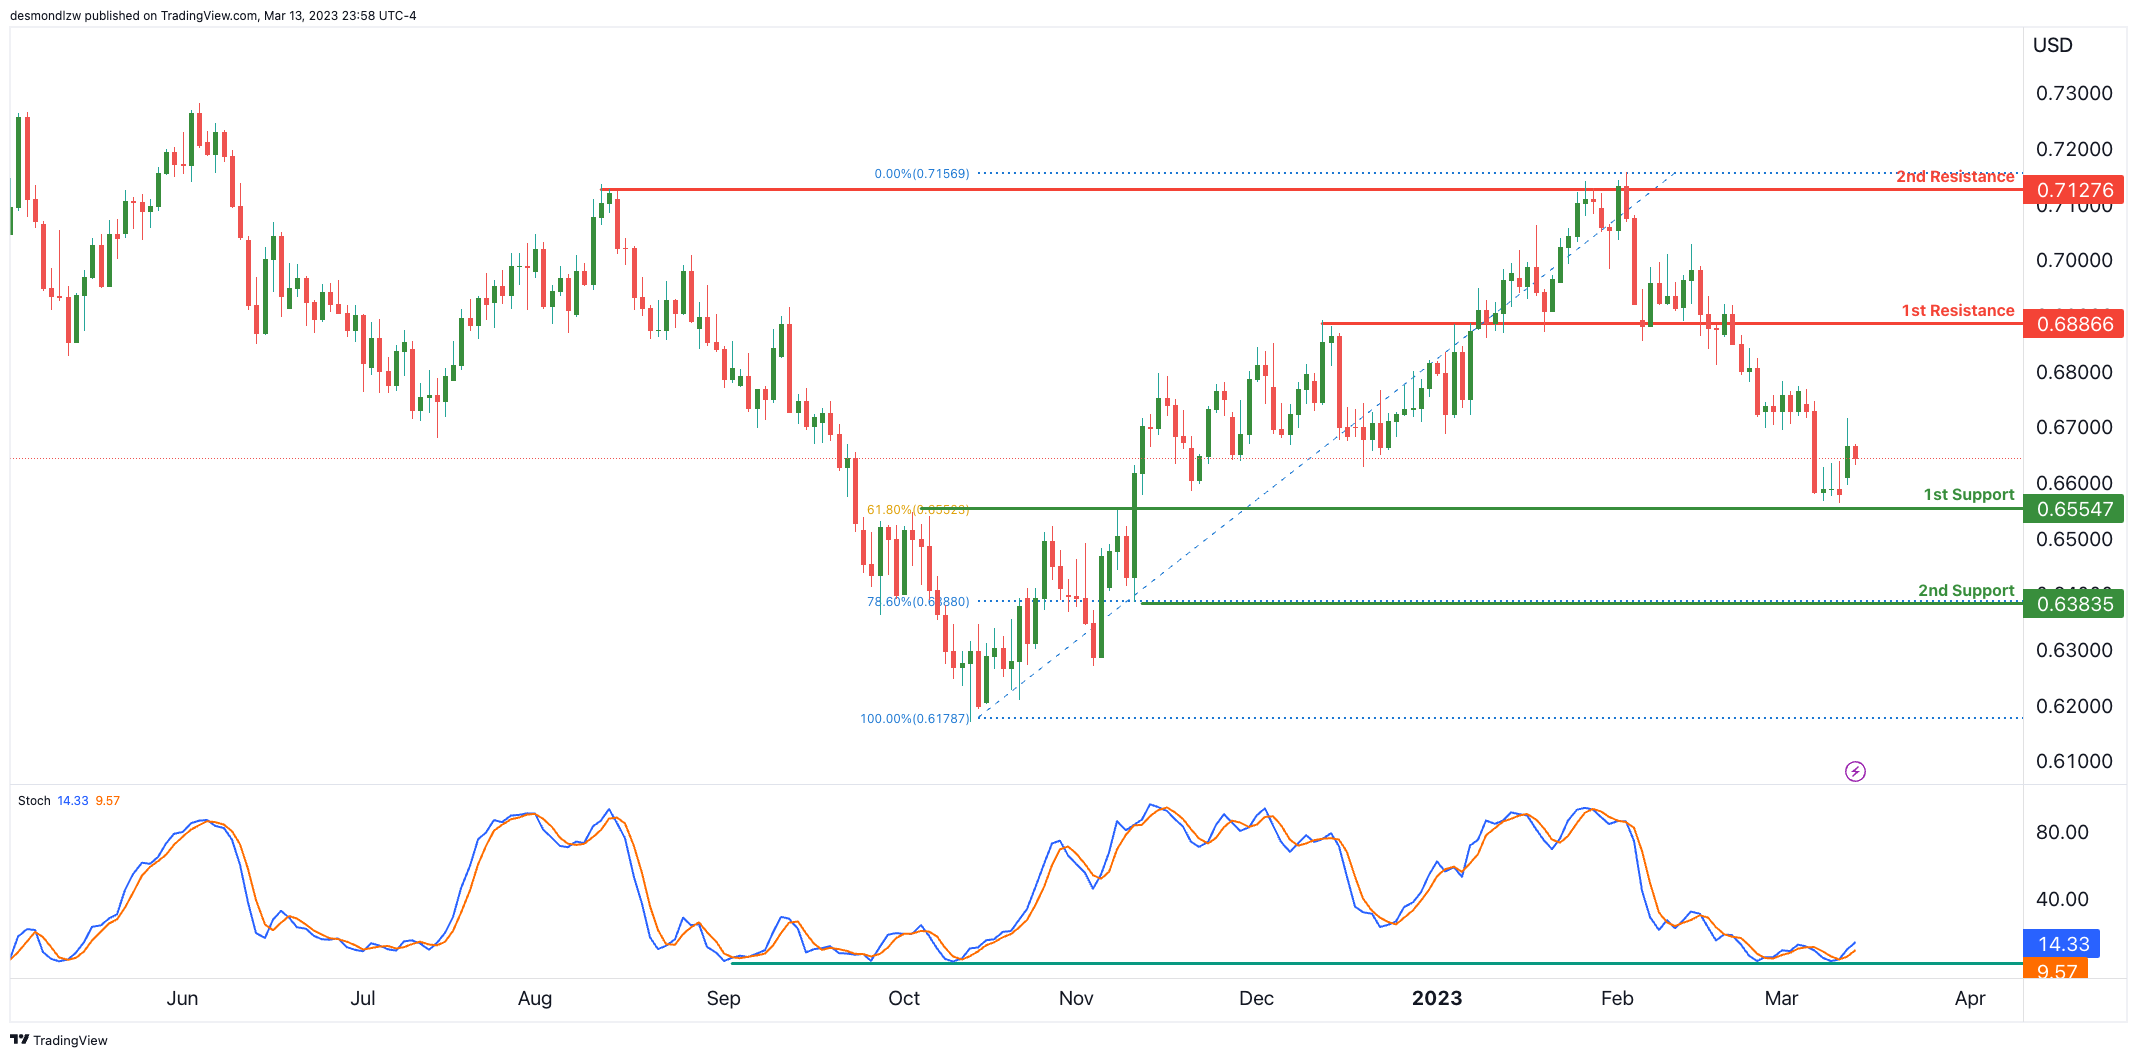
AUD/USD:
Price is lingering above our 1st support area at 0.6554 which lines up the 61.8% Fibonacci retracement, if price were to break through it, the next key support level would be at 0.6383, which is another overlap support that lines up with the 78.6% Fibonacci retracement.
Regarding resistance levels, the 1st resistance is at 0.6886 which is a strong Overlap resistance, and the 2nd resistance is at 0.7127 which is a multi-swing high resistance level.
It’s worth noting that Stochastic is right on major support and could suggest a bounce is coming soon.
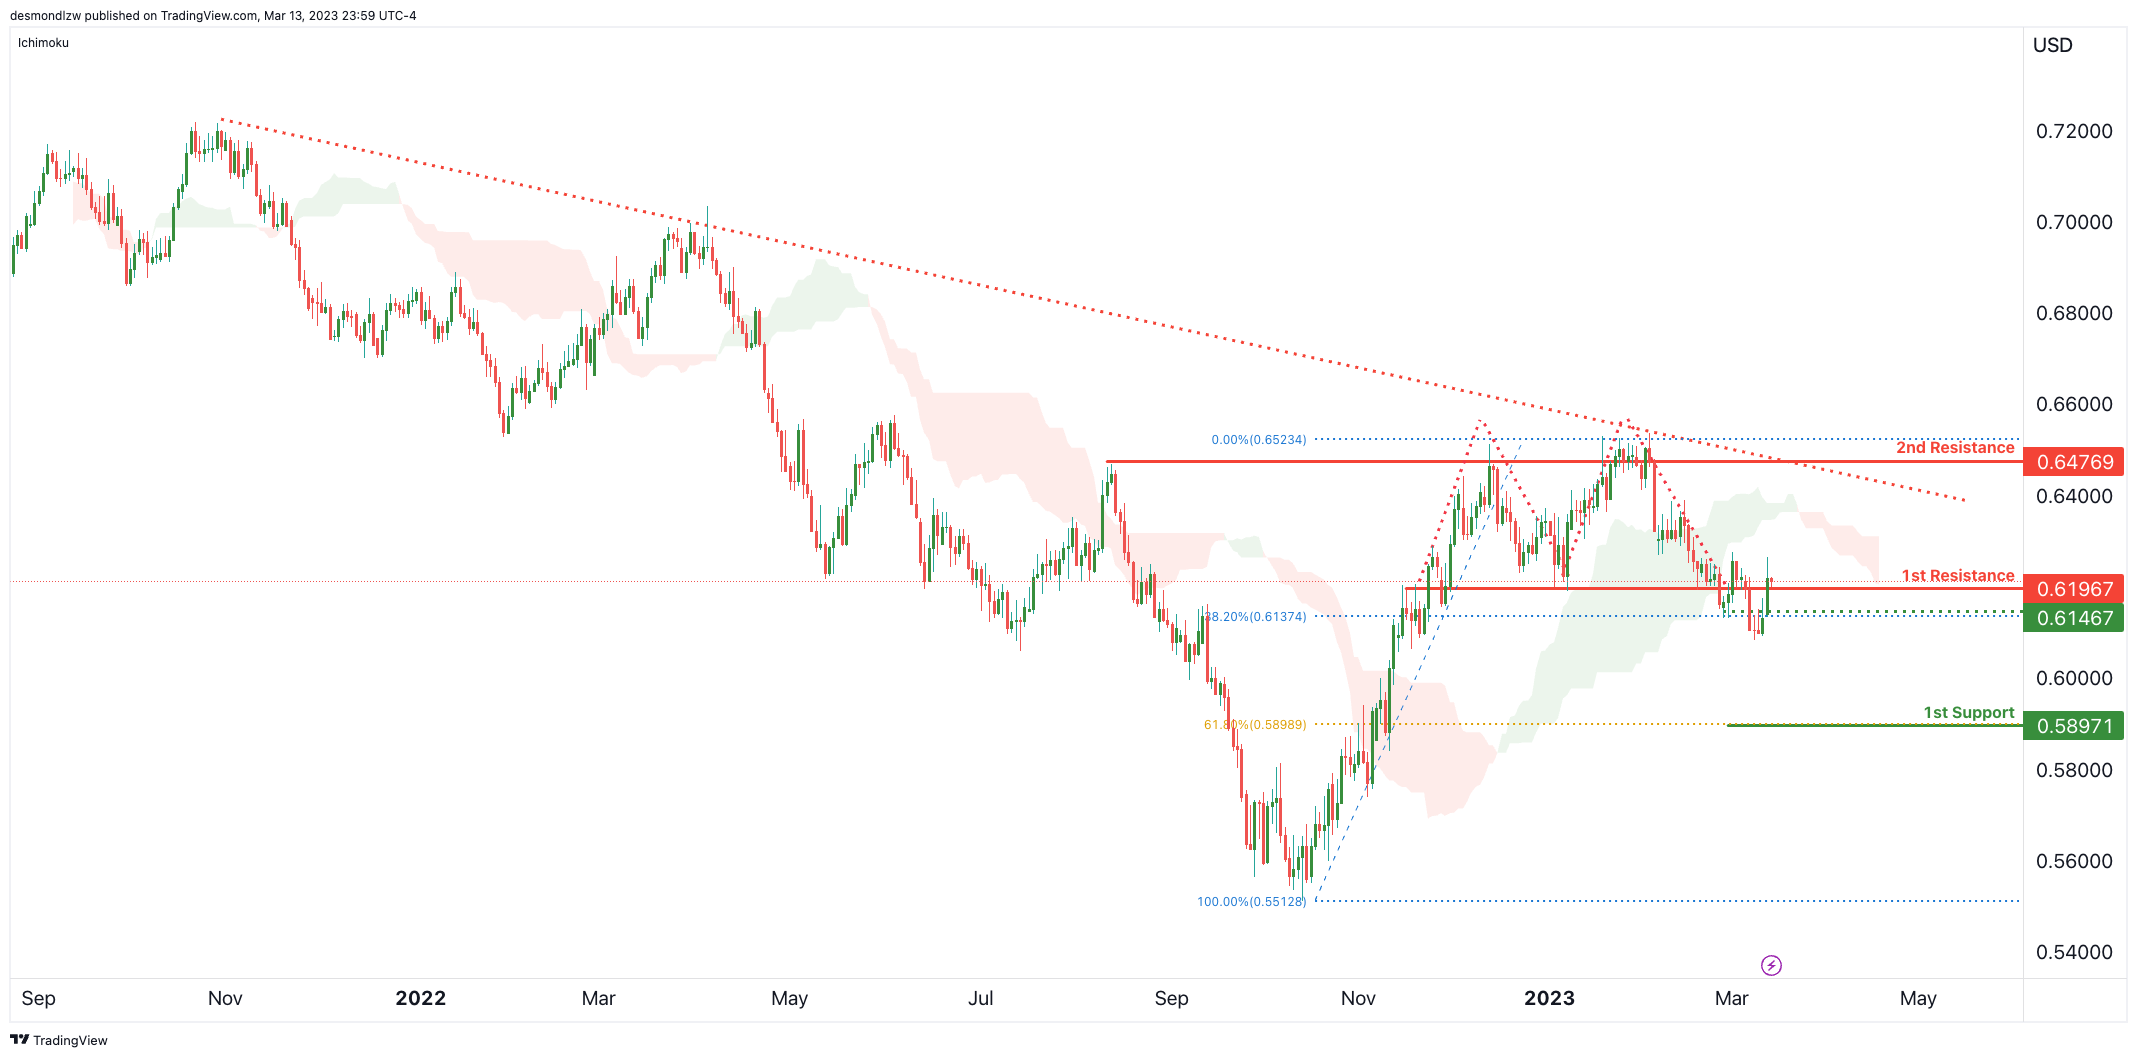
NZD/USD:
Price is seeing a long term descending resistance line push prices lower and a cross below the Ichimoku cloud + double top breakout level suggests further bearishness might be on the cards. If prie is able to break the 38.2% Fibonacci retracement at 0.6137, we could see a further move down to 1st support at 0.5897.
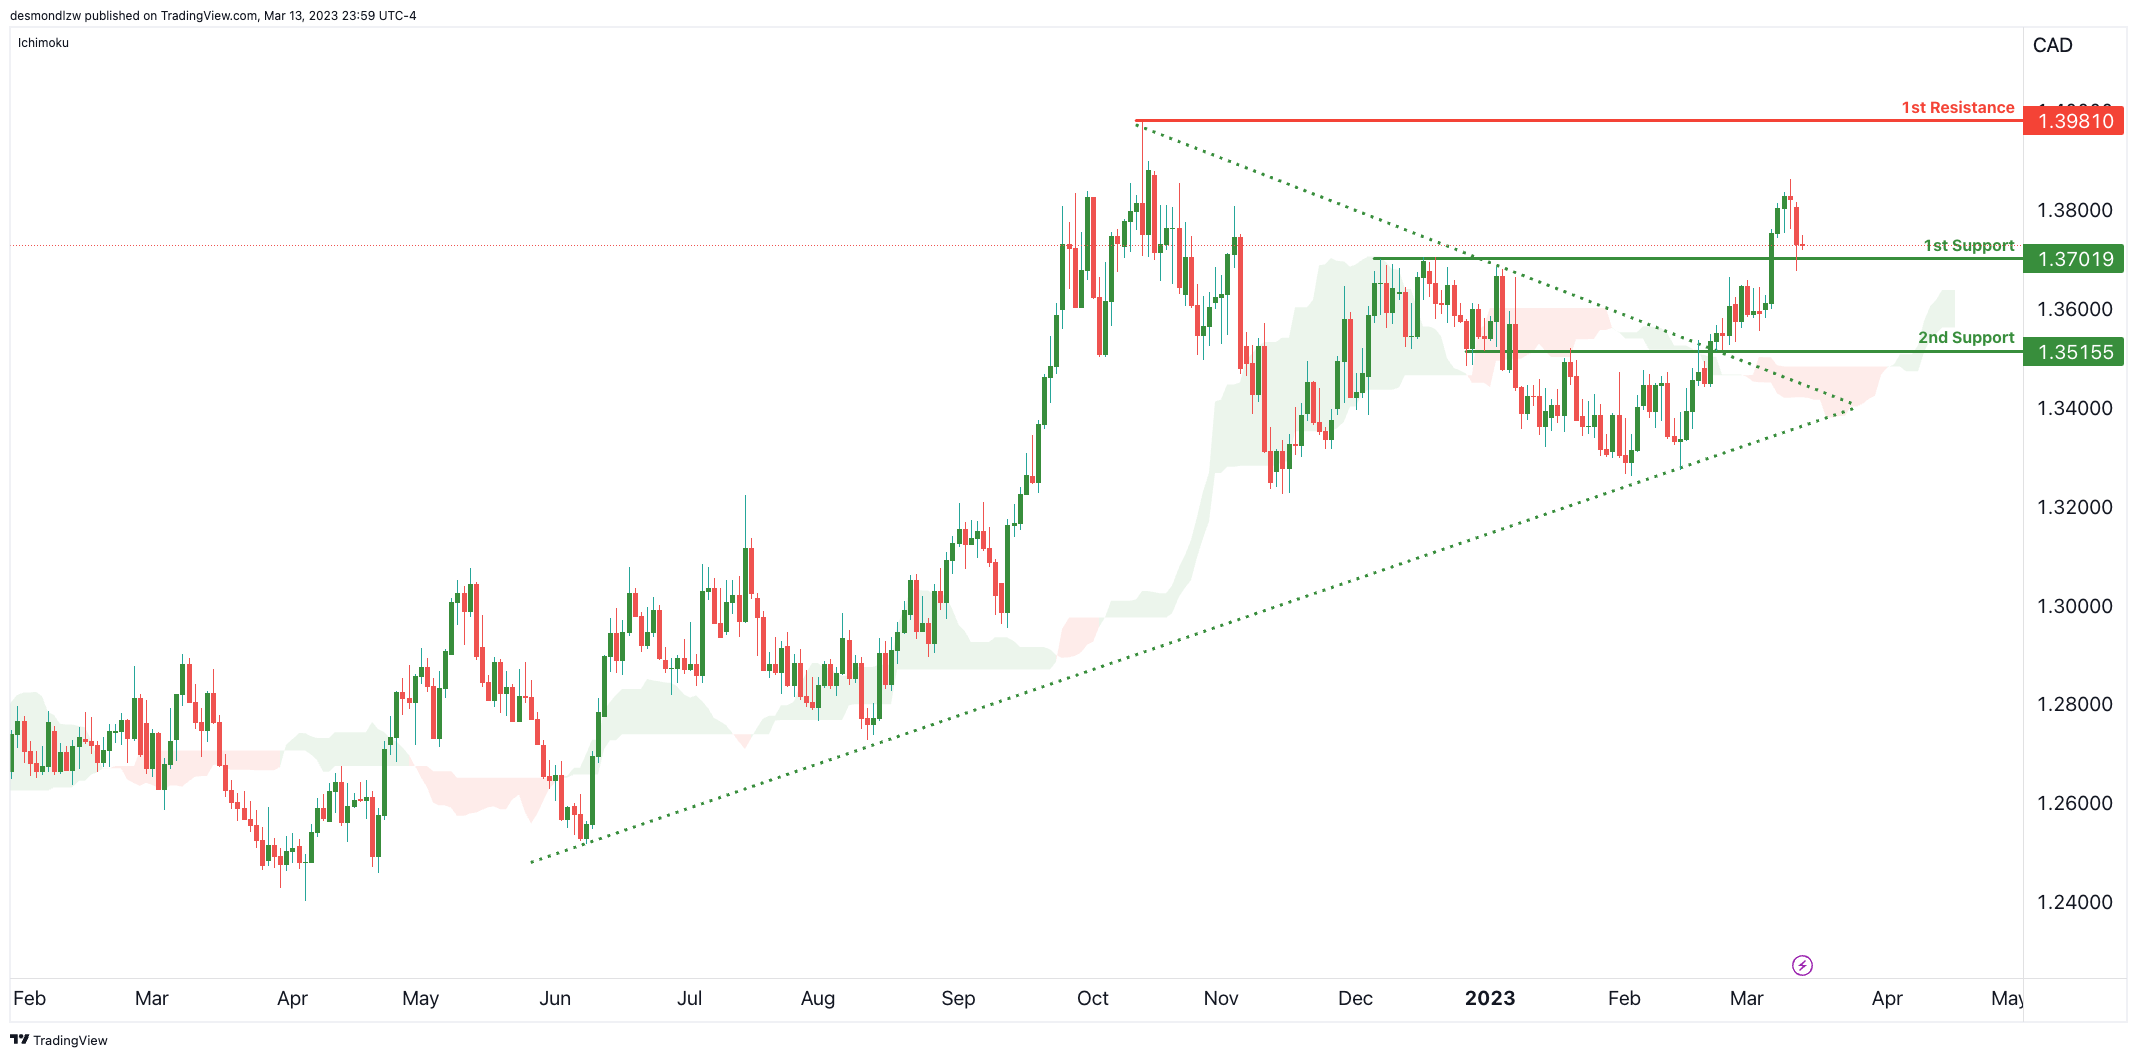
USD/CAD:
Price is back on major support at 1.3701 which is a pullback support. The ascending support line continues to hold prices up suggesting a further push up to 1st resistance at 1.3981 which is the major swing high resistance.
If price were to break the 1st support level, we could see a drop to 2nd support at 1.3515 which is the short term overlap support.
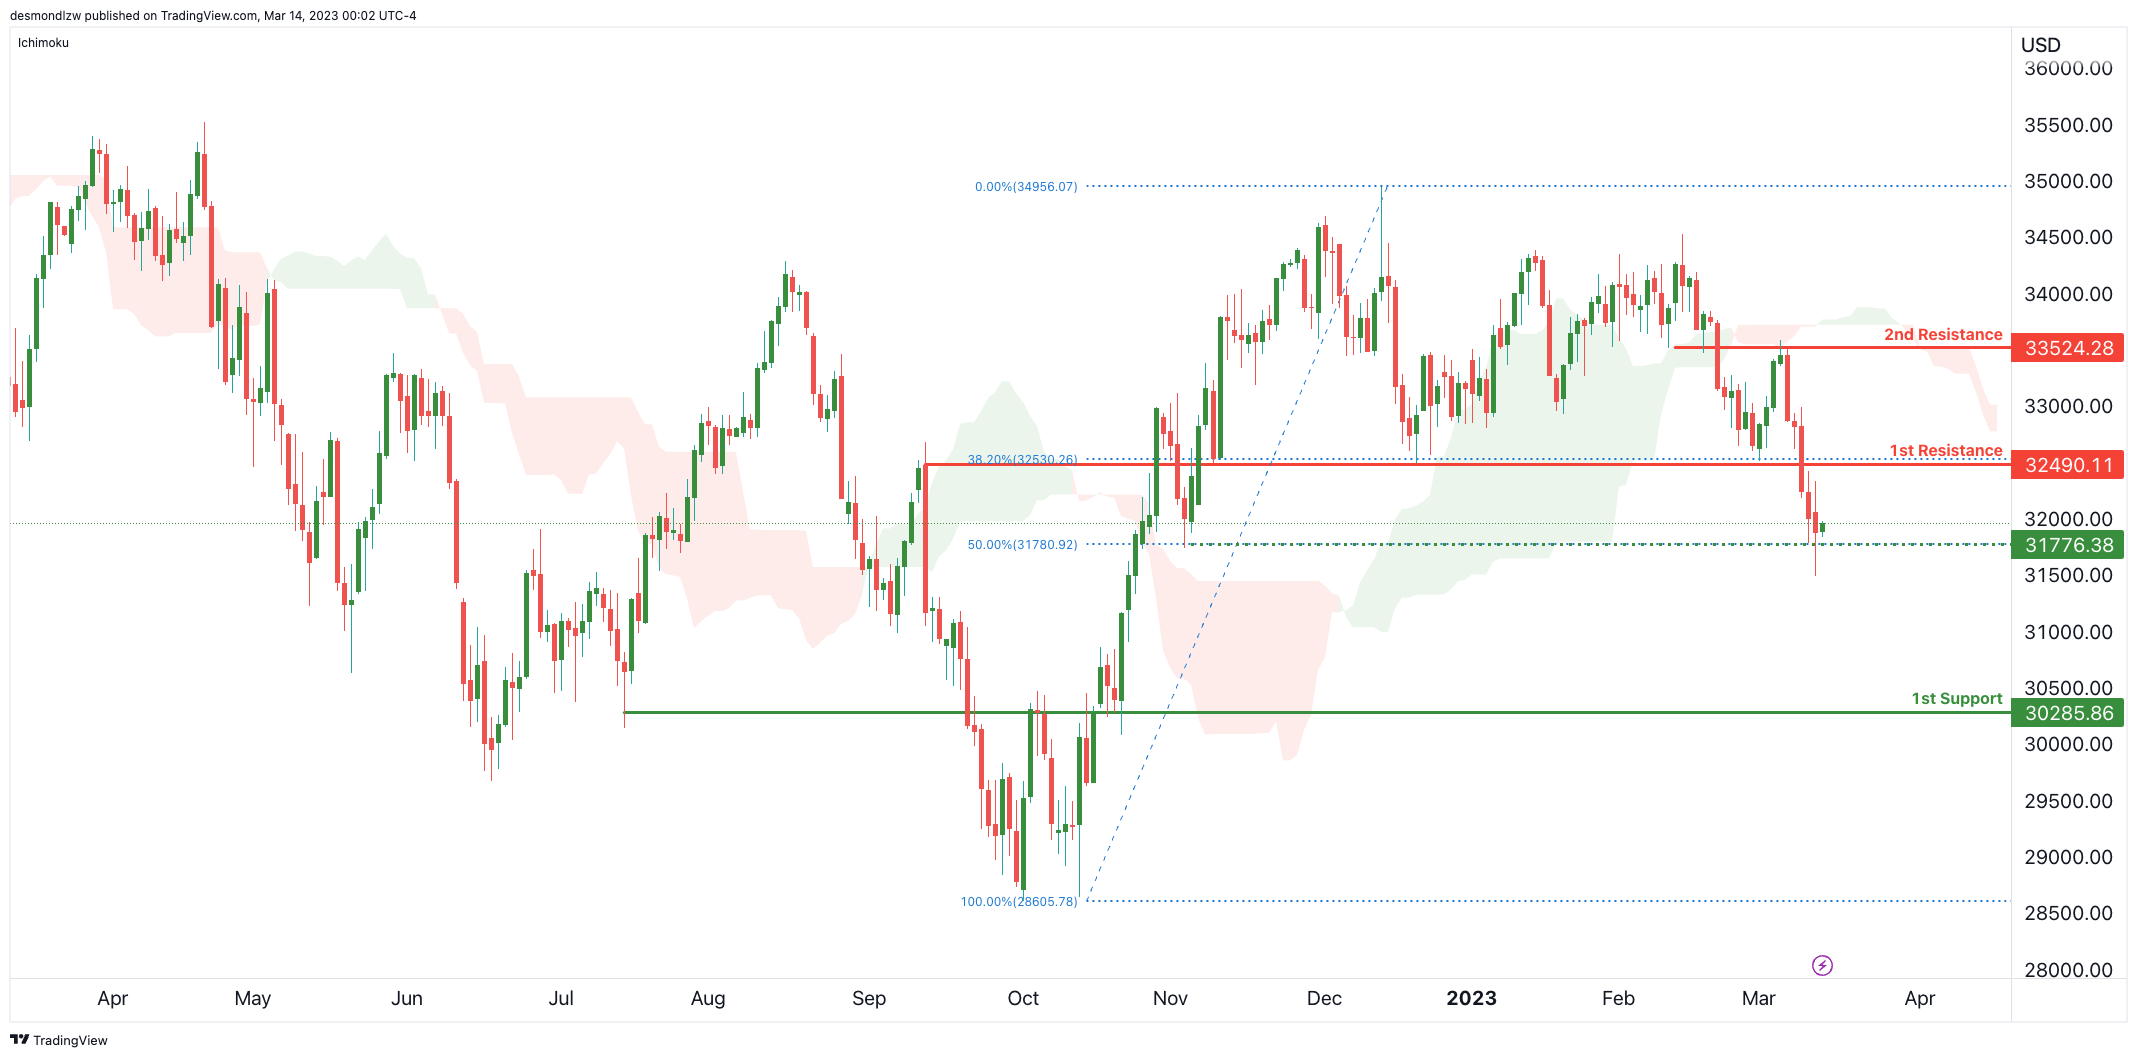
DJ30:
Price has broken the 1st support-turned-resistance at 32490 which has triggered a sort of double-top reversal – suggesting that prices might drop strongly towards the 30285 level. However, there’s an intermediate support level down at 31776 which is a small swing low + 50% Fibonacci retracement. This level needs to be broken to trigger a potential bigger move down.
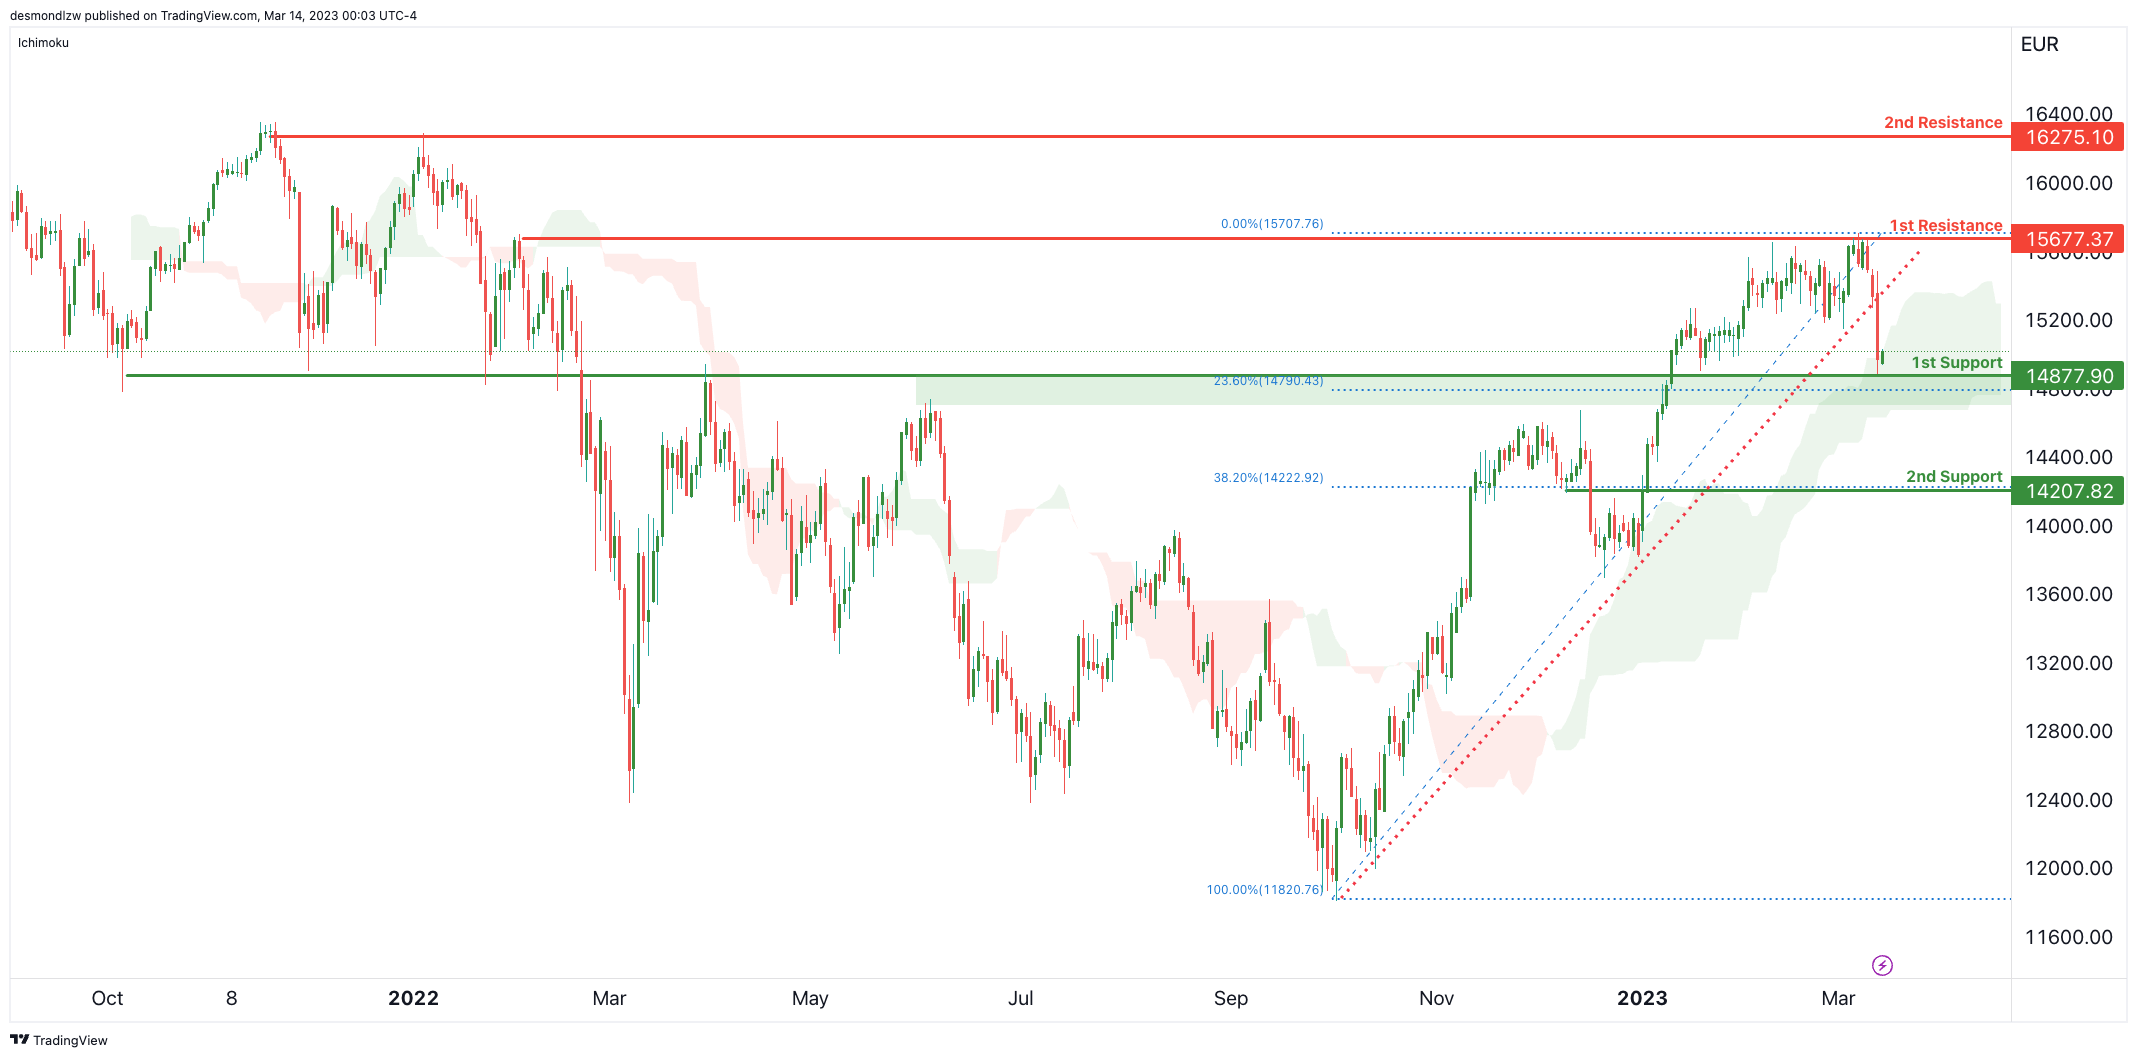
GER30:
Price has broken a long term ascending support line that stretches back to October 2022. However, it is currently being held up by the 1st support at 14877 which is an overlap support and a 23.6% Fibonacci retracement – along with that, there is a strong bullish Ichimoku cloud that is holding prices up too.
Price would need to break the 14877 area to potentially trigger a move down to 2nd support at 14207 which is the 38.2% Fibonacci retracement and a small overlap support.
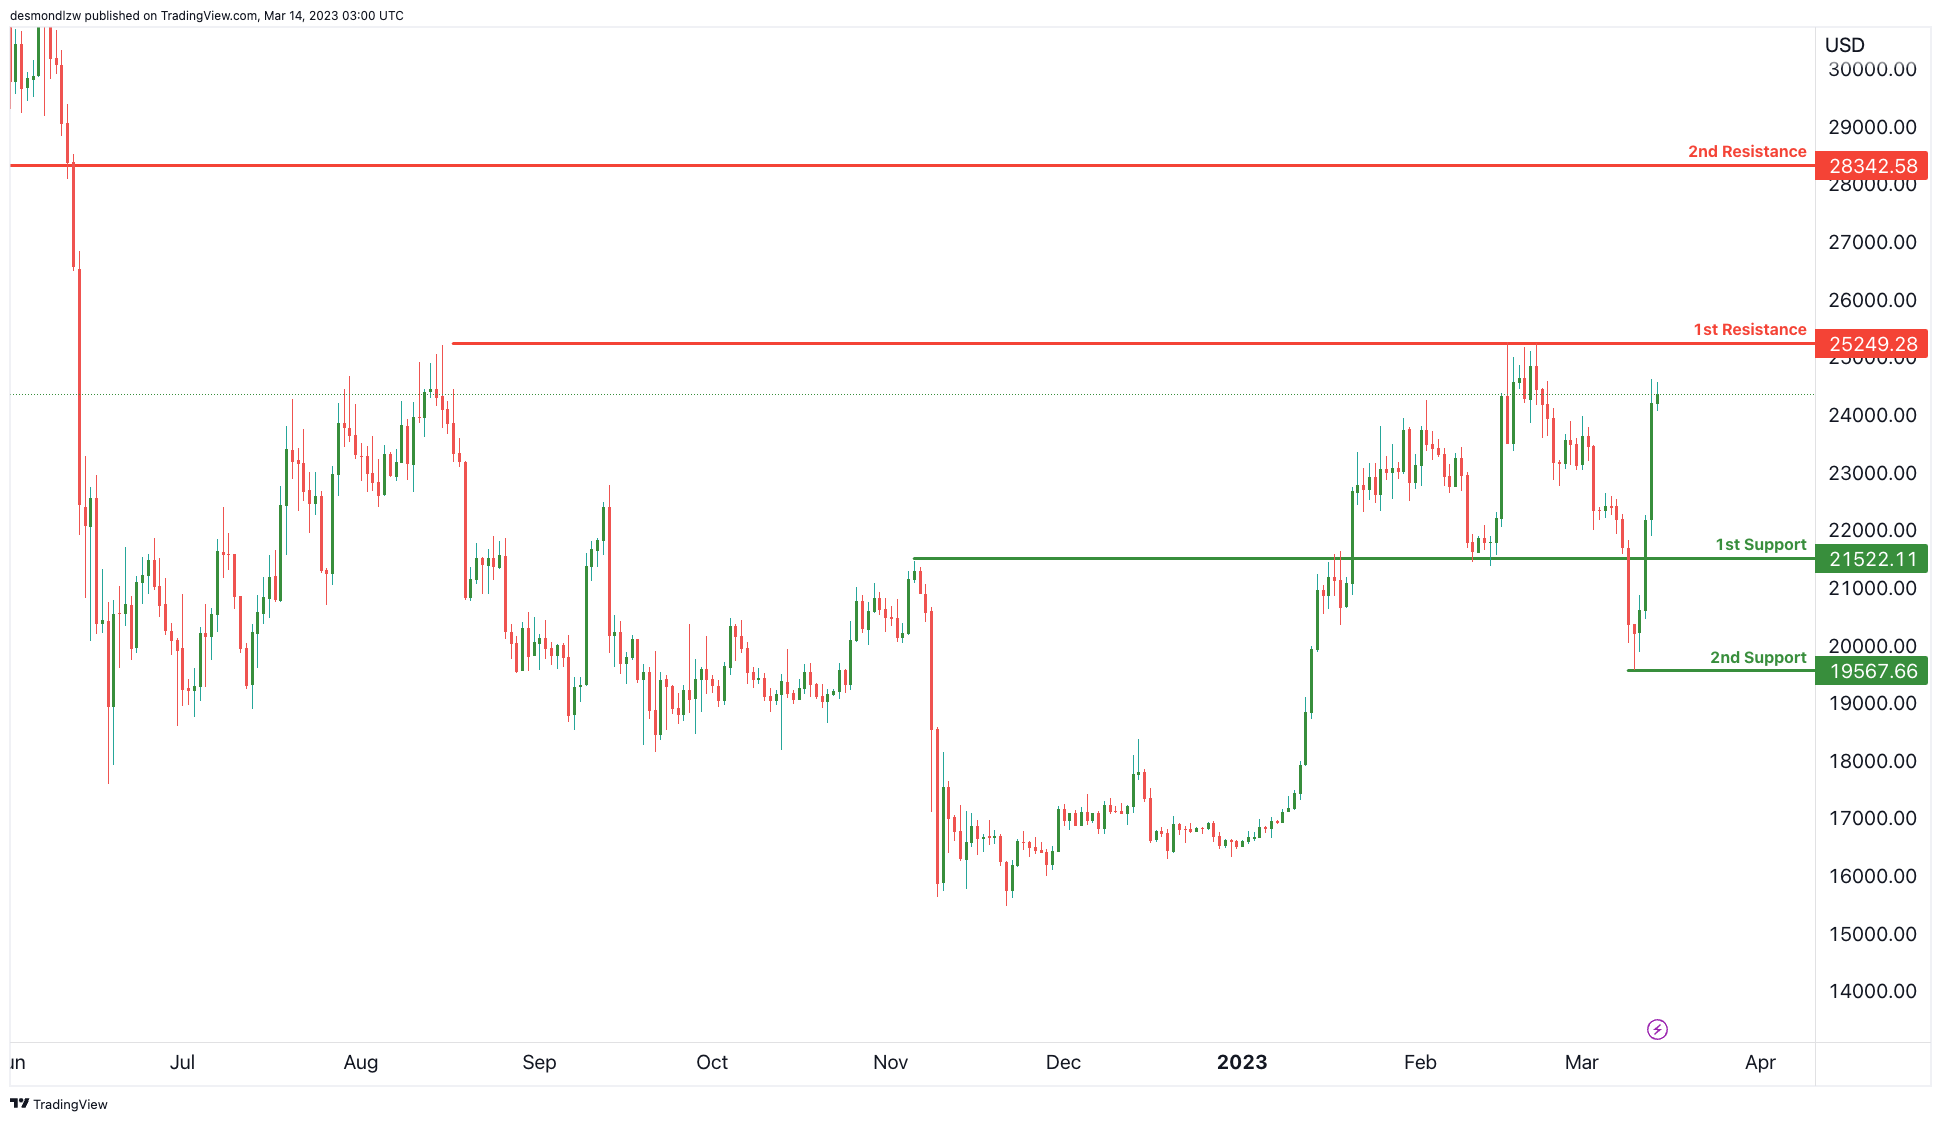
BTC/USD:
Price is approaching our 1st resistance at 25249 which is a multi-swing high resistance. If price were to break that level, the next big resistance is at 28342 which is a major overlap resistance and Fibonacci retracement.
In terms of support, the first support is at 21522 which is an overlap support that price recently broke. A break of that level would then suggest a move down to 19567.
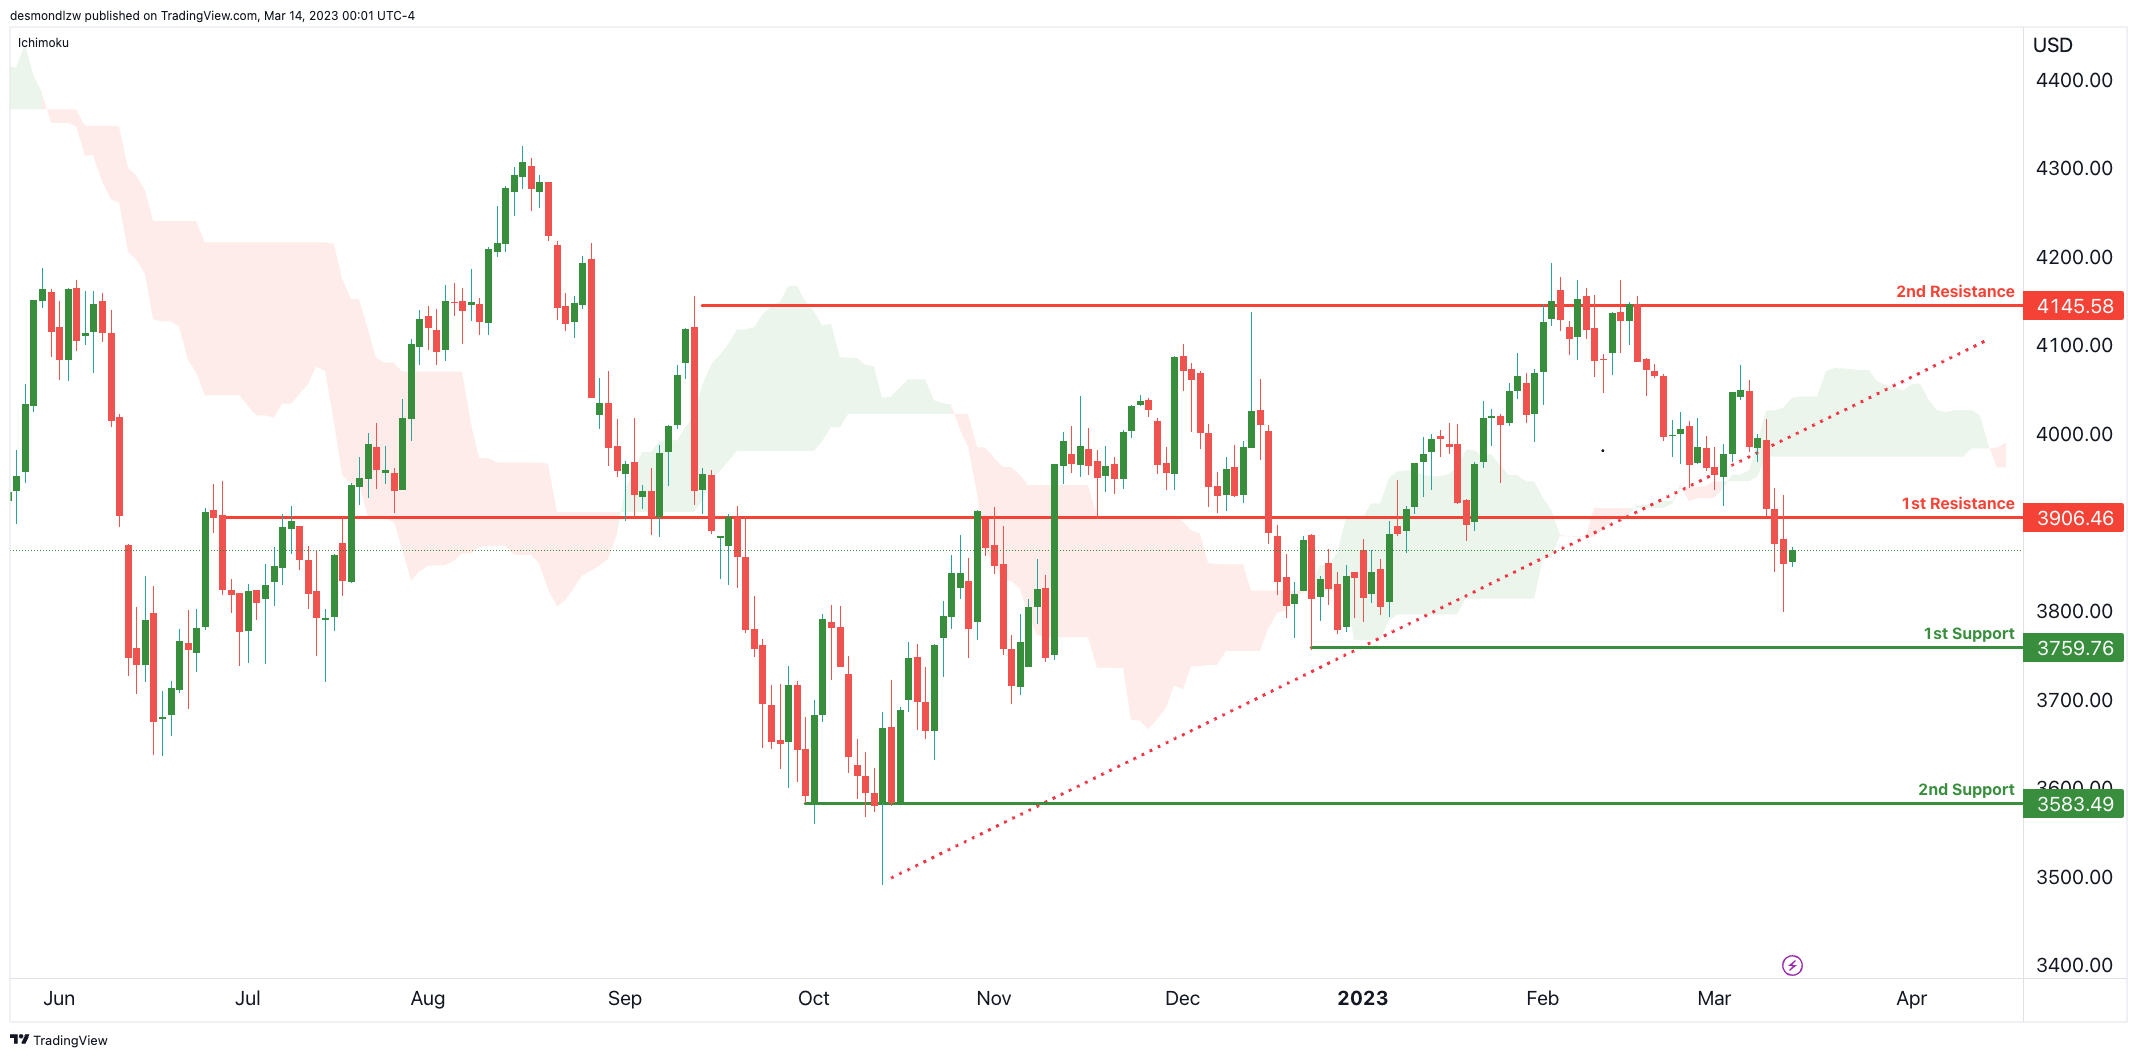
US500
Price recently broke an ascending support-turned-resistance line and crossed below the Ichimoku cloud – suggesting there might be some bearishness coming into play. It iis also currently testing our 1st resistance at 3906 which is an overlap resistance, if price were to break through, it could potentially push up to our 2nd resistance at 4145 which is a multi-swing high resistance.
Regarding the support levels, If the price were to reverse from the 1st resistance level, our 1st support is 3759 and 2nd support is 3583 which is another swing low support.
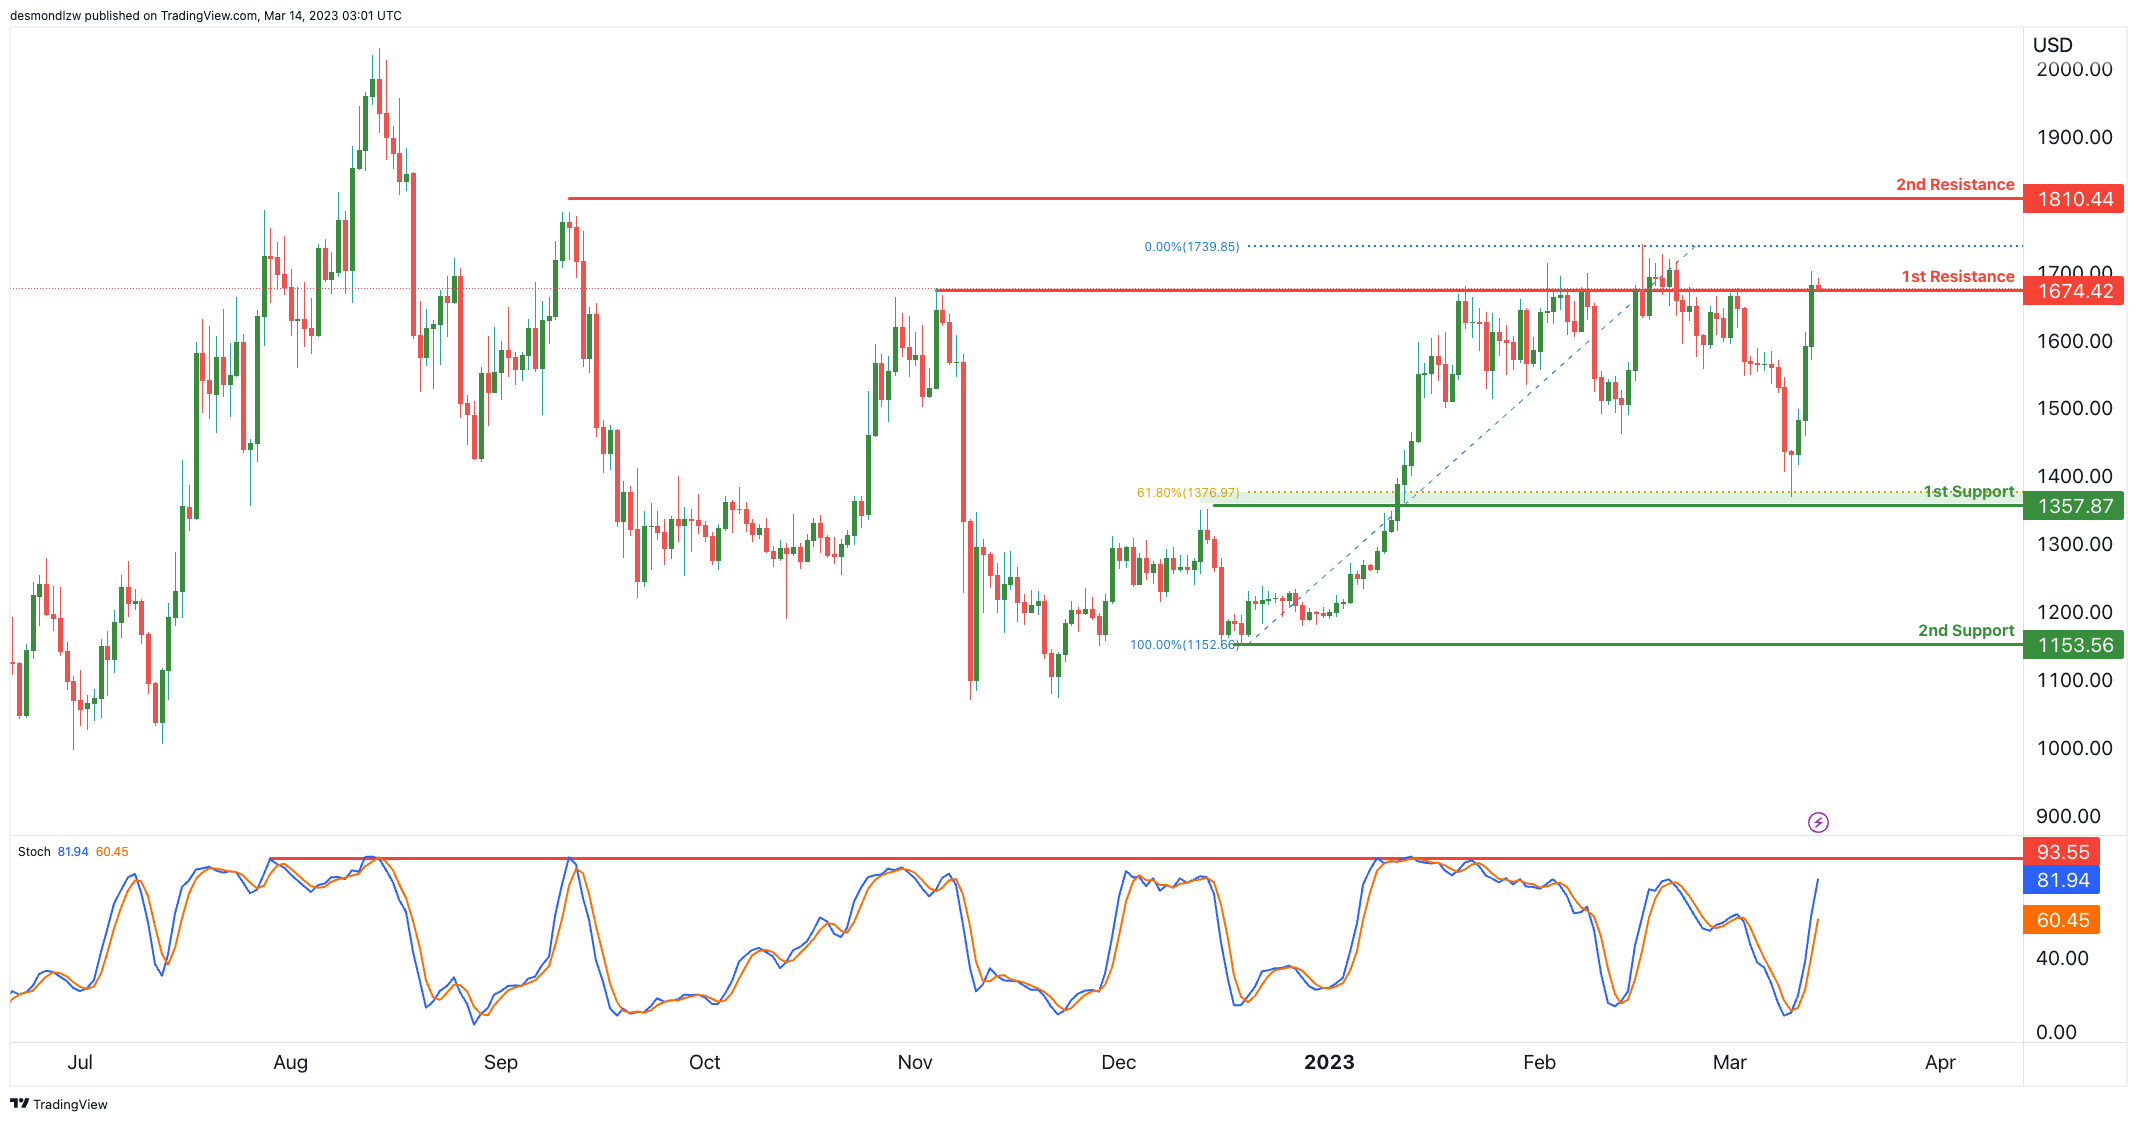
ETH/USD:
Price is testing a major resistance level at 1674 which is a multi-swing high resistance. If price were to break through this level, the next resistance would be at 1810.
Reversing from this level, we could see price drop to 1st support at 1357 which also lines up with a 61.8% Fibonacci retracement. Breaking that, the next major support would be at 1153.
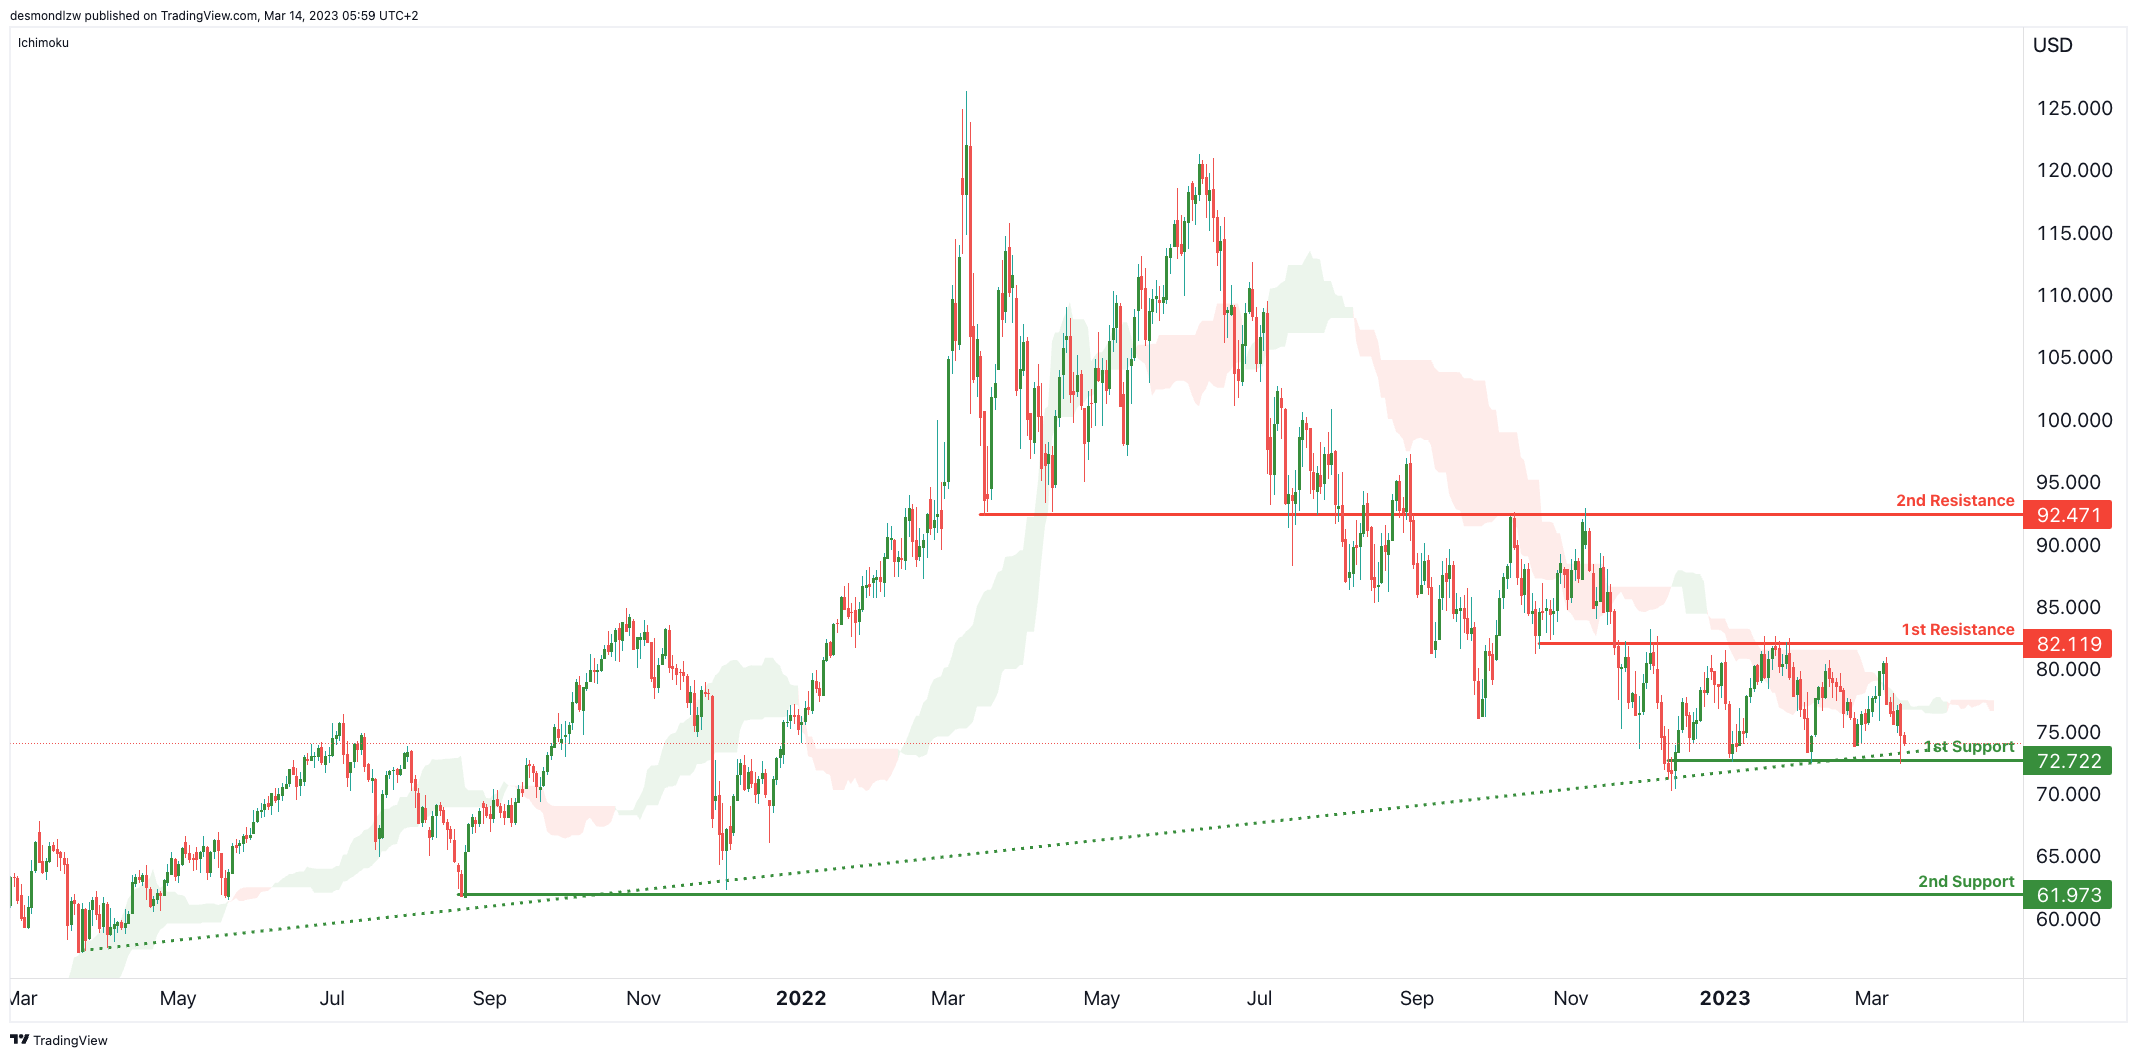
WTI/USD:
Price is respecting our ascending trendline which lines up with our 1st support level at 72.72, if price were to bounce from this level, it could push up to our 1st resistance at 82.119 which is an overlap resistance. Breaking that resistance, we could see a bigger move up to 2nd resistance at 92.47 which is a strong overlap resistance and 50% Fibonacci retracement.
If price were to break the ascending support and our 1st support at 72.72, we could see a bigger drop to 61.97 which is a major multi-swing low support.
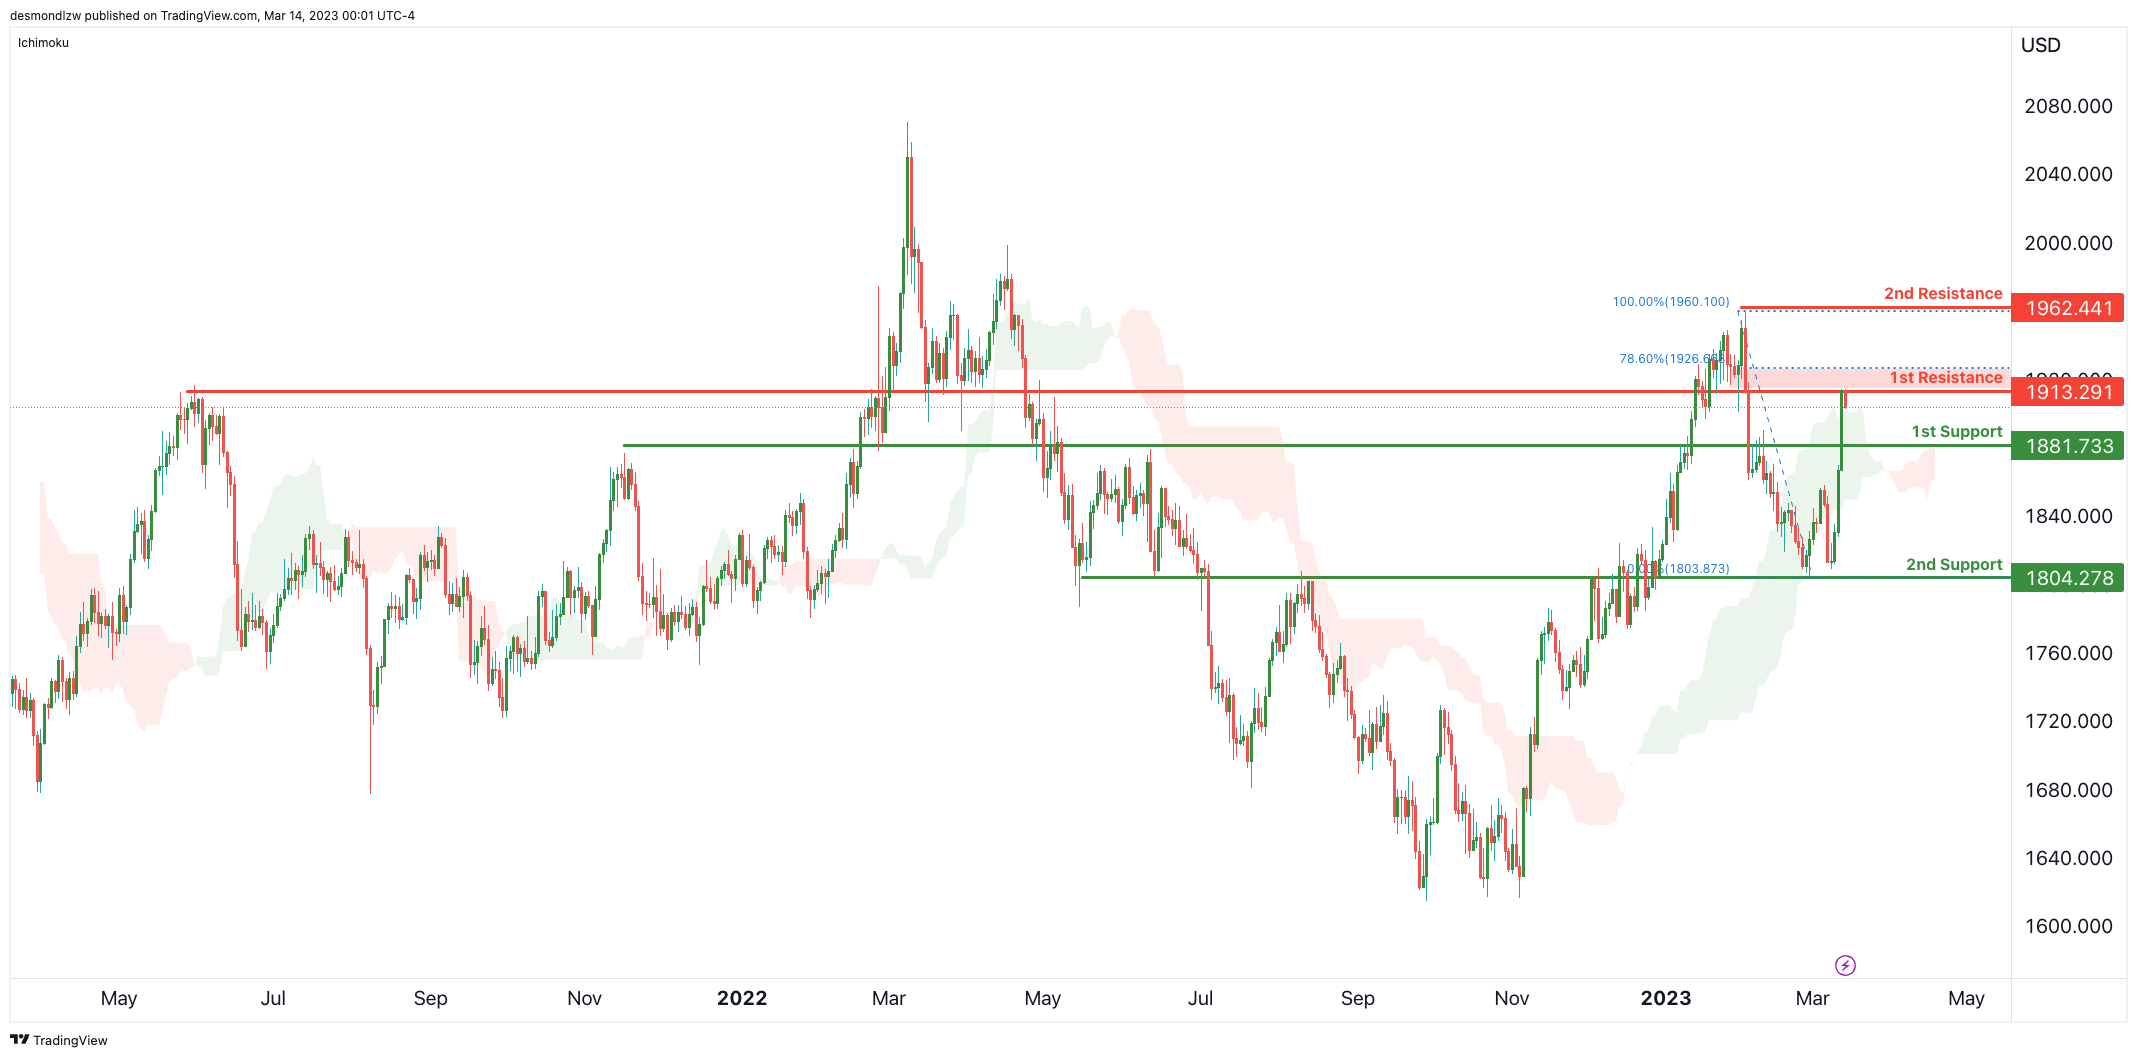
XAU/USD (GOLD):
Price is now testing a major overlap resistance at 1913 which is slightly below the 78.6% short term Fibonacci retracement. A break of this level could suggest a move up to 1962 is possible – which is the recent swing high resistance.
However, a reversal from this resistance level could see support at 1881 which is also another nice overlap support – breaking this level could trigger a move down to 2nd support at 1804 which is now only an overlap support, but a Fibonacci retracement too.
The accuracy, completeness and timeliness of the information contained on this site cannot be guaranteed. IC Markets does not warranty, guarantee or make any representations, or assume any liability regarding financial results based on the use of the information in the site.
News, views, opinions, recommendations and other information obtained from sources outside of www.icmarkets.com, used in this site are believed to be reliable, but we cannot guarantee their accuracy or completeness. All such information is subject to change at any time without notice. IC Markets assumes no responsibility for the content of any linked site.
The fact that such links may exist does not indicate approval or endorsement of any material contained on any linked site. IC Markets is not liable for any harm caused by the transmission, through accessing the services or information on this site, of a computer virus, or other computer code or programming device that might be used to access, delete, damage, disable, disrupt or otherwise impede in any manner, the operation of the site or of any user’s software, hardware, data or property.


