
Key risk events today:
Australia NAB Business Confidence; China Trade Balance; UK GDP m/m; US CPI m/m and Core CPI m/m.
(Previous analysis as well as outside sources – italics).
EUR/USD:
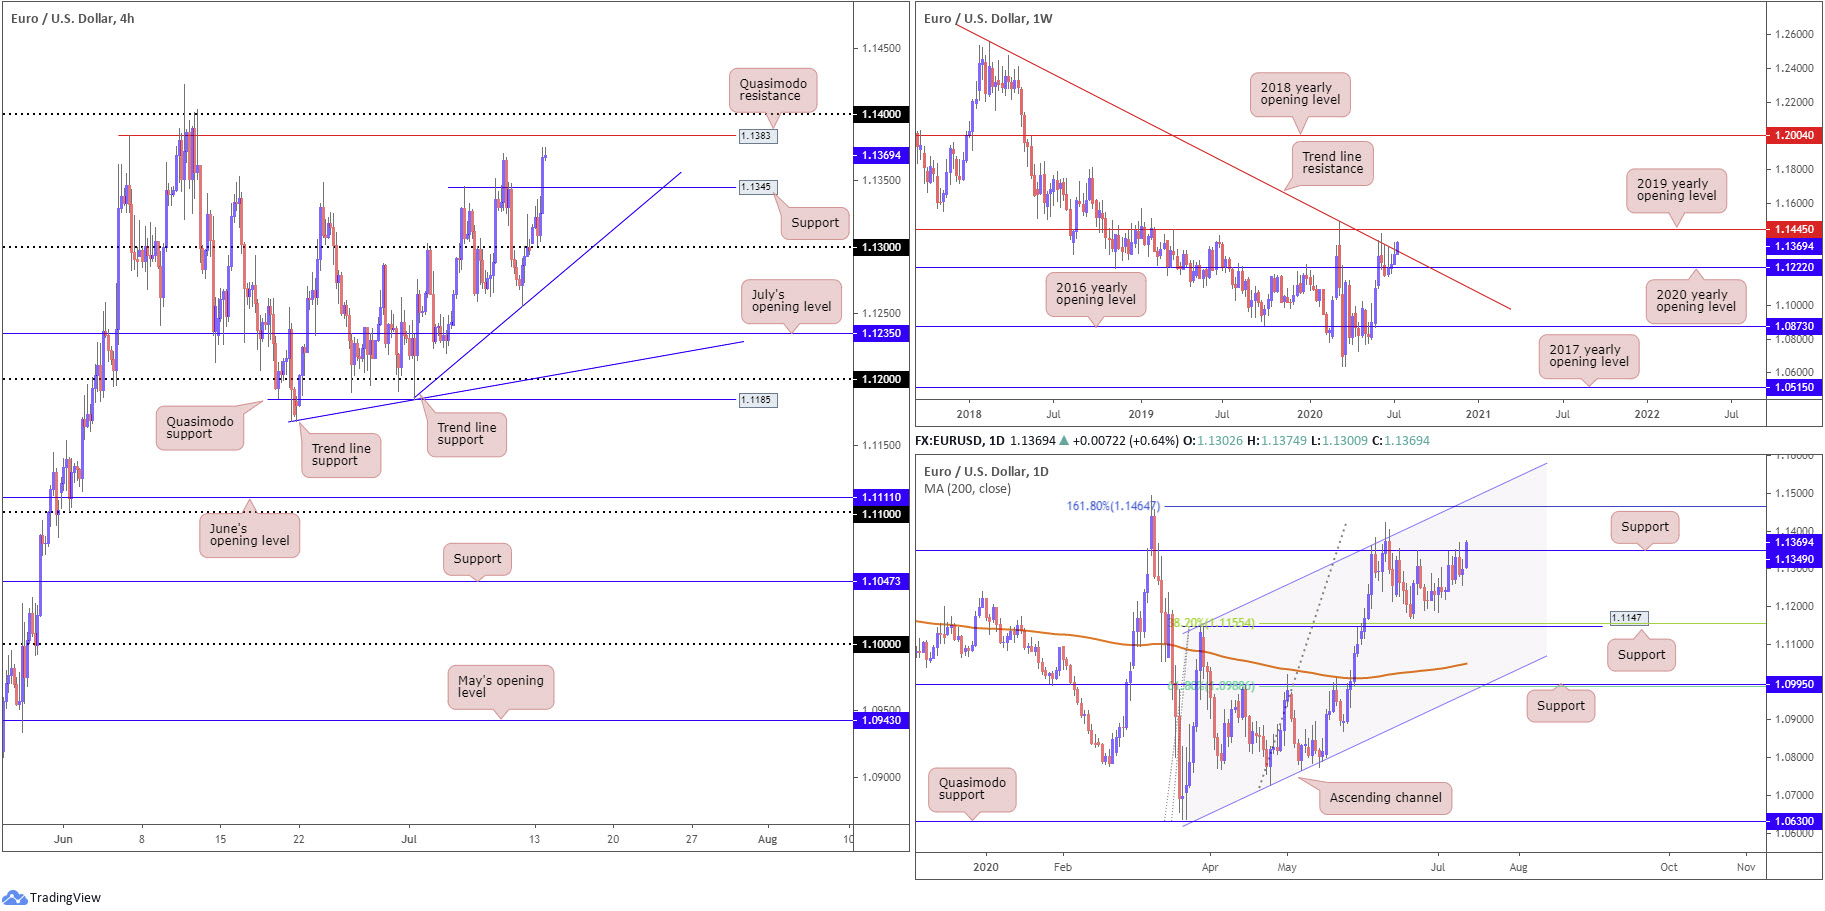
Upbeat risk sentiment guided the US dollar to lower levels Monday, subsequently lifting EUR/USD to fresh pinnacles at 1.1370ish by the European close.
H4 retested 1.13 as support and overran Quasimodo resistance at 1.1345, bringing light to another Quasimodo resistance at 1.1383, followed by the 1.14 handle. Before reaching 1.14/1.1383, traders are urged to pencil in the possibility of a retest forming at 1.1345.
Further out, Monday also took on long-term trend line resistance, extended from the high 1.2555, shifting focus on the weekly timeframe to the 2019 yearly opening level at 1.1445.
Since the beginning of June, daily resistance at 1.1349 has, as you can see, held back buyers. Recent hours, however, witnessed price penetrate the aforementioned region, pointing to a potential approach towards a 161.8% Fibonacci extension point at 1.1464, combined with a channel resistance, extended from the high 1.1147.
Areas of consideration:
With buyers managing to find their feet early on, a continuation to the upside may be in store, particularly after the break of higher timeframe resistances (weekly trend line resistance and daily resistance at 1.1349).
As a result of the above, today’s technical spotlight is fixed on 1.1345 H4 support, which may call for a retest and lure dip-buying into the fold. Conservative buyers will possibly seek additional confirmation before pulling the trigger, though irrespective of the entry method the initial take-profit targets rest at 1.1383 and 1.14 on the H4.
GBP/USD:
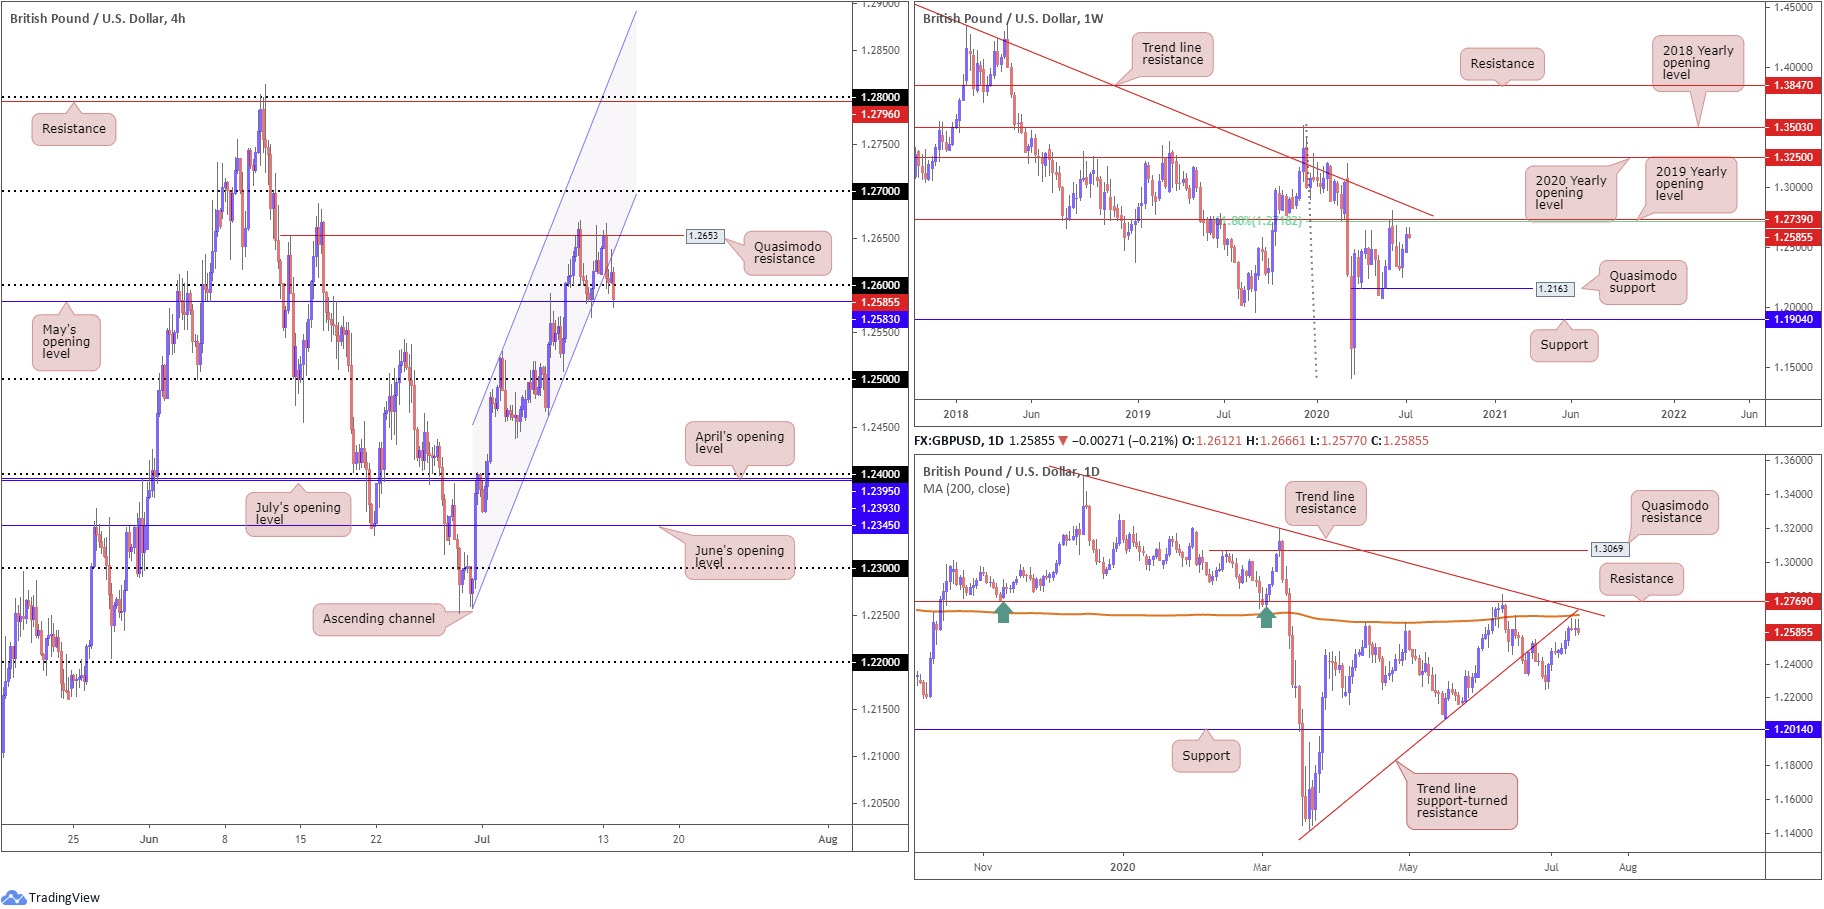
The British pound concluded a shade lower against the greenback Monday, fading H4 Quasimodo resistance at 1.2653. Downside had the unit breach channel support, taken from the low 1.2257 (and retest the underside of the latter as resistance), and compete with orders at 1.26 as well as May’s opening level at 1.2583. A notable H4 close south of the latter could trigger another wave of selling today, with crosshairs fixed on 1.25 as the next support target.
The story on the weekly timeframe, following two consecutive weeks of gains, has price located within touching distance of a 61.8% Fibonacci retracement ratio at 1.2718 and the 2019 yearly opening level at 1.2739. Despite the recent sell, striking this area remains a possibility.
Movement on the daily timeframe, meanwhile, languishes just south of substantial resistance, made up of trend line support-turned resistance, taken from the low 1.1409, another trend line resistance, extended from the high 1.3514, the 200-day SMA (orange – 1.2689) and resistance at 1.2769. This resistance combination also boasts a connection to the aforementioned weekly resistances.
Areas of consideration:
A decisive H4 close south of 1.2583 may imply sellers have enough fuel in the gas tank to push lower, despite not having brought in higher timeframe resistances (see above). While aggressive sellers may opt for an entry at the close of the breakout candle, a retest at the underside of 1.2583 provides an additional entry point to consider, particularly for conservative traders.
Failing the above, a rally to 1.27 would be interesting. Not only does the psychological base represent a take-profit target for longs north of the 1.26 vicinity, the round number emphasises robust resistance, closely joined by a collection of daily and weekly resistances (highlighted above).
AUD/USD:
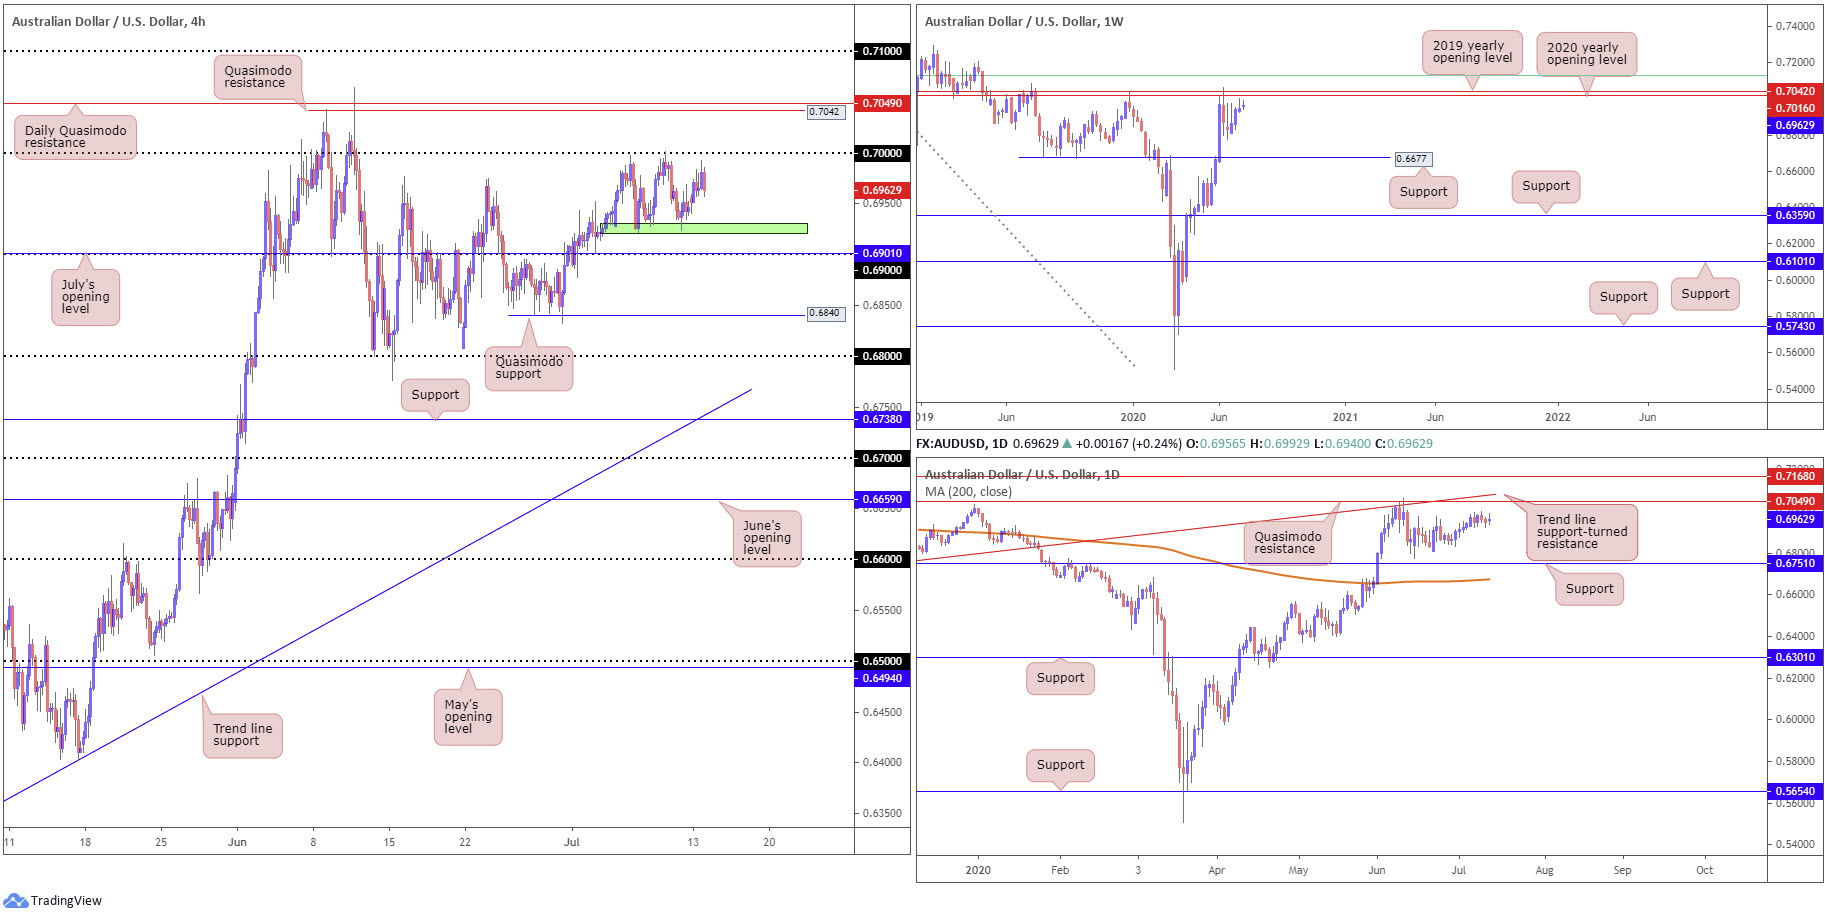
The Australian dollar initially rose on the upbeat risk tone Monday as the US dollar navigated deeper terrain. Things turned sour in recent hours, though, as risk levelled off, forcing an intraday top ahead of 0.70 on the H4. Local H4 support around 0.6930ish (green) is seen close by. If a break comes to pass, the H4 candles are bound for 0.69 and July’s opening level at 0.6901. South of here, the pair appears starved of support until a Quasimodo formation hits at 0.6840.
Overall, AUD/USD ended Monday unmoved, producing an indecision candle on the daily timeframe.
From the weekly timeframe, resistance, forged in the shape of a 2020 yearly opening level and a 2019 yearly opening level, at 0.7016 and 0.7042, respectively, remains on the radar. It might also interest some traders to note just above the said resistances we have a 61.8% Fibonacci retracement ratio sited at 0.7128 (green). In terms of support on the weekly timeframe, crosshairs remain fixed on 0.6677.
A closer reading of candle action on the daily timeframe shows price wandering no man’s land (lack of technical structure), albeit steadily grinding higher. Of particular interest on the chart, however, is Quasimodo resistance positioned at 0.7049, a level linking with trend line support-turned resistance, taken from the low 0.6670. Another level worth noting is support coming in at 0.6751 and the 200-day SMA (orange – 0.6674).
Areas of consideration:
With the round number 0.70 (H4) sharing space with weekly resistance at 0.7016, the 2020 yearly opening level, this combination remains a key reversal zone to watch.
Clearing 0.70, on the other hand, brings H4 Quasimodo resistance at 0.7042 to light, which not only lines up with the 2019 yearly opening level on the weekly timeframe, daily Quasimodo resistance also resides close by at 0.7049. Given that, this area is also worthy of the watchlist.
To the downside, we have the 0.69 handle merging with July’s opening level at 0.6901 on the H4. Although capable of withstanding downside attempts, the base lacks higher timeframe confluence, therefore vulnerable.
USD/JPY:
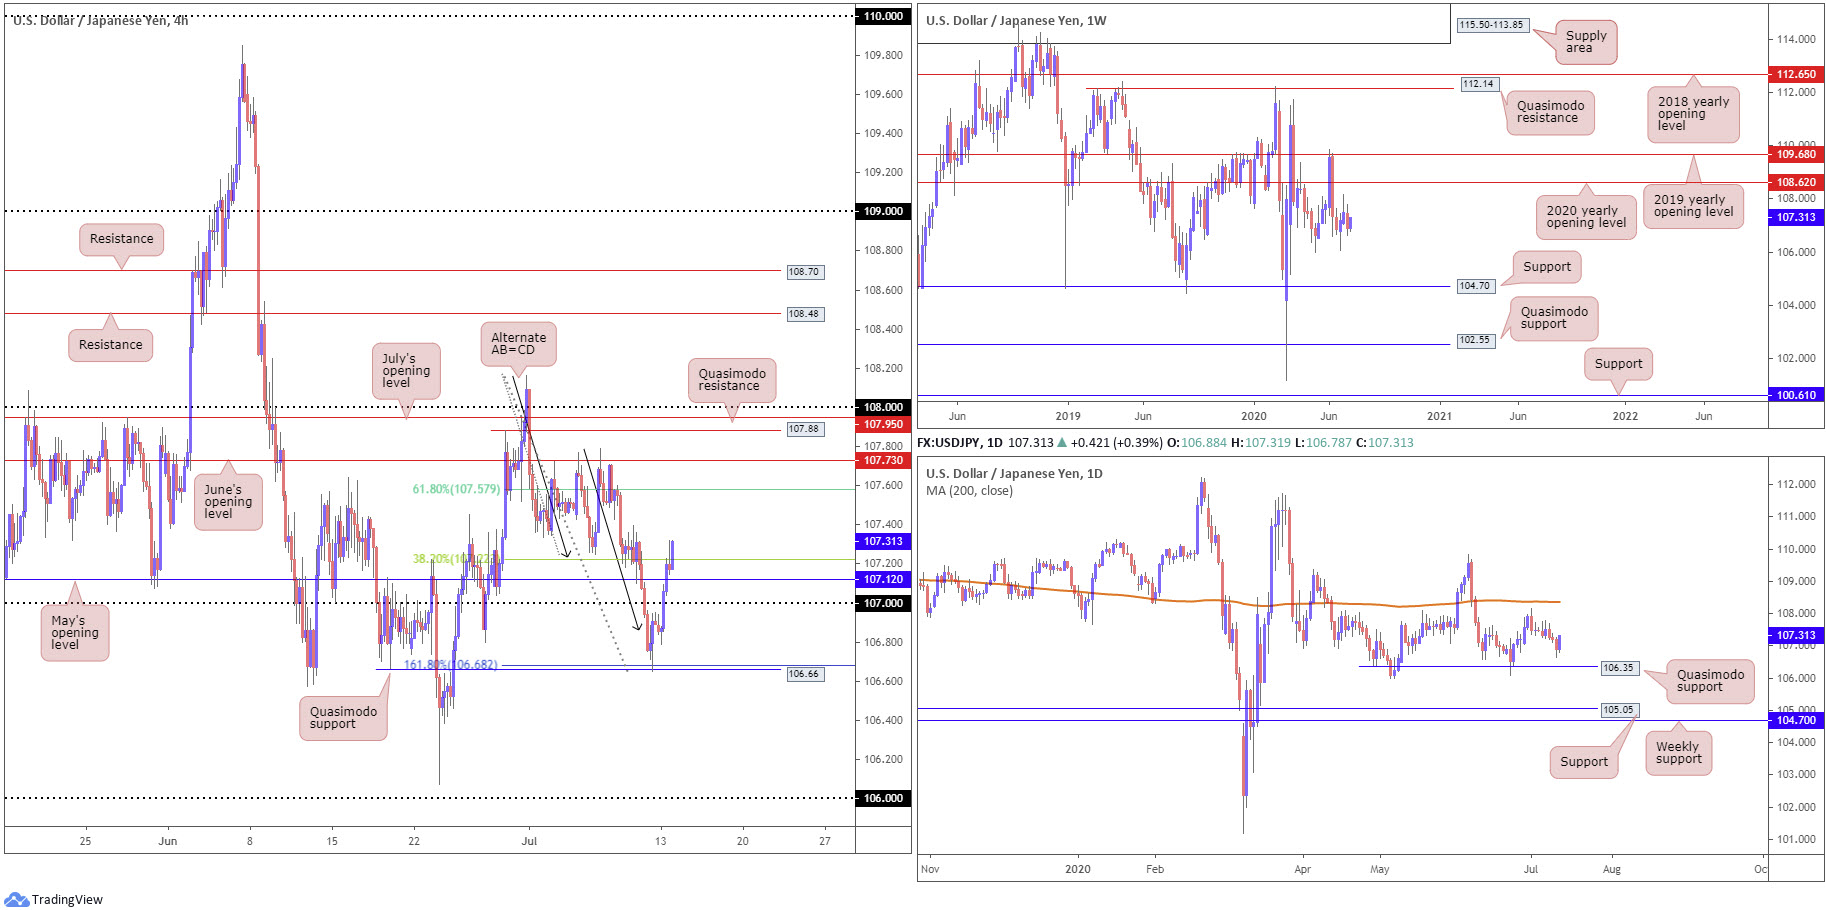
Risk-on trade elevated USD/JPY northbound Monday, as traders abandoned the safe-haven Japanese yen in favour of risk, snapping a three-day bearish phase.
For traders who read Monday’s technical briefing you may recall the following (italics):
The US dollar extended losses against its Japanese counterpart Friday, leaping through 107 support and testing an interesting area of support at 106.68, in the shape of a strong bullish candle. 106.68, a 161.8% Fibonacci extension point that converges closely with Quasimodo support at 106.66, represents the completion of what is known as an ‘alternate AB=CD (black arrows) correction’.
It is common for AB=CD traders to target the 38.2% Fibonacci retracement (derived from legs A-D), which in this case is seen at 107.22. The second take-profit target is generally found at the 61.8% Fibonacci retracement ratio (107.57).
As evident from the H4 chart, the 38.2% Fibonacci retracement ratio at 107.22 is currently under pressure, thanks to yesterday’s advance, no doubt pleasing longs off 106.66. The next target, as emphasised above, rests at the 61.8% Fibonacci retracement ratio from 107.57.
Further afield on the weekly timeframe, price is seen ranging beneath the 2020 yearly opening level at 108.62. Support, on the other hand, can be derived from the 105.98 6th May low, with a break uncovering long-term support plotted at 104.70. Technical structure on the daily timeframe remains focused on Quasimodo support from 106.35 and the 200-day SMA (orange – 108.36), assuming we get past 108.16 July 1st high.
Areas of consideration:
H4 AB=CD traders likely reduced risk to breakeven and banked partial profits at 107.22, with follow-through buying expected to reach the 61.8% Fibonacci retracement ratio from 107.57. Before reaching the latter, a retest at May’s opening level from 107.12 could come to fruition, a move that may provide a platform for additional longs to 107.57.
USD/CAD:
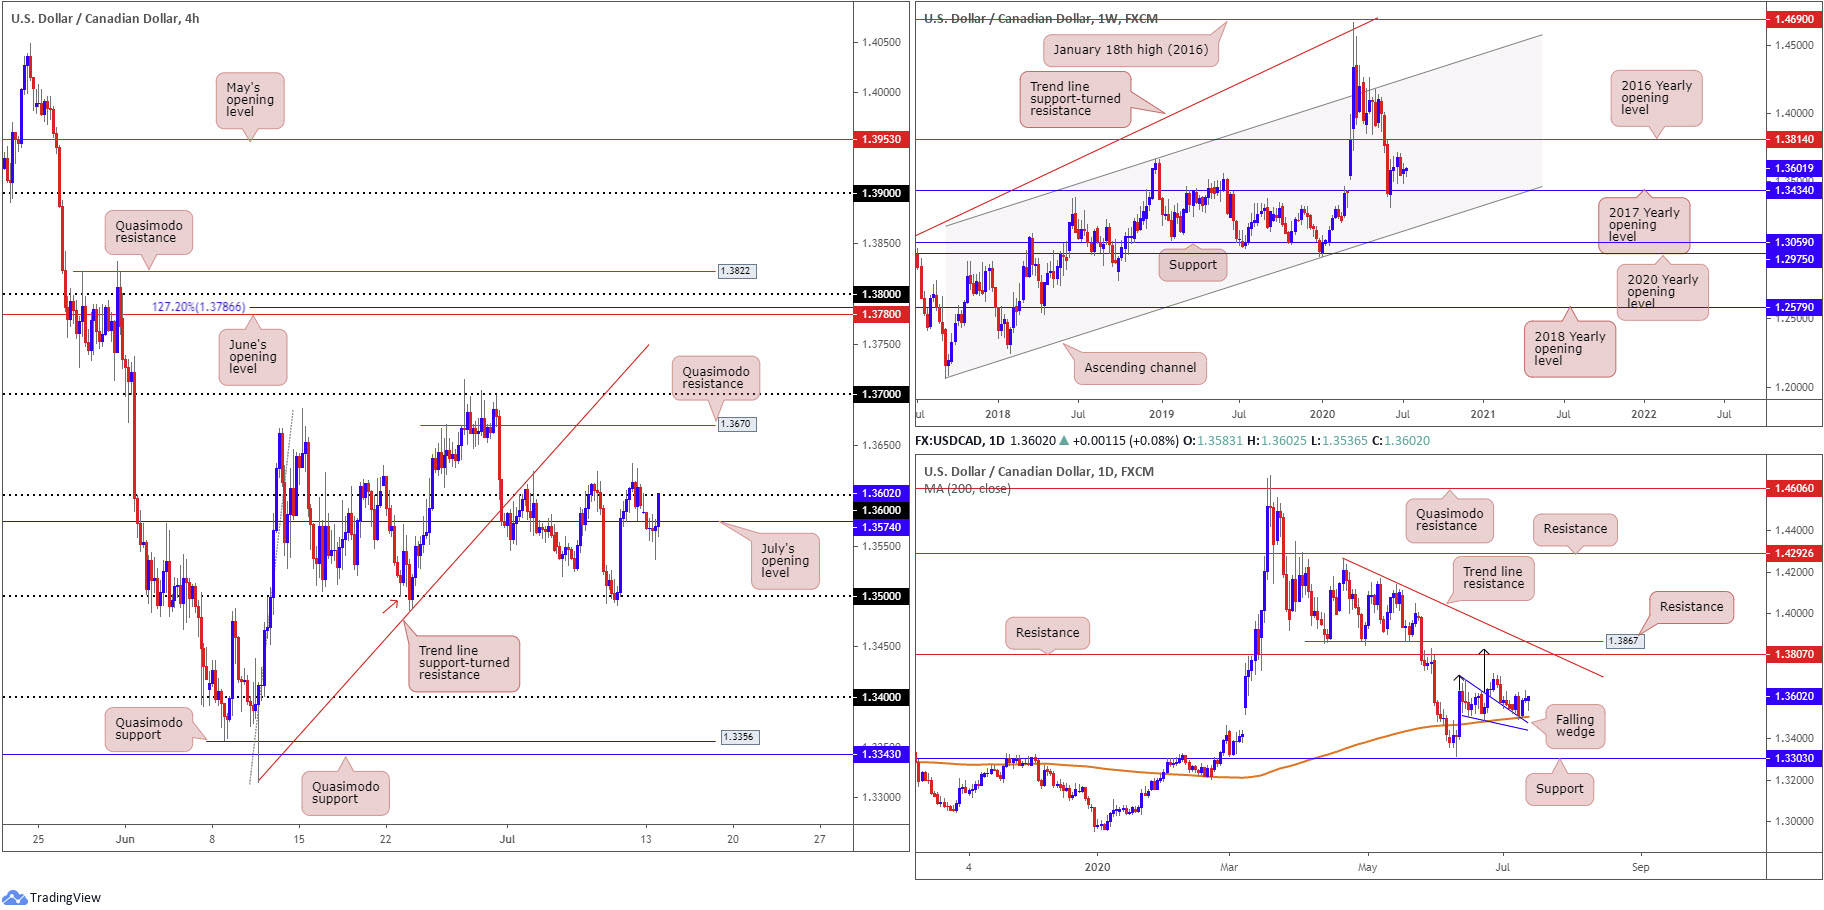
USD/CAD bulls found fresh legs after piercing 1.3550 as waning WTI prices weighed on the Canadian dollar. The move took H4 back above July’s opening level at 1.3574 and to within touching distance of 1.36. Clearing the round number today throws Quasimodo resistance at 1.3670 in the pot as a potential ceiling, followed by the 1.37 handle.
Action on the weekly timeframe currently hovers north of the 2017 yearly opening level at 1.3434. Beyond 1.3434, channel support, taken from the low 1.2061, can be viewed as the next potential floor. A USD/CAD bid throws the 2016 yearly opening level at 1.3814 in the pot as feasible resistance, with follow-through buying to try and tackle a dense block of supply between 1.4190/1.3912.
Technical action on the daily timeframe witnessed a recovery form from the upper edge of a breached falling wedge pattern (1.3686/1.3504) into the second half of last week, merging with the 200-day SMA (1.3504). Take-profit targets out of a falling wedge pattern can be measured by taking the base value and adding this figure to the breakout point (black arrows), which as you can see in this case, meets closely with resistance at 1.3807, followed by another layer of resistance at 1.3867.
Areas of consideration:
Owing to daily structure, and lack of resistance on the weekly timeframe, traders are still likely watching for a decisive H4 close to form above 1.36, seeking bullish themes towards at least H4 Quasimodo resistance at 1.3670 and 1.37.
USD/CHF:
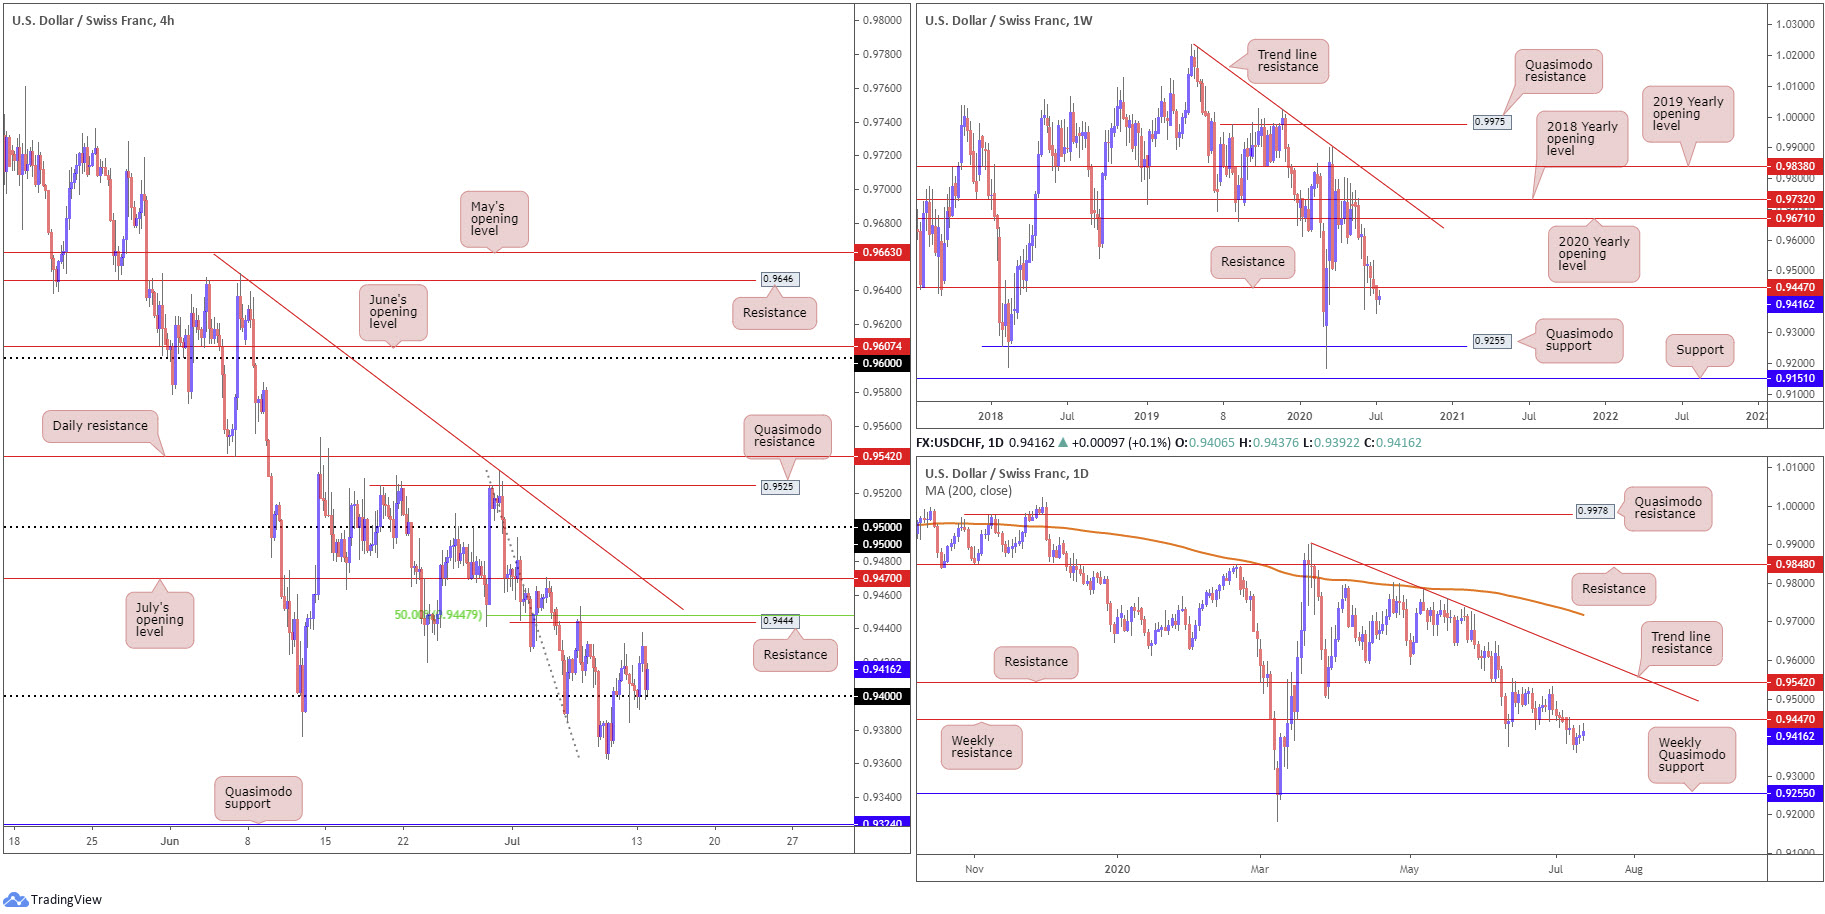
From the weekly timeframe, we can see price recently dipped through support at 0.9447 (now a serving resistance), chalking up a third consecutive weekly decline. The break south has likely caught the attention of sellers, targeting Quasimodo support plotted at 0.9255.
The daily timeframe offers a similar picture to the weekly chart at the moment, underlining bearish themes south of the recently penetrated weekly support at 0.9447, targeting 0.9255.
USD/CHF bulls, as you can see, continue to defend 0.94 on the H4 chart, withstanding an energetic pop to lows at 0.9384 Friday and another attempt at lower levels Monday. Assuming buyers uphold position here, resistance at 0.9444 could make an appearance, a level aligning closely with a 50.00% retracement ratio at 0.9447 and weekly resistance, also at 0.9447.
Areas of consideration:
Some intraday buyers may still feel bullish positions off 0.94 could be worth a shot. Upside targets, as underscored above, can be found just south of 0.9450, an area containing weekly resistance at 0.9447. The 0.9450 neighbourhood, therefore, given the higher timeframes, is also likely viewed as a location active sellers could make an appearance from if tested.
If, on the other hand, higher timeframe sellers head for deeper waters before H4 shakes hands with 0.9450, it is likely a breach of 0.94 will materialise, re-opening the possibility of moves to 0.9324 on the H4, a Quasimodo support.
Dow Jones Industrial Average:
Monday’s initial upbeat tone fizzled out into late trade amid fears concerning another coronavirus lockdown. The Dow Jones Industrial Average advanced 10.50 points, or 0.04%; the S&P 500 dropped 29.82 points, or 0.94%, and the tech-heavy Nasdaq 100 concluded lower by 234.12 points, or 2.16%.
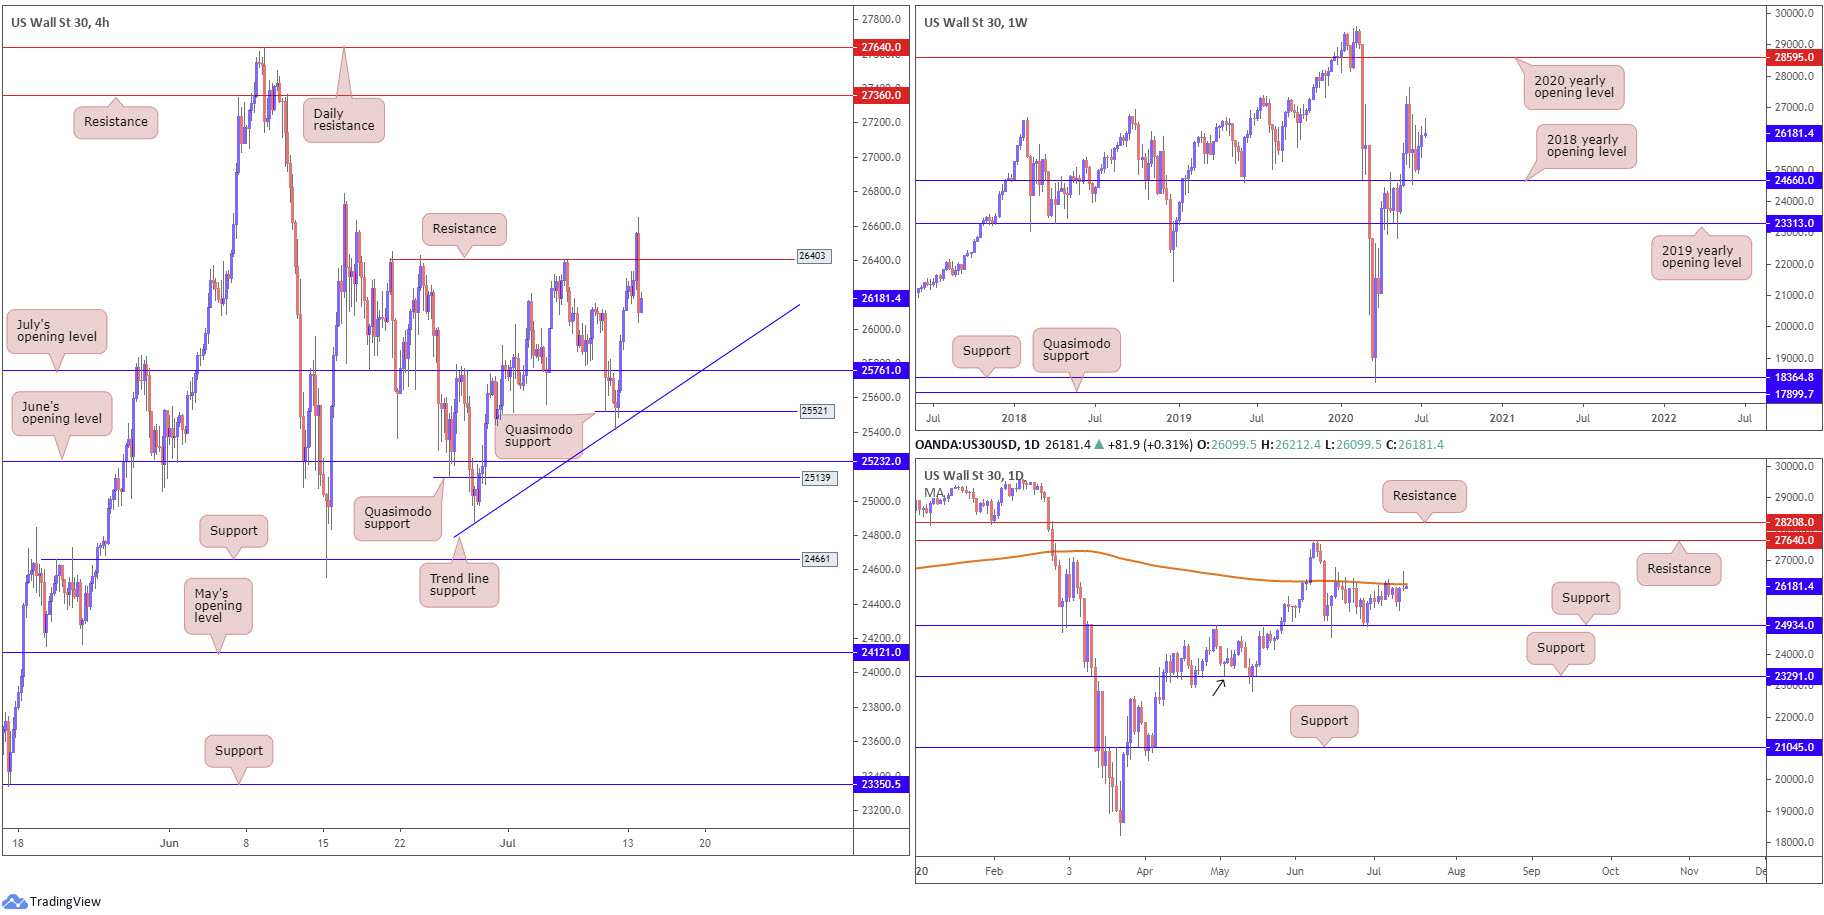
From the weekly timeframe, the 2018 yearly opening level at 24660 remains an important base of support. In the event traders manage to keep their head above water here, we might pull in the 27638 high this week, followed by the 2020 yearly opening level at 28595. Overrunning 24660, however, could bring light to the 2019 yearly opening level at 23313.
Since June 15, price action on the daily timeframe has ranged between the 200-day SMA (orange – 26243) and support from 24934. The aforementioned SMA remains in the spotlight for the time being, restraining buyers on Monday and consequently producing a shooting star candlestick pattern. A break higher, however, not only helps confirm upside strength on the weekly timeframe, it points to a probable run towards daily resistance from 27640.
The technical story on the H4 timeframe shows yesterday’s movement whipsawed through resistance at 26403, and tested highs at 26647. This has shined the spotlight back on July’s opening level at 25761 and nearby trendline support, taken from the low 24881. Above 26403, on the other hand, the 26787 high resides close by, with a break exposing resistance coming in at 27360.
Areas of consideration:
The shooting star candle pattern formed on the daily timeframe will likely be a welcomed (bearish) sight for some traders today, targeting daily support coming in at 24934. This will, of course, have you go up against weekly directional flow (currently north off support).
In terms of the H4 timeframe, the technical landscape indicates further losses could be in store, targeting July’s opening level at 25761 and nearby trendline support, taken from the low 24881.These levels, given the weekly timeframe, could be somewhere we see buyers attempt to make an appearance.
XAU/USD (GOLD):
XAU/USD ended Monday pretty much unchanged.
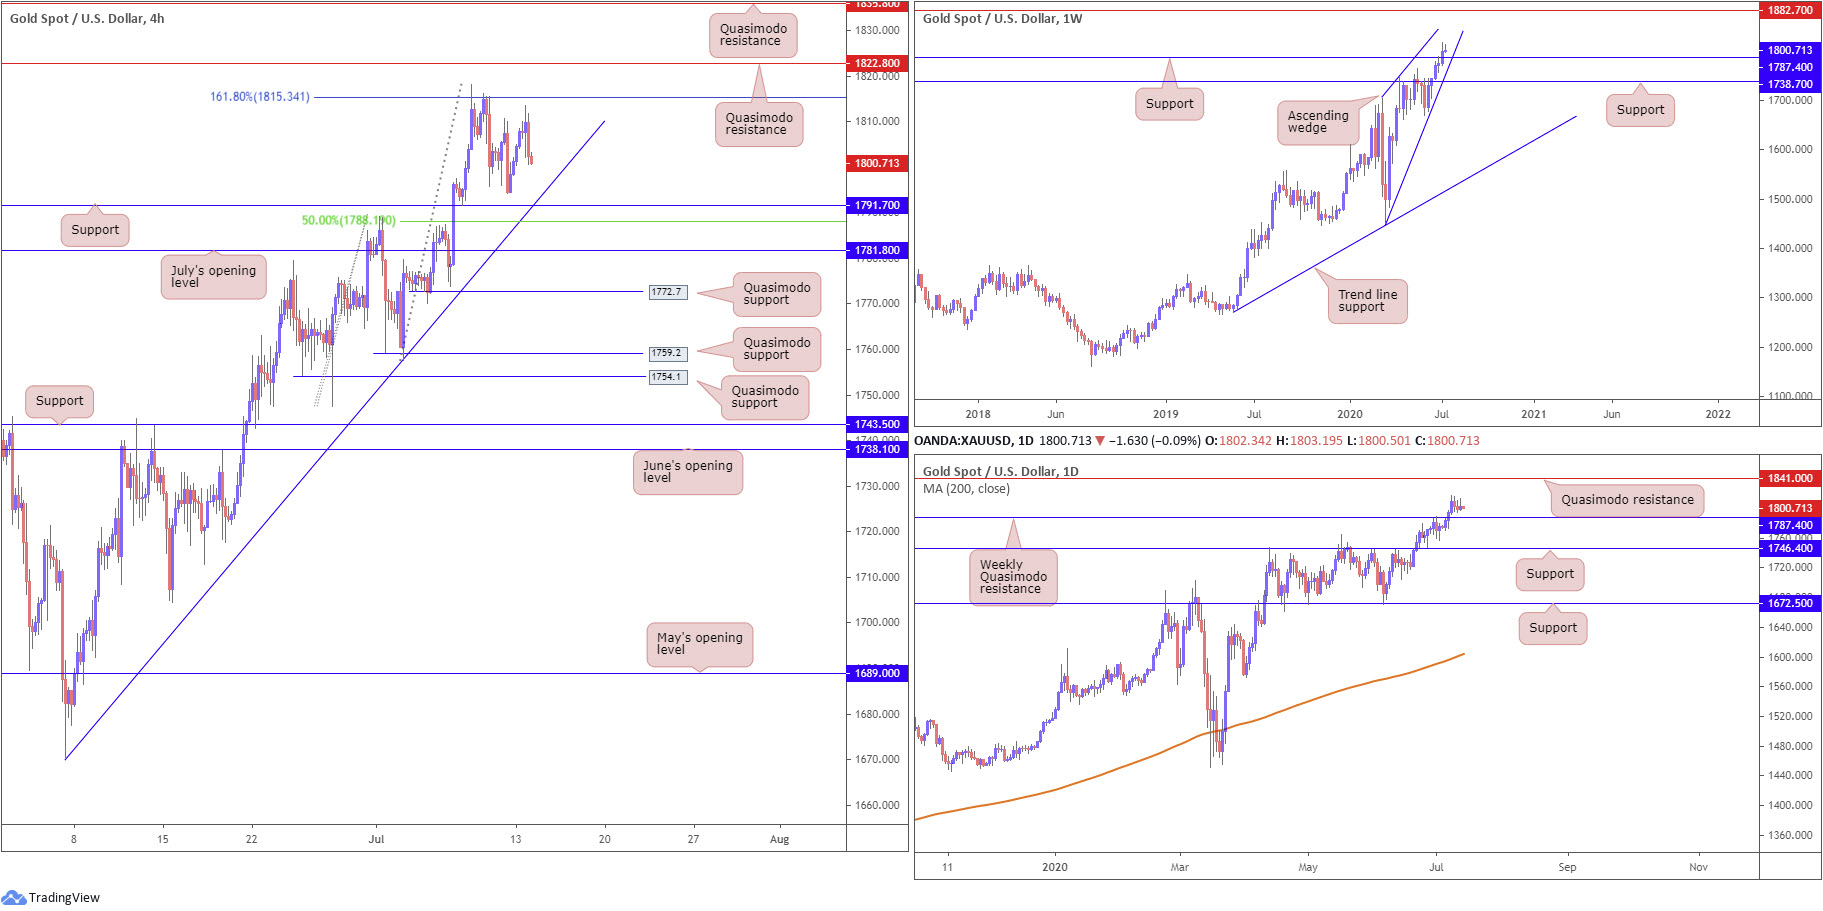
From the weekly timeframe, bulls elbowed above Quasimodo resistance at 1787.4 (now a serving support) in recent trading. In line with the underlying trend, the break higher has perhaps laid the foundation for continuation buying to resistance stationed at 1882.7. Also of interest on the weekly timeframe is a potential ascending wedge pattern, forming between 1451.4/1703.2.
In addition, clearing weekly Quasimodo resistance at 1787.4 on the daily timeframe stresses a possible run to daily Quasimodo resistance at 1841.0. Before reaching 1841.0, though, traders may want to pencil in the possibility of a 1787.4 retest.
H4 remains under the 161.8% Fibonacci extension point at 1815.3, with support underlined nearby at 1791.7, closely merging with trend line support, extended from the low 1670.4, and a 50.00% retracement at 1788.1. What’s also appealing here is weekly support at 1787.4 dovetails closely with the aforementioned structure.
Areas of consideration:
With higher timeframes recently conquering resistance and, at least for the time being, holding firm, H4 support at 1791.7/H4 trend line support likely remains of interest as a reversal zone today.
As for upside targets, traders may have the 161.8% H4 Fibonacci extension point at 1815.3 eyed as the initial take-profit zone, followed by H4 Quasimodo resistance at 1822.8.
The accuracy, completeness and timeliness of the information contained on this site cannot be guaranteed. IC Markets does not warranty, guarantee or make any representations, or assume any liability regarding financial results based on the use of the information in the site.
News, views, opinions, recommendations and other information obtained from sources outside of www.icmarkets.com.au, used in this site are believed to be reliable, but we cannot guarantee their accuracy or completeness. All such information is subject to change at any time without notice. IC Markets assumes no responsibility for the content of any linked site.
The fact that such links may exist does not indicate approval or endorsement of any material contained on any linked site. IC Markets is not liable for any harm caused by the transmission, through accessing the services or information on this site, of a computer virus, or other computer code or programming device that might be used to access, delete, damage, disable, disrupt or otherwise impede in any manner, the operation of the site or of any user’s software, hardware, data or property.


