
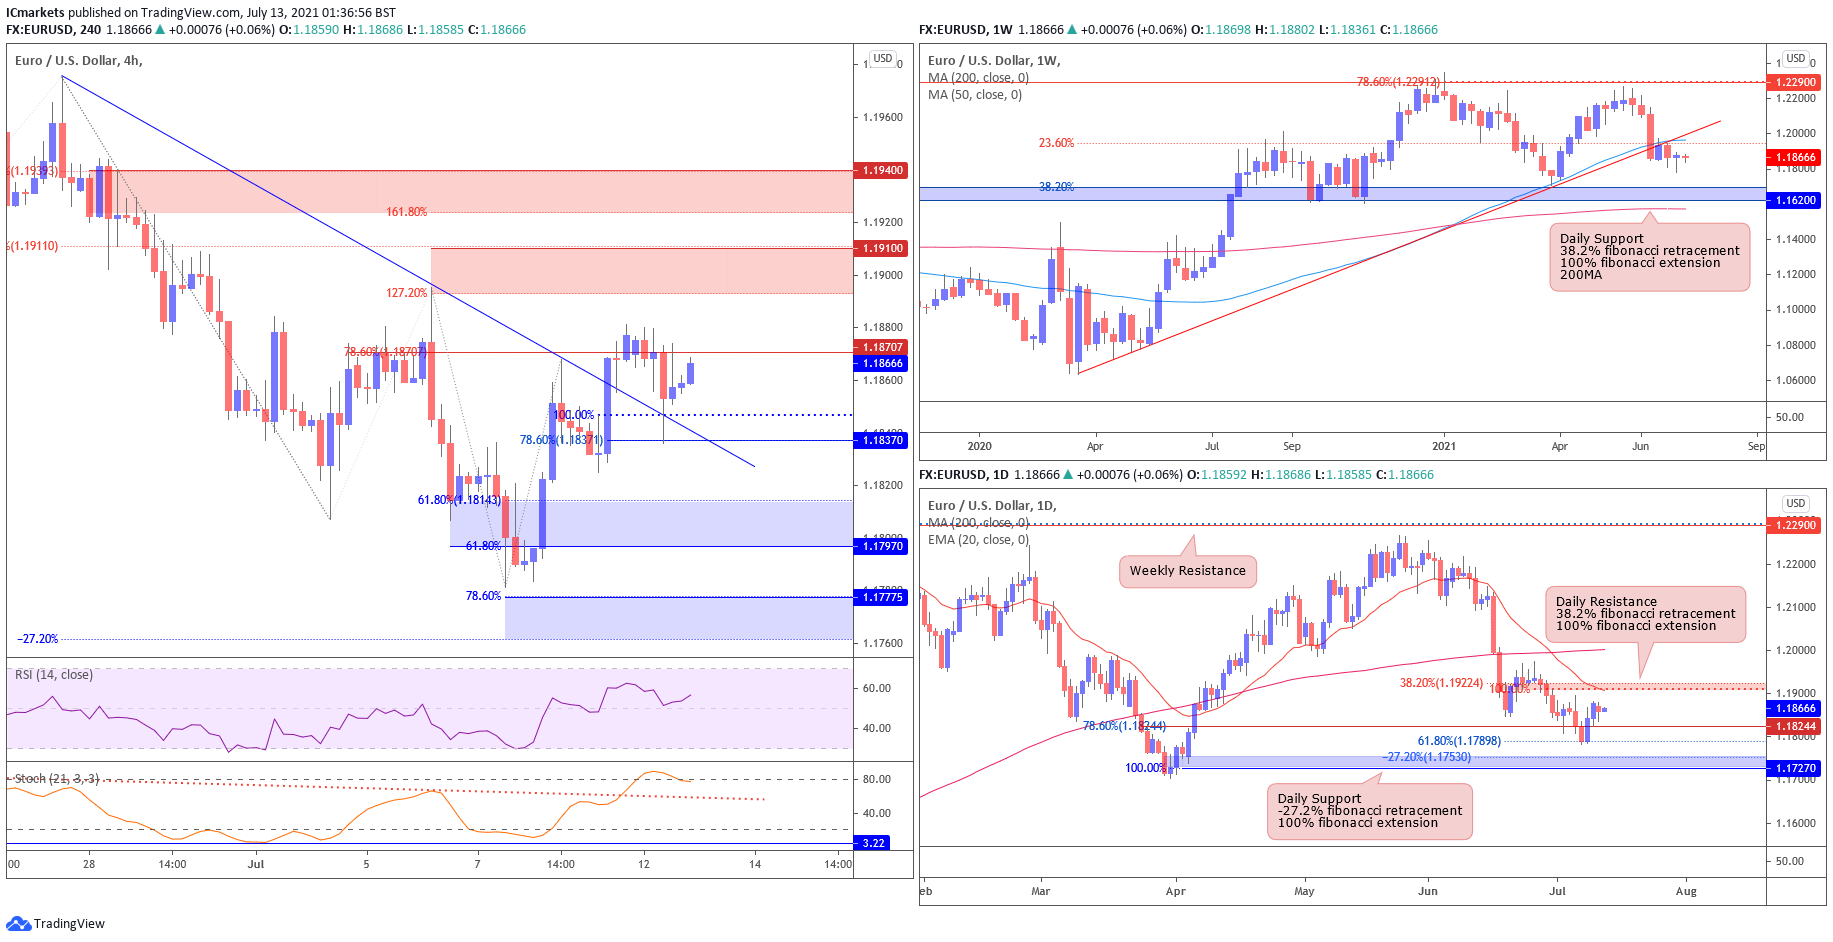
EUR/USD:
Looking at the weekly chart we can see that prices face bearish pressure from the ascending trendline support-turned-resistance and 23.6% Fibonacci retracement. On the daily chart, prices found support and bounced at 1.17975, in-line with 61.8% Fibonacci extension. We could possibly see the price swing towards resistance at 1.19000, in-line with 38.2% Fibonacci retracement, 100% Fibonacci extension and 20EMA.
On the H4 timeframe, prices dropped to retest support at 1.18370, in-line with 78.6% Fibonacci retracement, 100% Fibonacci extension and descending trendline resistance-turned-support. We could possibly see a low-probability scenario where the price swings towards first resistance at 1.19100, in-line with 61.8% Fibonacci retracement and 127.2% Fibonacci extension. Both RSI and Stochastic are also indicating further bullish momentum. The next resistance will be at 1.19400, in-line with 78.6% Fibonacci retracement and 161.8% Fibonacci extension.
If the price drops from here, it will swing towards first support at 1.17970, in-line with 61.8% Fibonacci retracement and 61.8% Fibonacci extension. The next support level will be at 1.17775, in-line with -27.2% Fibonacci retracement and 78.6% Fibonacci extension.
Areas of consideration:
- H4 time frame, support level at 1.17970 and 1.17775
- H4 time frame, resistance level at 1.19100 and 1.19400
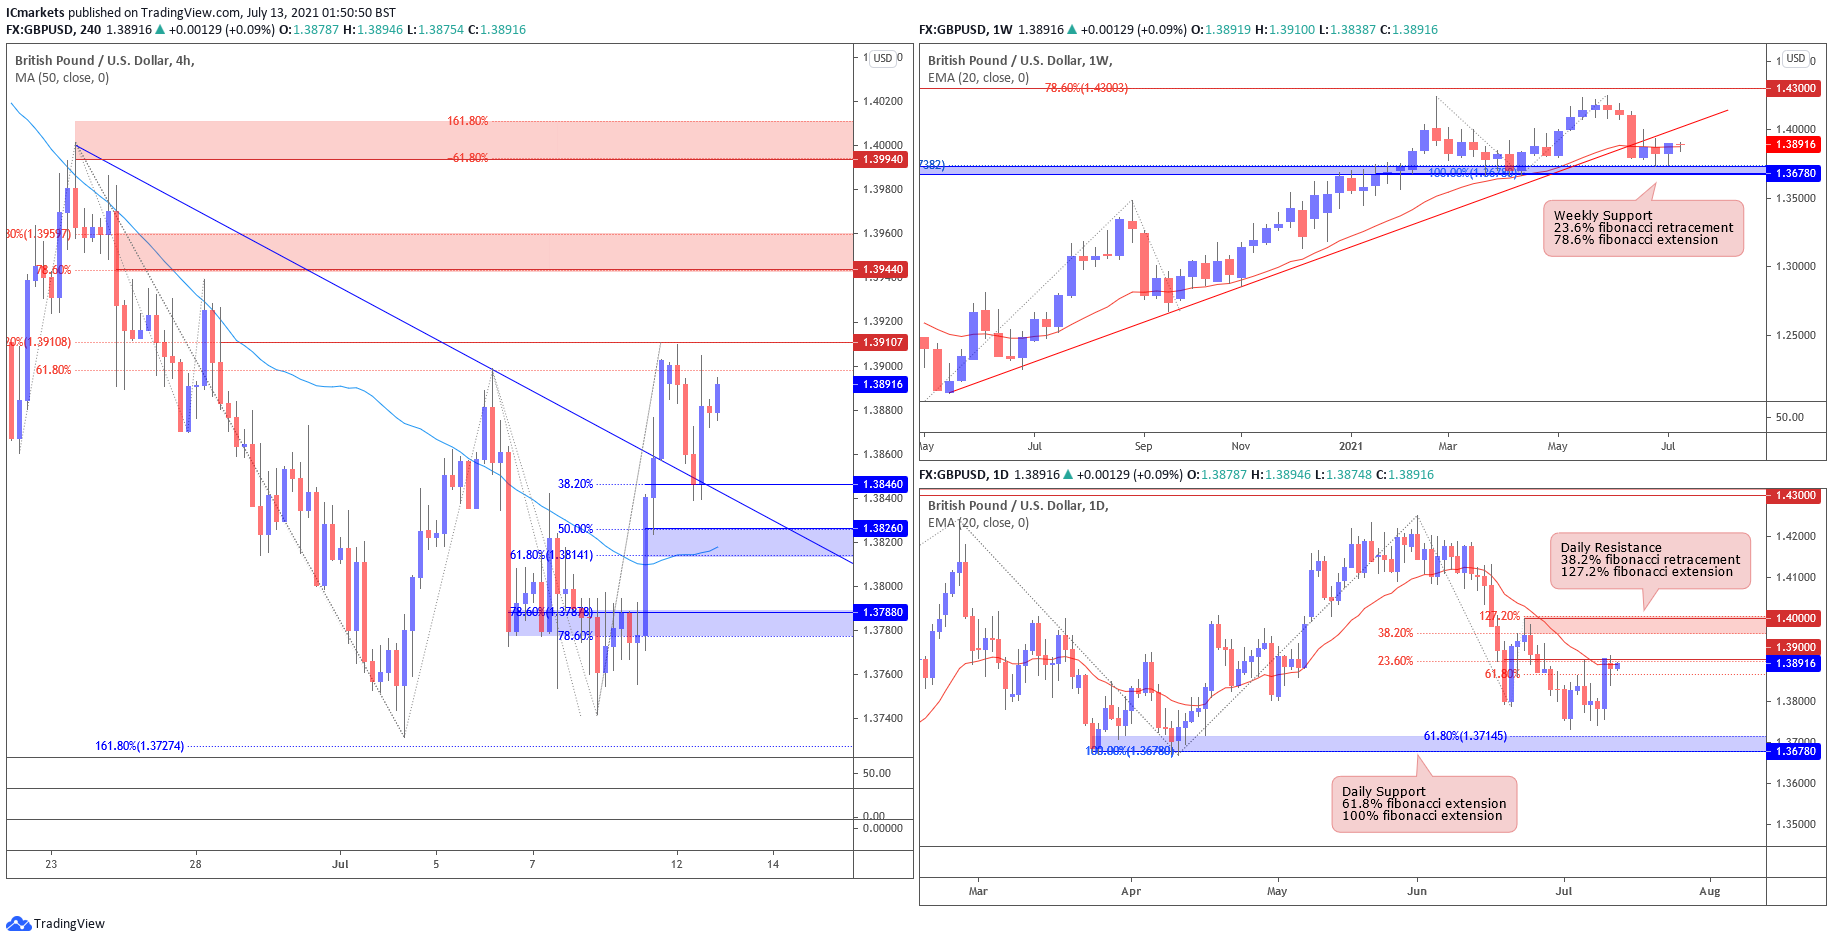
GBP/USD:
Looking at the weekly chart, we can see that the price bounced from our support level at 1.36780, in-line with 23.6% Fibonacci retracement and 78.6% Fibonacci extension. On the daily time frame, prices bounced to resistance level at 1.39027, in-line with 23.6% Fibonacci retracement, 61.8% Fibonacci extension and 20EMA. We could potentially see the price facing bearish pressure from this level. If the price is able to close above 20EMA, it will swing toward resistance at 1.40000, in-line with 38.2% Fibonacci retracement, 127.2% Fibonacci extension and psychological resistance.
On the H4 timeframe, prices dropped to retest support at 1.38460,in-line with 38.2% Fibonacci retracement and descending trendline resistance-turned-support.
If price can close above previous highs of 1.39107, it will swing towards our first resistance at 1.39440, in-line with 78.6% Fibonacci retracement and 161.8% Fibonacci extension. The next resistance is at 1.39940, in-line with -61.8% Fibonacci retracement, 161.8% Fibonacci extension and daily resistance.
If the price dropped from this level, it would swing toward first support at 1.38260, in-line with 50% Fibonacci retracement, 61.8% Fibonacci extension and 50MA. The next support level will be at 1.37880, in-line with 78.6% Fibonacci retracement, 78.6% Fibonacci extension.
Areas of consideration:
- H4 time frame, 38260 and 1.37880 support level
- H4 time frame, 1.39440 and 1.39940 resistance level
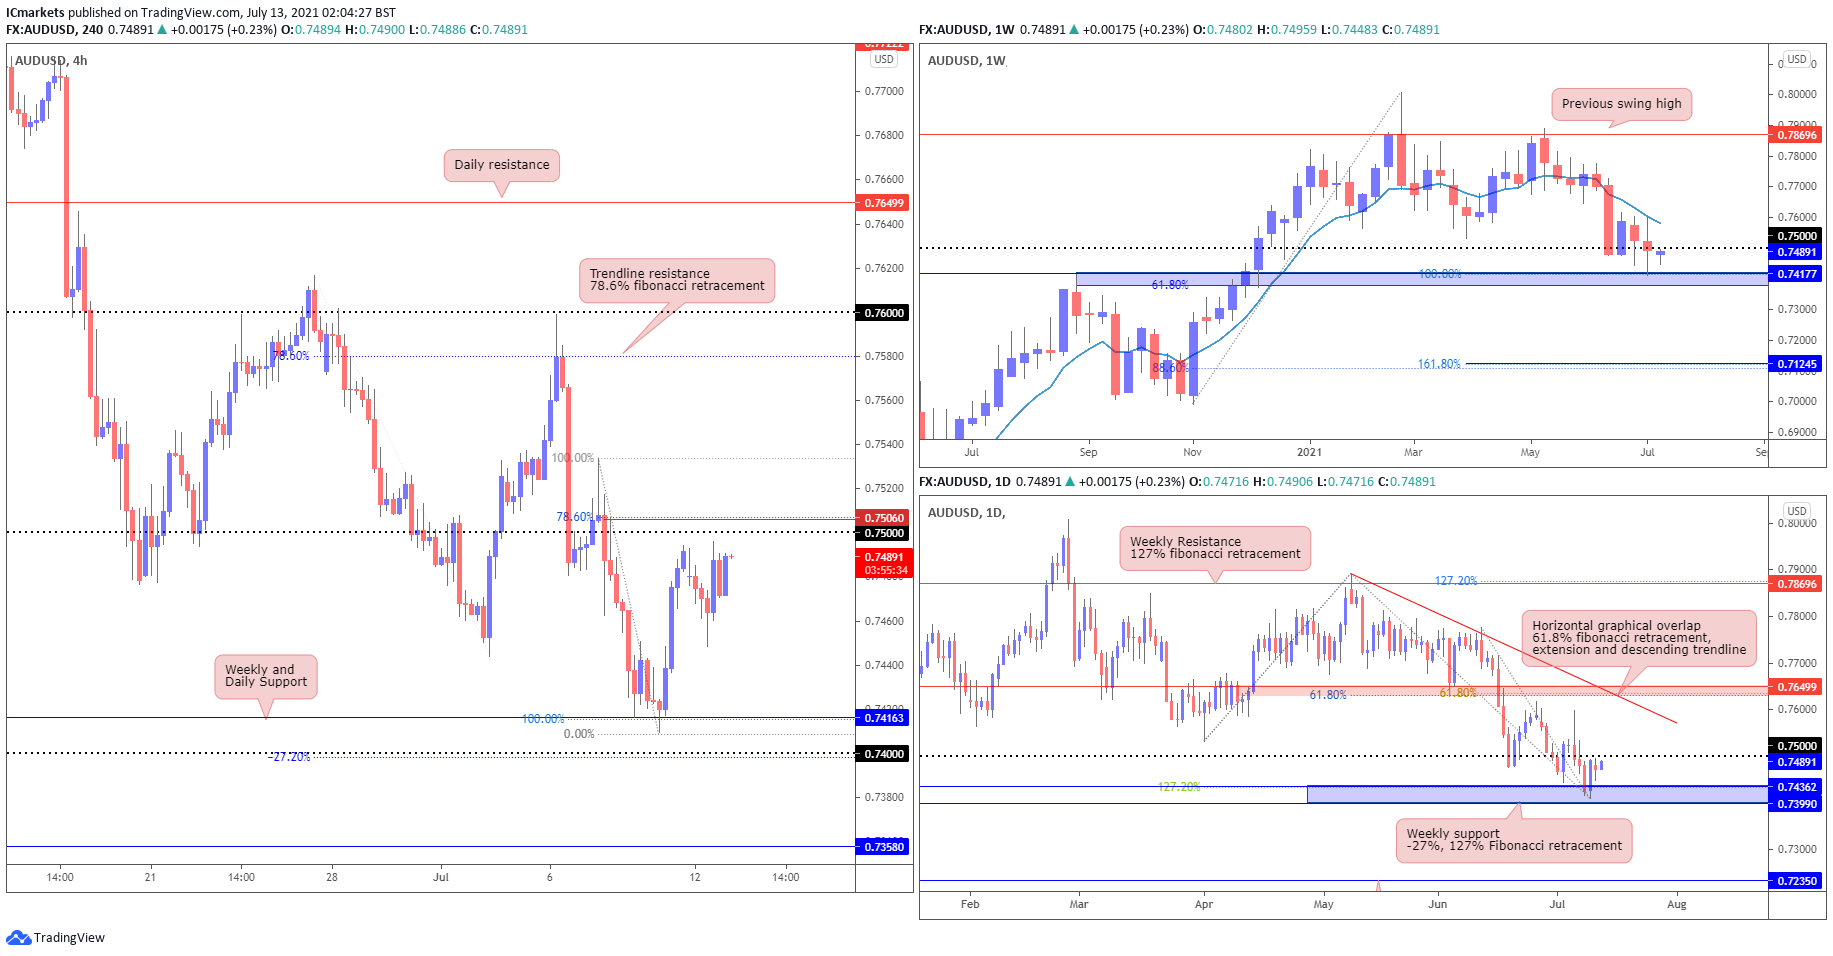
AUD/USD:
Looking at the weekly chart, we can see that the price is testing the support level of 0.74177, in line with 61.8% fibonacci retracement and 100% fibonacci extension. If price breaks beneath this level we may see a push down towards 0.71245. On the daily time frame, we are seeing a similar picture where price is trending in a bearish momentum under the descending trendline, and is testing the support level indicated on the weekly timeframe. If price rejects the area of support, we may see it push higher towards 0.76499 level, in line with Horizontal graphical overlap, 61.8% fibonacci retracement, extension and descending trendline.
Lastly, on the H4 timeframe, we saw price rejecting 0.74163 level, in line with Weekly and Daily support and 100% fibonacci extension. We may focus on the 0.750 major level, in line with 78.6% fibonacci retracement and horizontal graphical overlap for our next port of call, for the continuation of the bearish momentum.
Areas of consideration:
- H4 time frame, price approaching resistance at 0.75 major level
- Weekly and Daily time frame showing bearish momentum
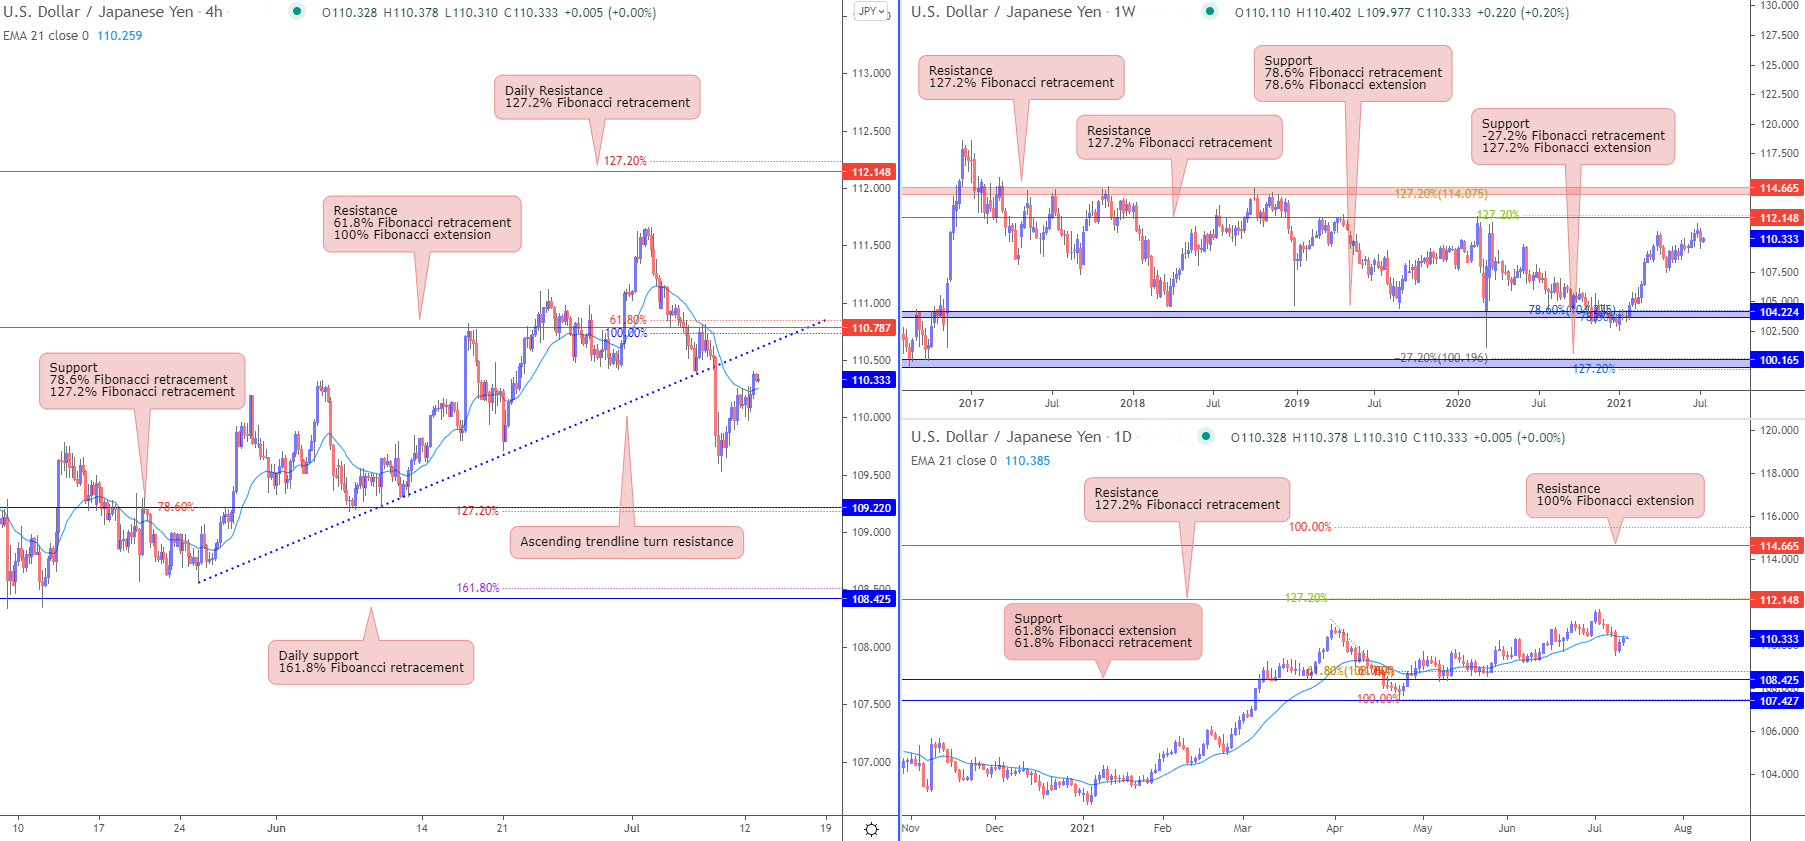
USD/JPY
From the weekly timeframe, prices are holding between the 112.148 resistance level in line with 127.2% Fibonacci retracement and the 104.224 level in line with 78.6% Fibonacci retracement and 78.6% Fibonacci extension. In the daily time frame, prices have broken the 21 period EMA. We could potentially see prices pushing down towards support level 108.425 which is in line with 61.8% Fibonacci extension and 61.8% Fibonacci retracement.
On the H4 timeframe, prices have broken the ascending trendline support and is pushing down towards short term support at 109.220 in line with 127.2% Fibonacci retracement and 78.6% Fibonacci retracement. Prices might pull back towards 110.787 level first to retest the ascending trendline support before it continues its bearish move down. A break above the 110.787 level could possibly see a push up towards 112.148 weekly resistance level. EMA is showing bearish pressure for prices.
Areas of consideration:
- 220 support level on the H4 timeframe
- 787 resistance level on the H4 timeframe
- 425 support level on the daily timeframe
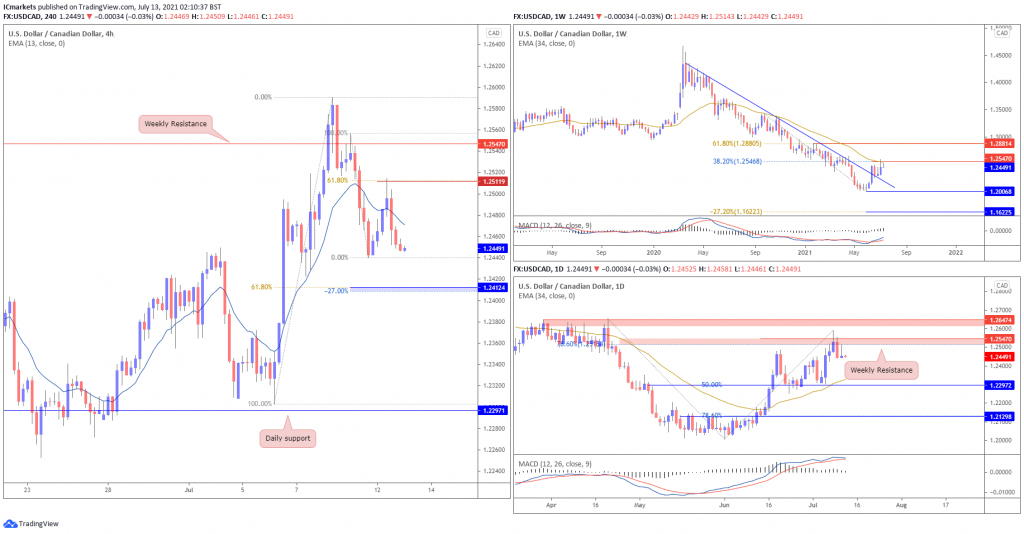
USD/CAD:
On the Weekly timeframe, price has broken the descending trendline resistance-turned-support and is currently testing the long term moving average and MACD indicator is below 0, showing bearish momentum. Price is currently holding between long term resistance at 1.25470 and long term support at 1.20068. On the Daily timeframe, we see that the indicators are showing a build up in bullish momentum. However, price has reversed from Weekly resistance level where it may push lower to test the next support level at 1.22972, in line with 50% fibonacci retracement. On the H4, we see price reversed from 1.25119, in line with 61.8% fibonacci retracement and is currently pushing towards 1.24124, in line with -27% and 61.8% fibonacci retracement.
Areas of consideration:
- H4 showing bearish momentum towards support at 1.24124
- 25119 is the resistance level to watch on H4
USD/CHF:
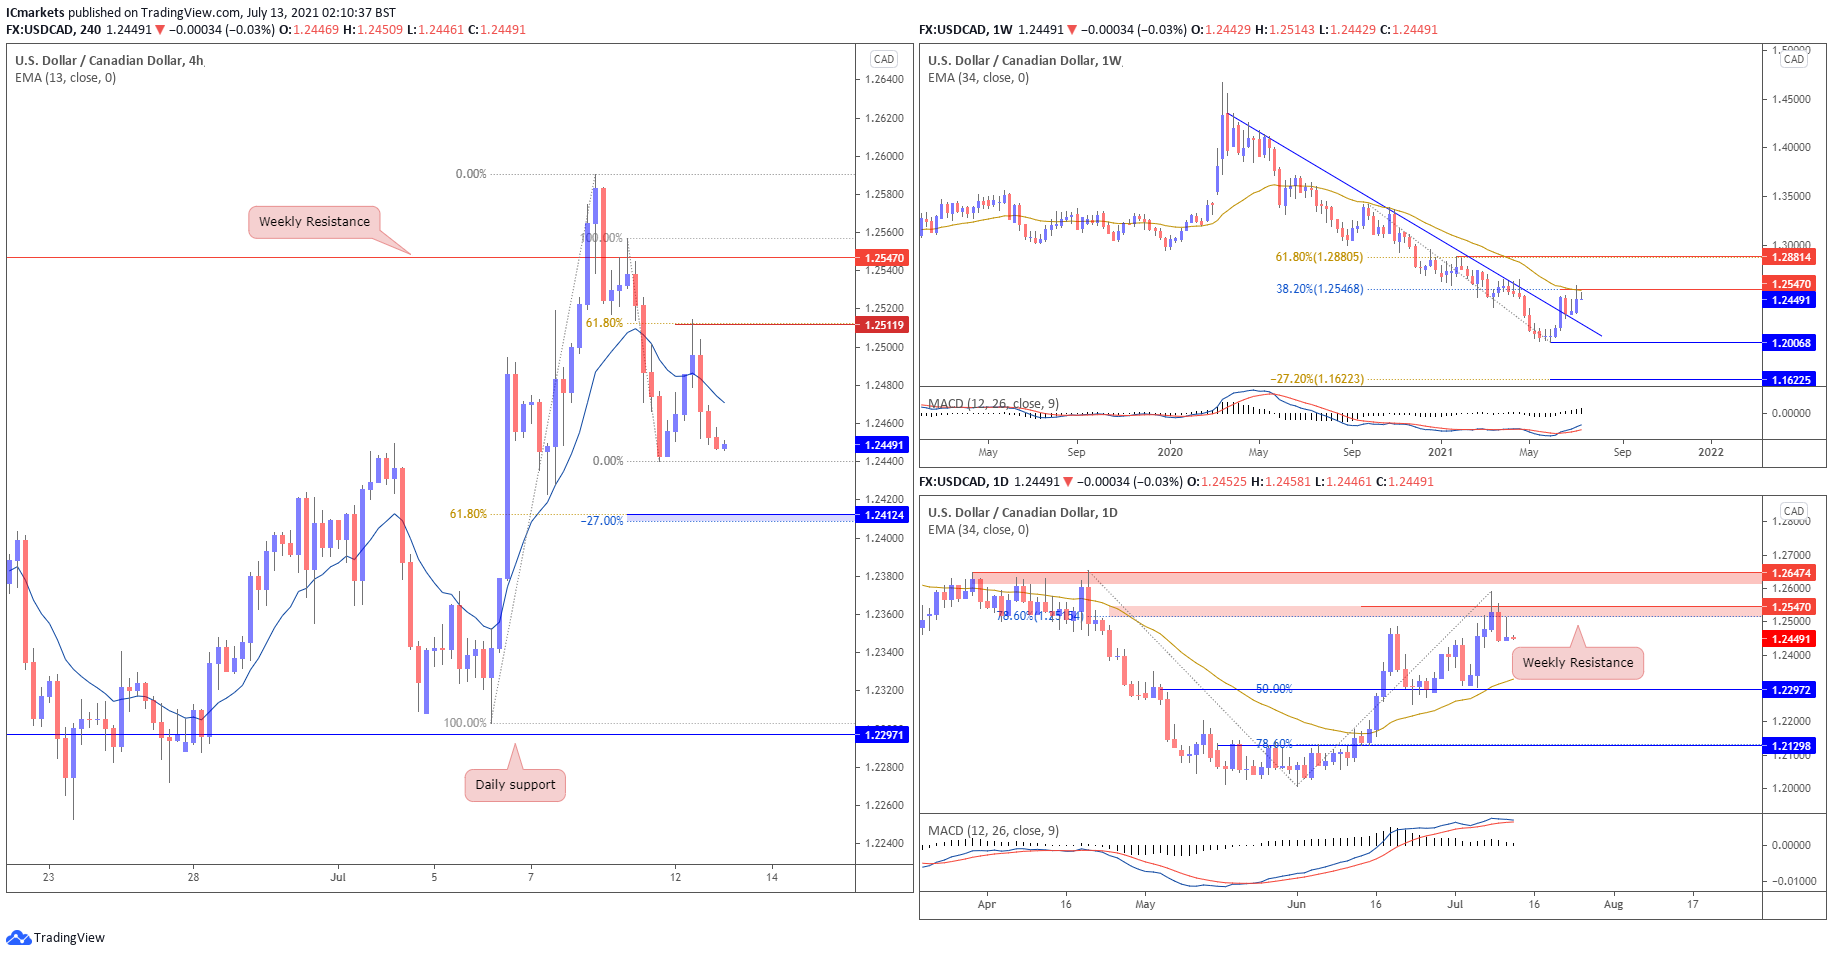
USD/CHF has shown a strong bounce from the weekly 0.89500 support, in line with 61.8% Fibonacci retracement and 78.6% Fibonacci extension, and price is now reversing below the descending trendline resistance. The daily chart shows that price is now reversing below the key daily 0.92300 support-turned-resistance and ascending trendline support-turned-resistance. We could potentially see further downside below the 0.92300 resistance.
On the H4 chart, we can see that price has reversed strongly from the 0.92300 resistance area, in line with 61.8% Fibonacci retracement level and 127.2% Fibonacci extension, and is now pushing lower. We note that price is also holding below the moving average resistance, showing possible bearish pressure in line with our bearish bias. In this scenario, we could see price drop further towards 0.90500 support, in line with 61.8% Fibonacci retracement and horizontal pullback resistance. Otherwise, price could also pull back to retest the 0.92300 resistance as well.
Areas of consideration:
- Price could potentially face further bearish pressure.
- We could see price drop further towards the next 0.90500 support level.
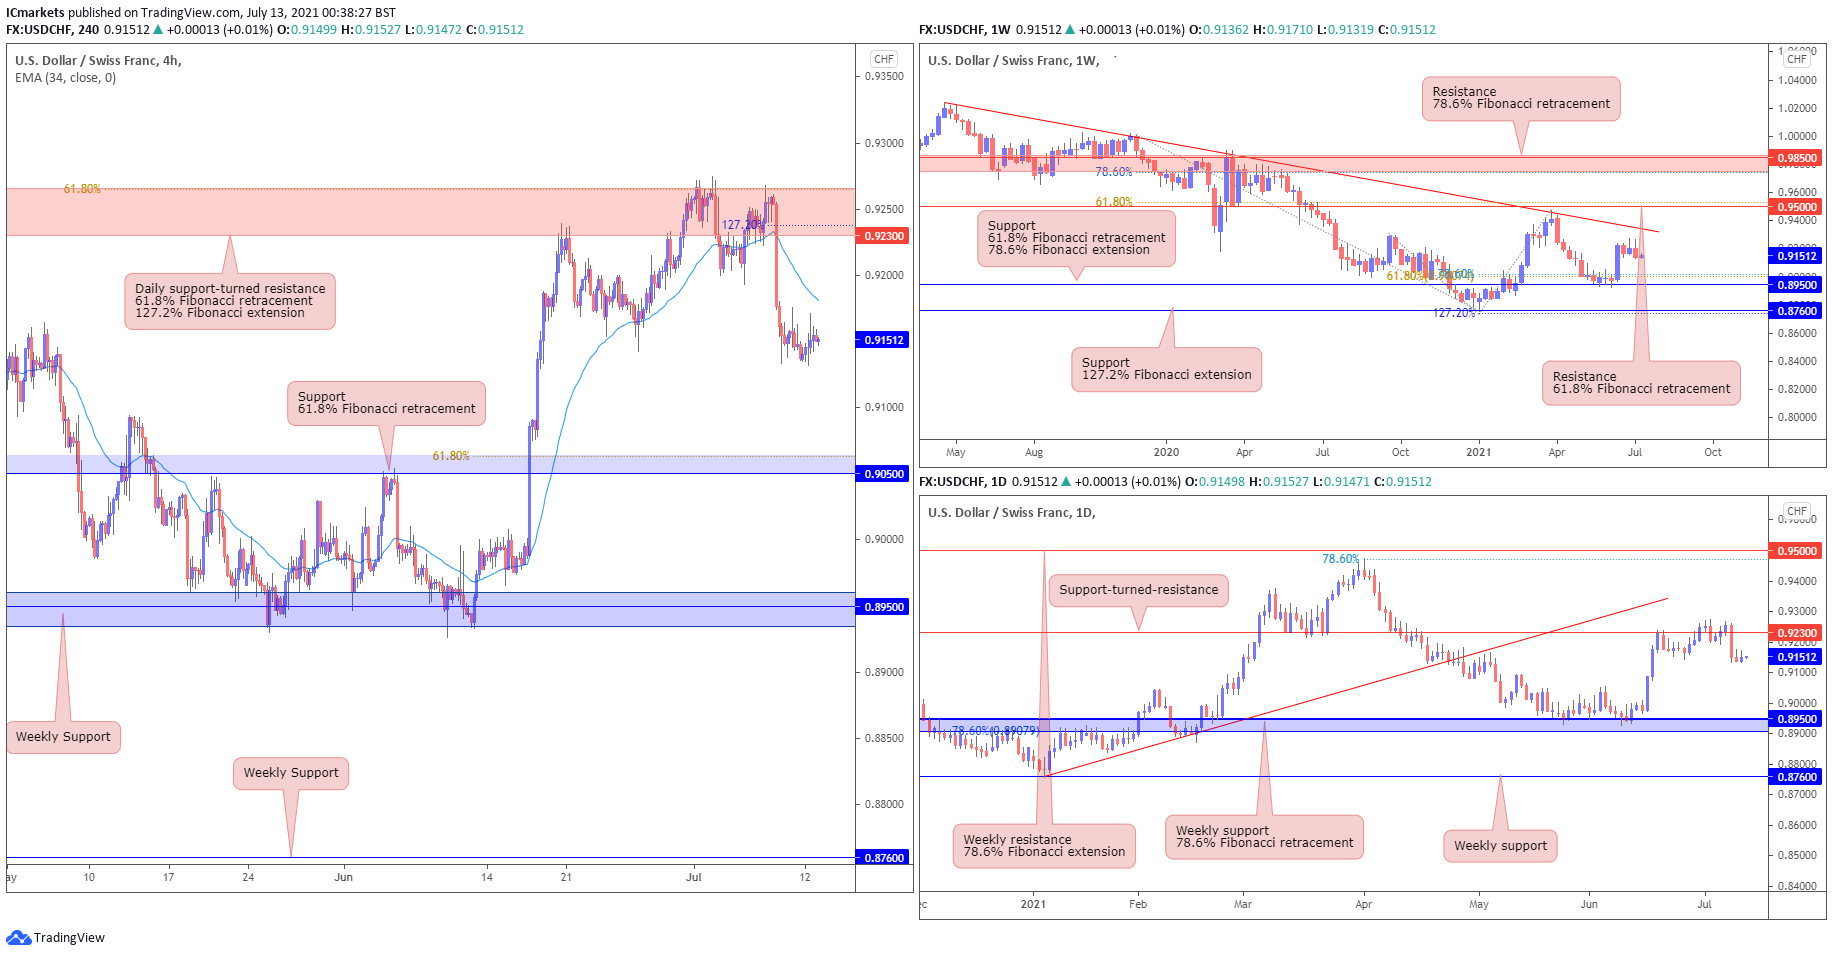
Dow Jones Industrial Average:
On the weekly chart, prices bounced higher above 32765 support. With price holding 32765 support, we might see bullish pressure above this level. On the daily chart, price is currently trading sideways and holding below resistance at 35090. With stochastic still testing resistance where price dropped in the past, we see price facing possible bearish pressure.
On the H4, price pushed higher and is now testing 35090 daily resistance. Stochastic is still testing resistance where price dropped in the past, we maintain a view with low probability that sellers might add to their shorts to push price lower towards 34358 support. Otherwise failure to hold below 35090 resistance should see price swing the other way towards 35485 resistance instead.
Areas of consideration:
- 35090 daily resistance is key level to watch
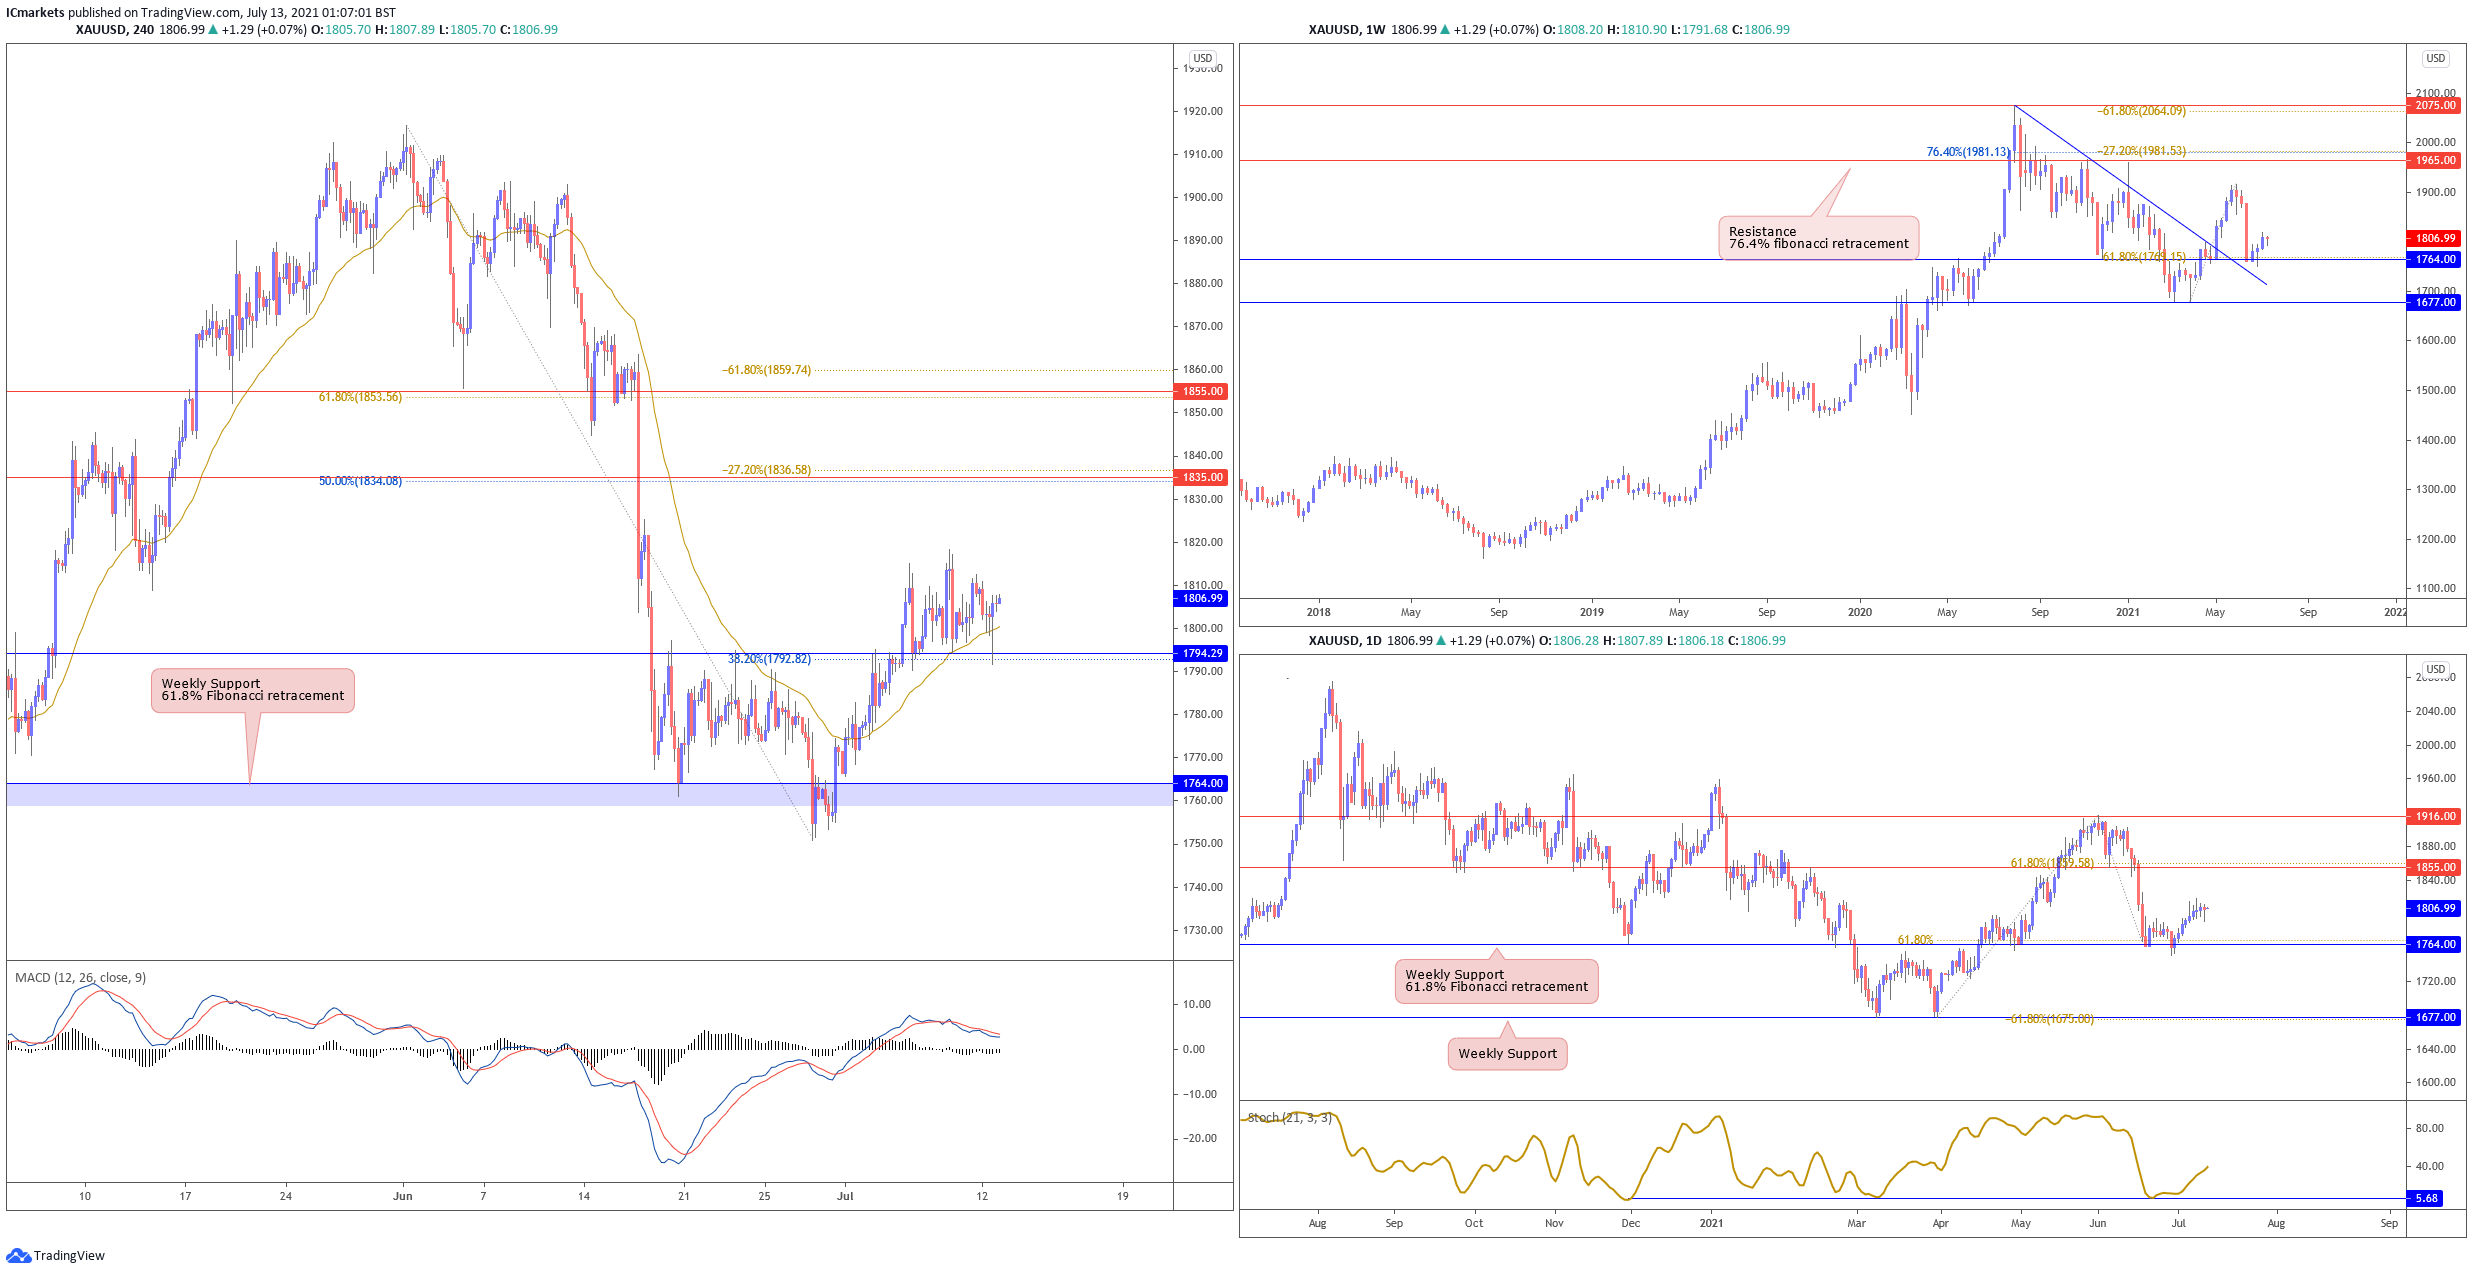
XAU/USD (GOLD):
On the weekly timeframe, price tested and bounced above key trendline pullback support at 1764. On the daily, price continues to push higher, above 1764 weekly support. Further bullish pressure above 1764 weekly support could be possible with an upside target at 1855 resistance.
On the H4, price is trading within a tight range but continued to edge higher. With technical indicators showing room for further bullish momentum, a further push up above 1794 support with an upside target at 1835 could be likely. Otherwise, failure to hold above will see price swing the other way towards weekly support at 1764 instead.
Areas of consideration:
- 1764 weekly support is the key level to watch.
The accuracy, completeness and timeliness of the information contained on this site cannot be guaranteed. IC Markets does not warranty, guarantee or make any representations, or assume any liability regarding financial results based on the use of the information in the site.
News, views, opinions, recommendations and other information obtained from sources outside of www.icmarkets.com.au, used in this site are believed to be reliable, but we cannot guarantee their accuracy or completeness. All such information is subject to change at any time without notice. IC Markets assumes no responsibility for the content of any linked site.
The fact that such links may exist does not indicate approval or endorsement of any material contained on any linked site. IC Markets is not liable for any harm caused by the transmission, through accessing the services or information on this site, of a computer virus, or other computer code or programming device that might be used to access, delete, damage, disable, disrupt or otherwise impede in any manner, the operation of the site or of any user’s software, hardware, data or property.


