
DXY:
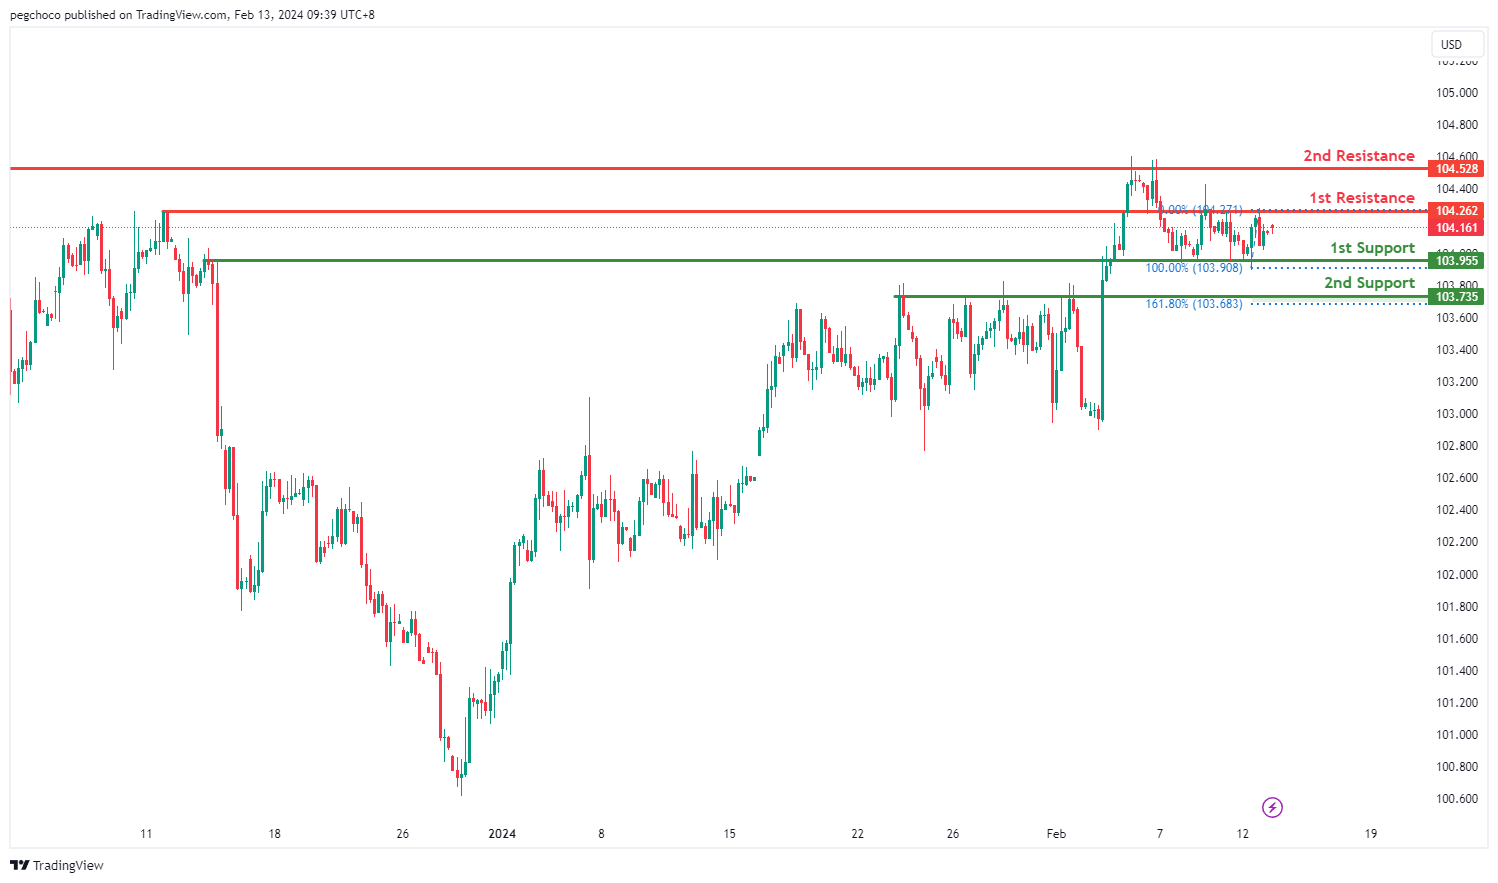
The DXY chart currently reflects a neutral momentum, suggesting a lack of clear direction in the market. There’s a possibility of price fluctuating between the 1st resistance and 1st support levels.
The 1st support level at 103.95 is identified as an overlap support, indicating its historical significance as a level where buying interest has emerged.
Similarly, the 2nd support at 103.73 is characterized as a pullback support, further reinforcing its potential role as a level where buyers may step in.
On the resistance side, the 1st resistance level at 104.26 is categorized as an overlap resistance, suggesting its historical significance as a level where selling pressure has been observed.
Likewise, the 2nd resistance at 104.52 is identified as another overlap resistance, adding to its importance as a potential barrier for further upside movement.
EUR/USD:
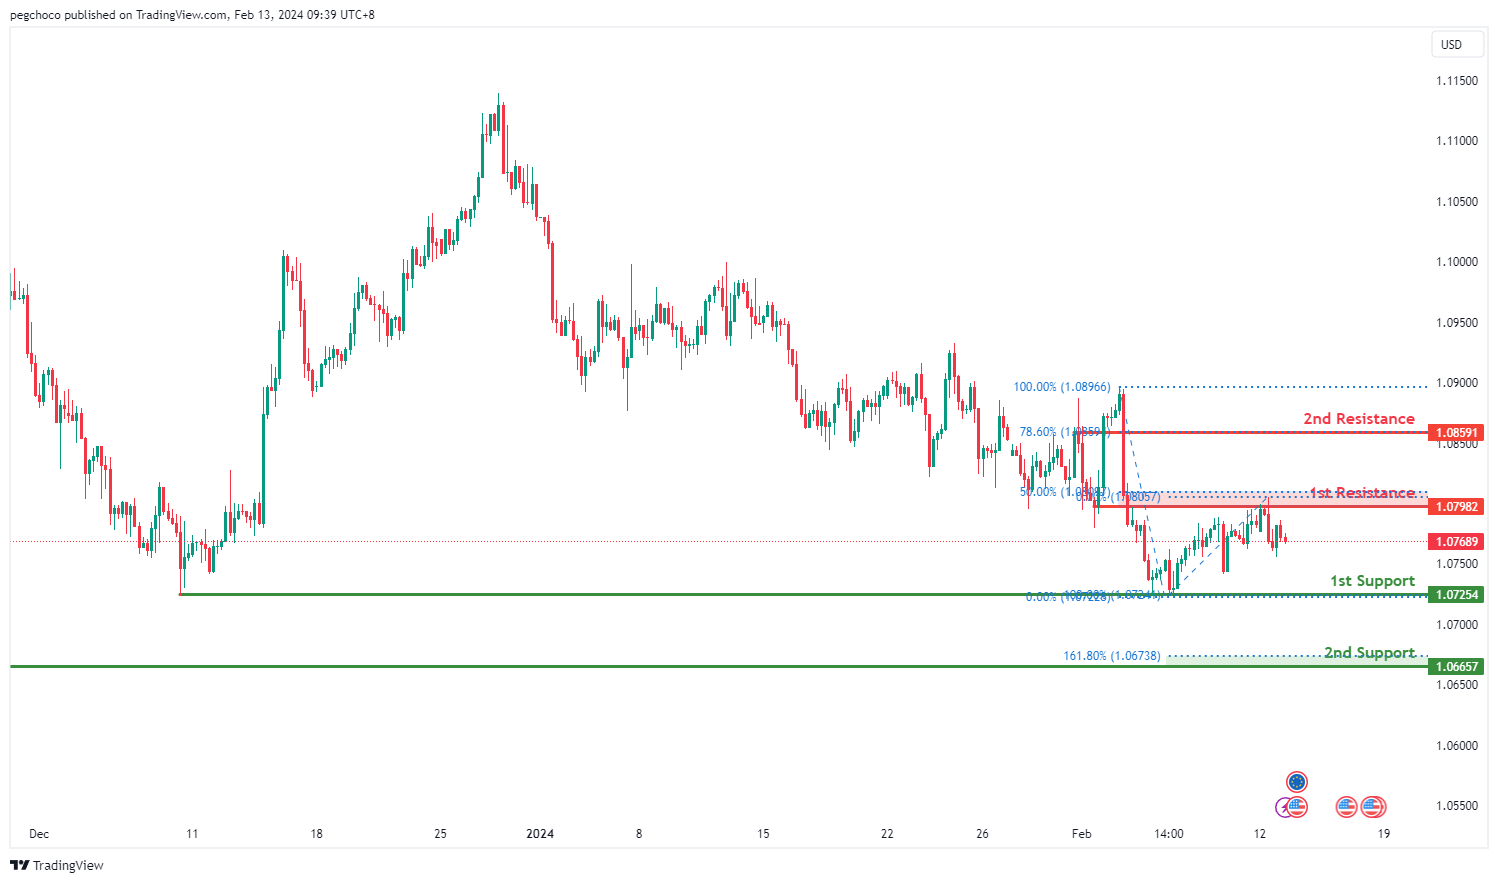
The EUR/USD chart currently exhibits a bearish overall momentum, indicating a downward trend. There’s a possibility that the price could continue this bearish movement towards the 1st support level.
The 1st support level at 1.0725 is considered a multi-swing low support, suggesting its historical significance as a strong level where buying interest has previously emerged.
Additionally, the 2nd support at 1.0665 is identified as an overlap support, further reinforcing its potential role as a significant level of support. The presence of the 161.80% Fibonacci Extension adds to its strength as a potential support zone.
On the resistance side, the 1st resistance level at 1.0798 is categorized as an overlap resistance, indicating its historical significance as a point of potential resistance where selling pressure has been observed.
Similarly, the 2nd resistance at 1.0859 is identified as a pullback resistance, with the presence of the 78.60% Fibonacci Retracement, further emphasizing its importance as a potential barrier for further upside movement.
EUR/JPY:
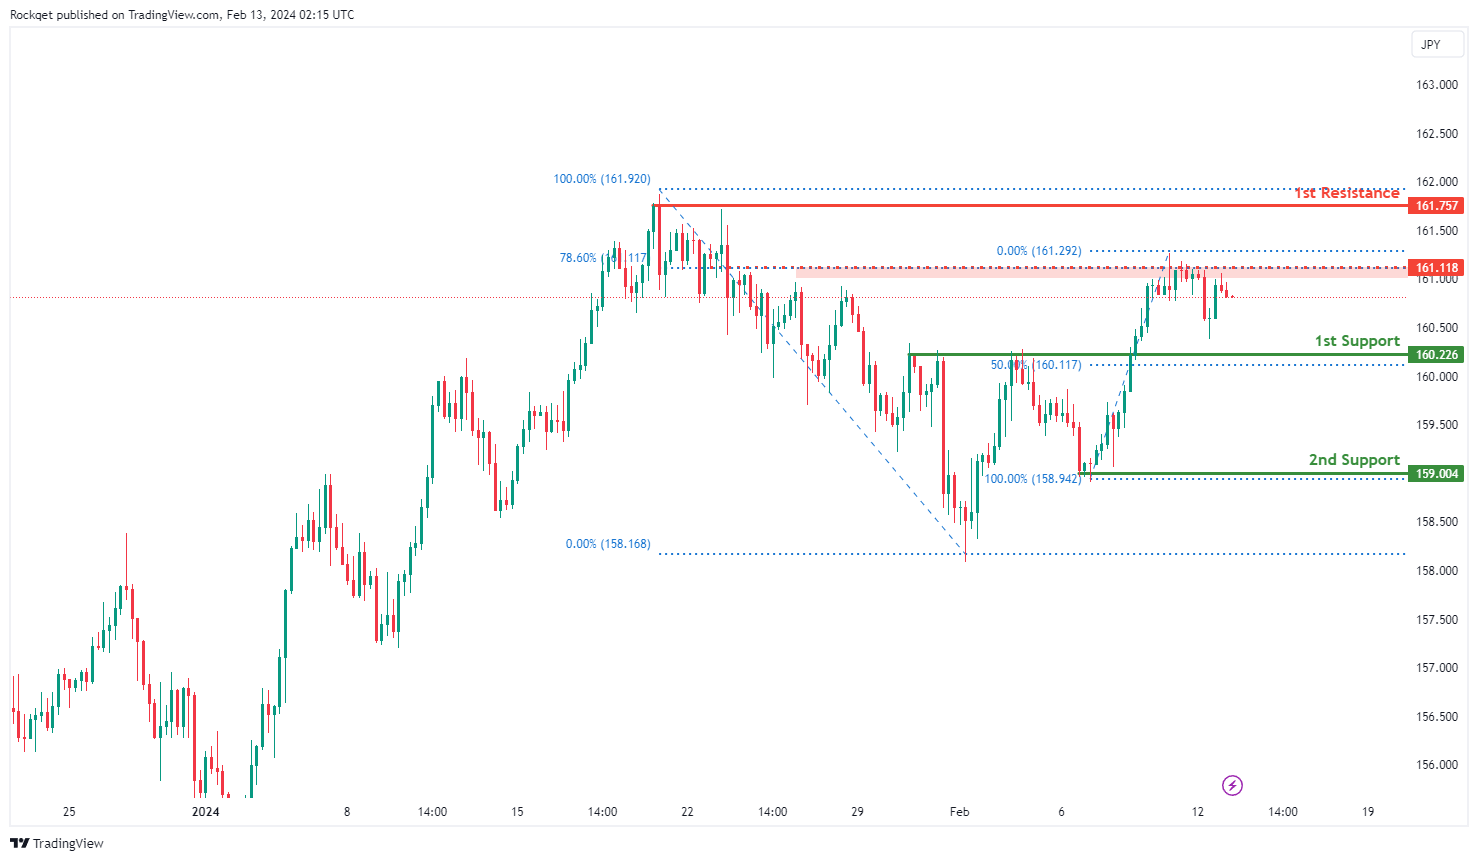
The EUR/JPY chart currently demonstrates a bearish momentum, indicating a prevailing downward trend. Several factors contribute to this bearish sentiment, supporting the potential for a continued downward movement in the price.
The 1st support level at 160.226 is significant as it represents a pullback support, suggesting a historical level where buying interest has previously emerged. Additionally, this level aligns with the 50% Fibonacci Retracement, adding to its significance. Furthermore, the 2nd support at 159.004 is identified as a swing low support, providing additional reinforcement to the potential support zone.
On the resistance side, the 1st resistance at 161.757 is highlighted as a significant level where selling pressure may intensify, as it coincides with a swing high resistance. Moreover, the intermediate resistance at 161.118 is recognized, aligning with an overlap resistance and the 78.60% Fibonacci Projection, further reinforcing its potential as a barrier to further upward movement.
EUR/GBP:
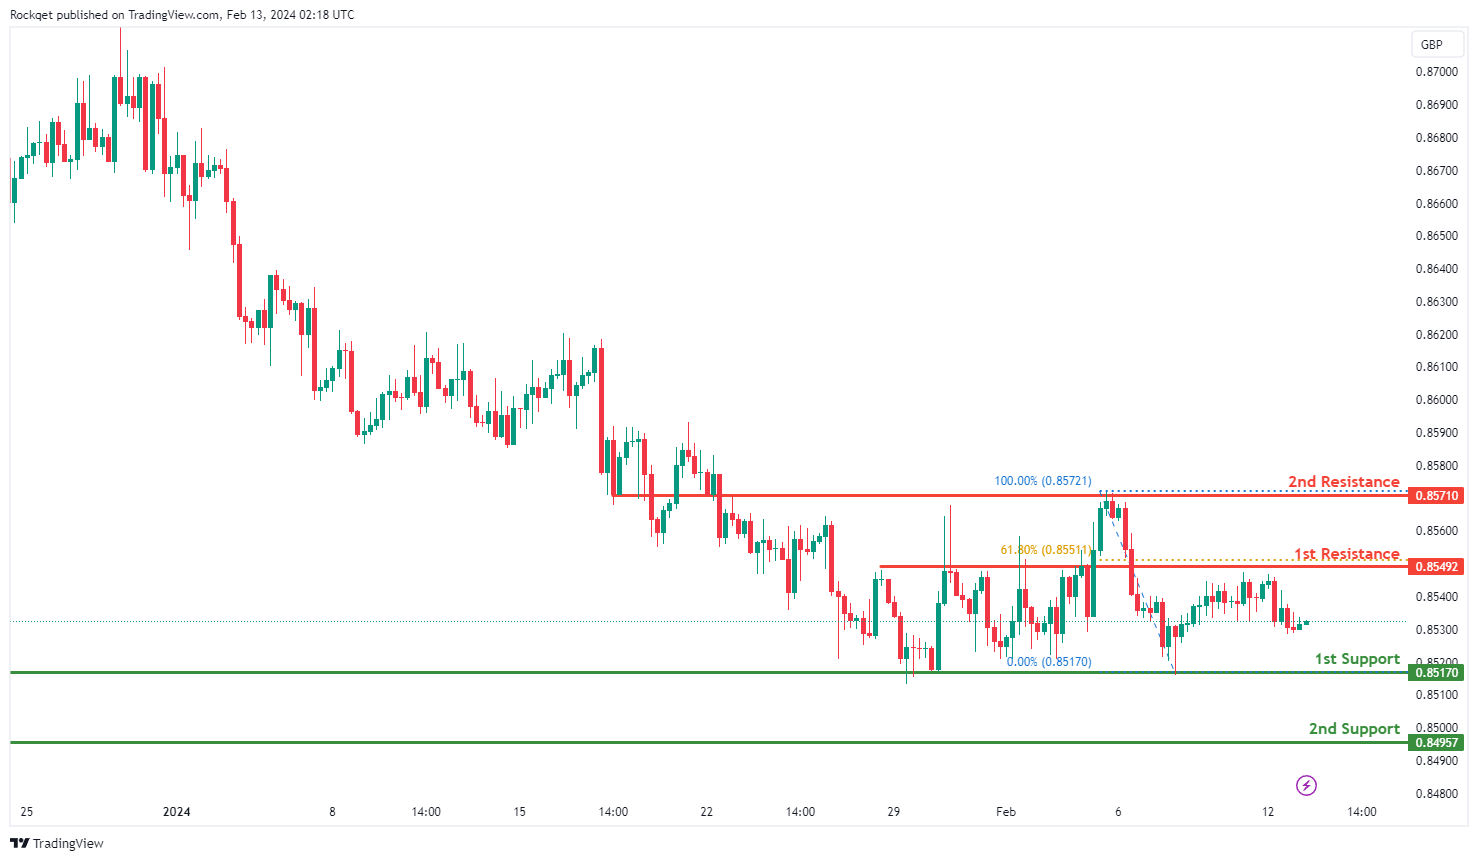
The EUR/GBP chart currently exhibits a neutral momentum, indicating a lack of clear direction in the market. Given this neutrality, the price could potentially fluctuate between the 1st resistance and 1st support levels, with no strong bias towards either direction.
The 1st support level at 0.85170 is considered significant as it represents a multi-swing low support, suggesting a historical level where buying interest has previously emerged. Additionally, the 2nd support at 0.84957 is identified as an overlap support, further strengthening the potential support zone.
On the resistance side, the 1st resistance at 0.85492 is highlighted as a significant level where selling pressure may intensify, as it coincides with a pullback resistance and the 61.80% Fibonacci Retracement. Moreover, the 2nd resistance at 0.85710 is recognized as an overlap resistance, adding to its significance as a barrier to further upward movement.
GBP/USD:
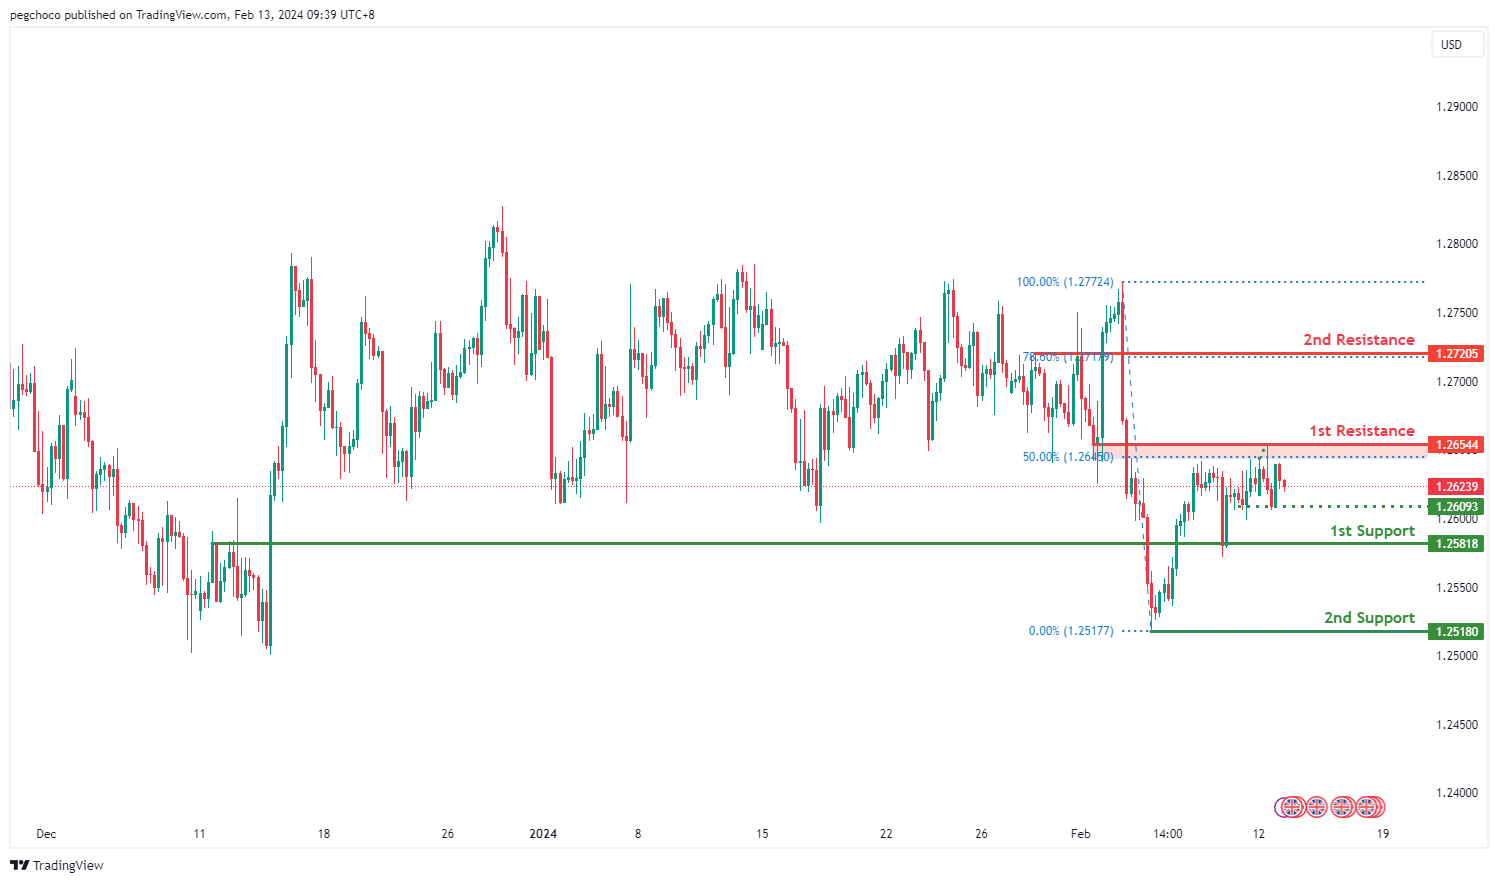
The GBP/USD chart currently demonstrates a bearish overall momentum, suggesting a downward trend. There’s a potential for further bearish movement towards the 1st support level.
The 1st support at 1.2581 is identified as an overlap support, indicating its historical significance as a level where buying interest has previously emerged. Additionally, the 2nd support at 1.2518 is characterized as a swing low support, further reinforcing its potential as a significant level of support.
On the resistance side, the 1st resistance level at 1.2564 is categorized as an overlap resistance, suggesting its historical significance as a point of potential resistance. Furthermore, the 2nd resistance at 1.2720 is identified as a pullback resistance, with the presence of the 78.60% Fibonacci Retracement, highlighting its importance as a potential barrier for further upside movement.
An intermediate support level at 1.2609 is also noted, considered a multi-swing low support, indicating another potential area where buying interest may emerge amidst the bearish momentum.
GBP/JPY:
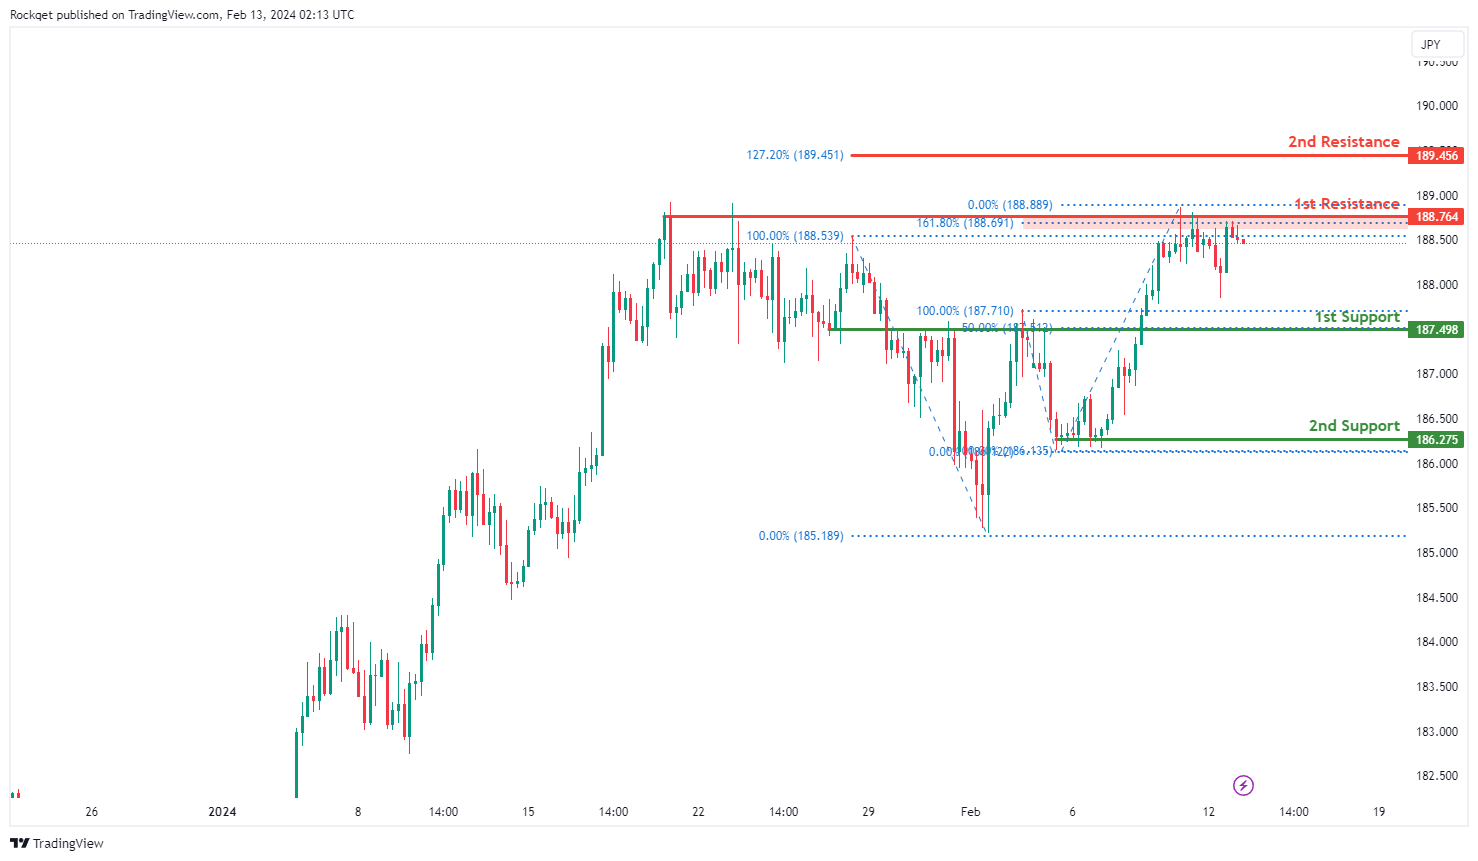
The GBP/JPY chart currently exhibits a bearish momentum, indicating a prevailing downward trend in the market. Given this bearish sentiment, the price could potentially continue its downward movement towards the 1st support level.
The 1st support at 187.498 is considered significant as it represents a pullback support, coinciding with the 50% Fibonacci Retracement level. This suggests a historical level where buying interest has previously emerged. Additionally, the 2nd support at 186.275 is identified as a multi-swing low support, further reinforcing the potential for a bounce at this level.
On the resistance side, the 1st resistance at 188.764 is highlighted as a significant barrier where selling pressure may intensify. This level aligns with a multi-swing high resistance and the 161.80% Fibonacci Extension, adding to its significance. Moreover, the 2nd resistance at 189.456 is recognized, coinciding with the 127.20% Fibonacci Extension, further strengthening its role as a resistance level.
USD/CHF:
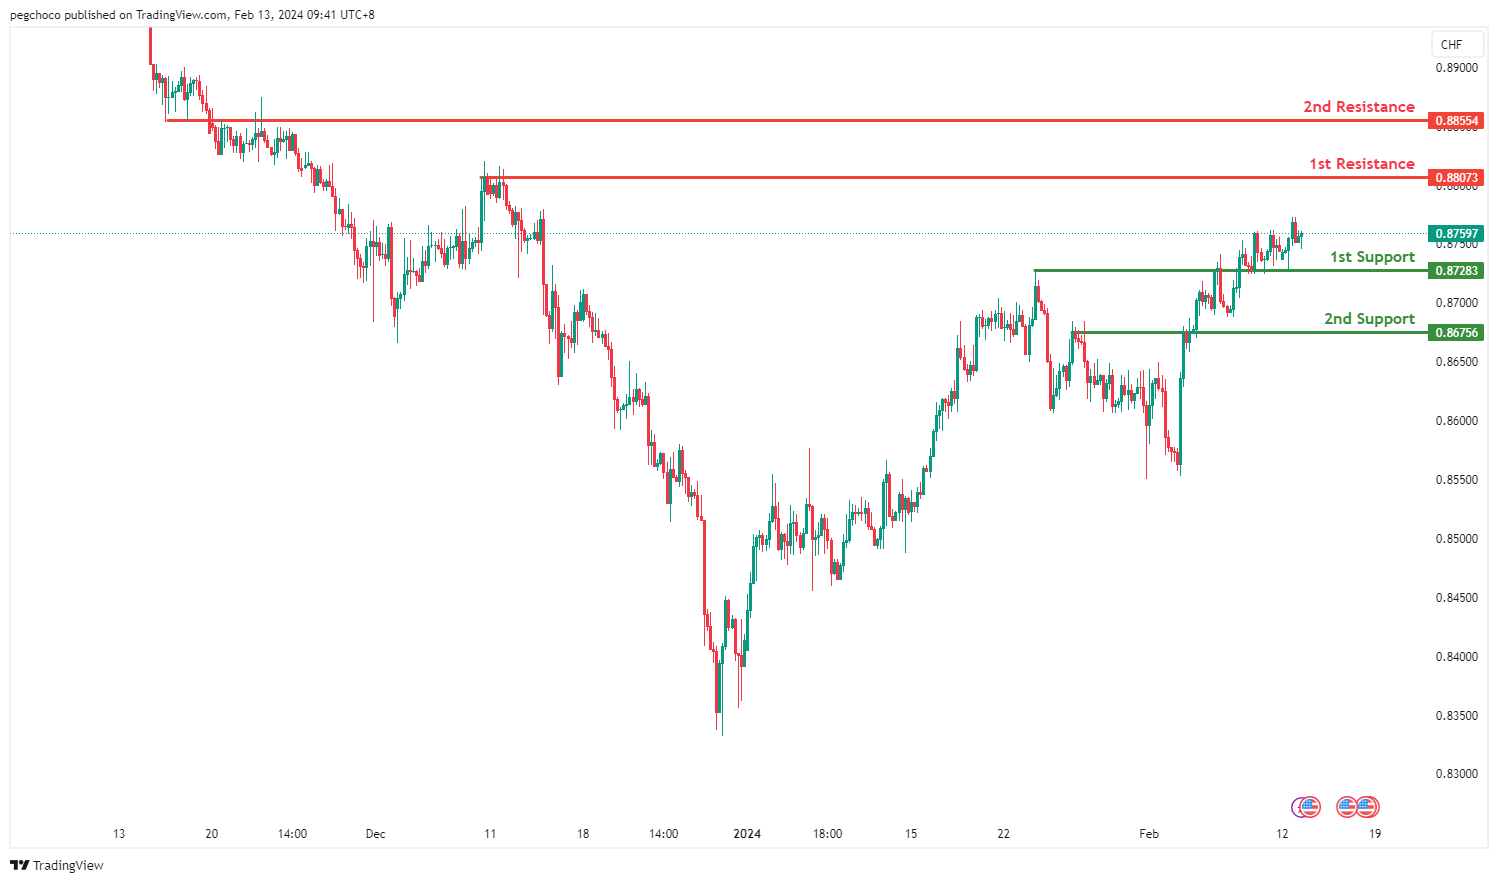
The USD/CHF chart currently displays a bullish overall momentum, indicating an upward trend. There’s a potential for further bullish movement towards the 1st resistance level.
The 1st support at 0.8728 is identified as an overlap support, suggesting its historical significance as a level where buying interest has previously emerged.
Additionally, the 2nd support at 0.8675 is characterized as a pullback support, further reinforcing its potential as a significant level of support.
On the resistance side, the 1st resistance level at 0.8807 is categorized as a multi-swing high resistance, indicating its historical significance as a point of potential resistance.
Furthermore, the 2nd resistance at 0.8855 is identified as an overlap resistance, which adds to its importance as a potential barrier for further upside movement.
USD/JPY:
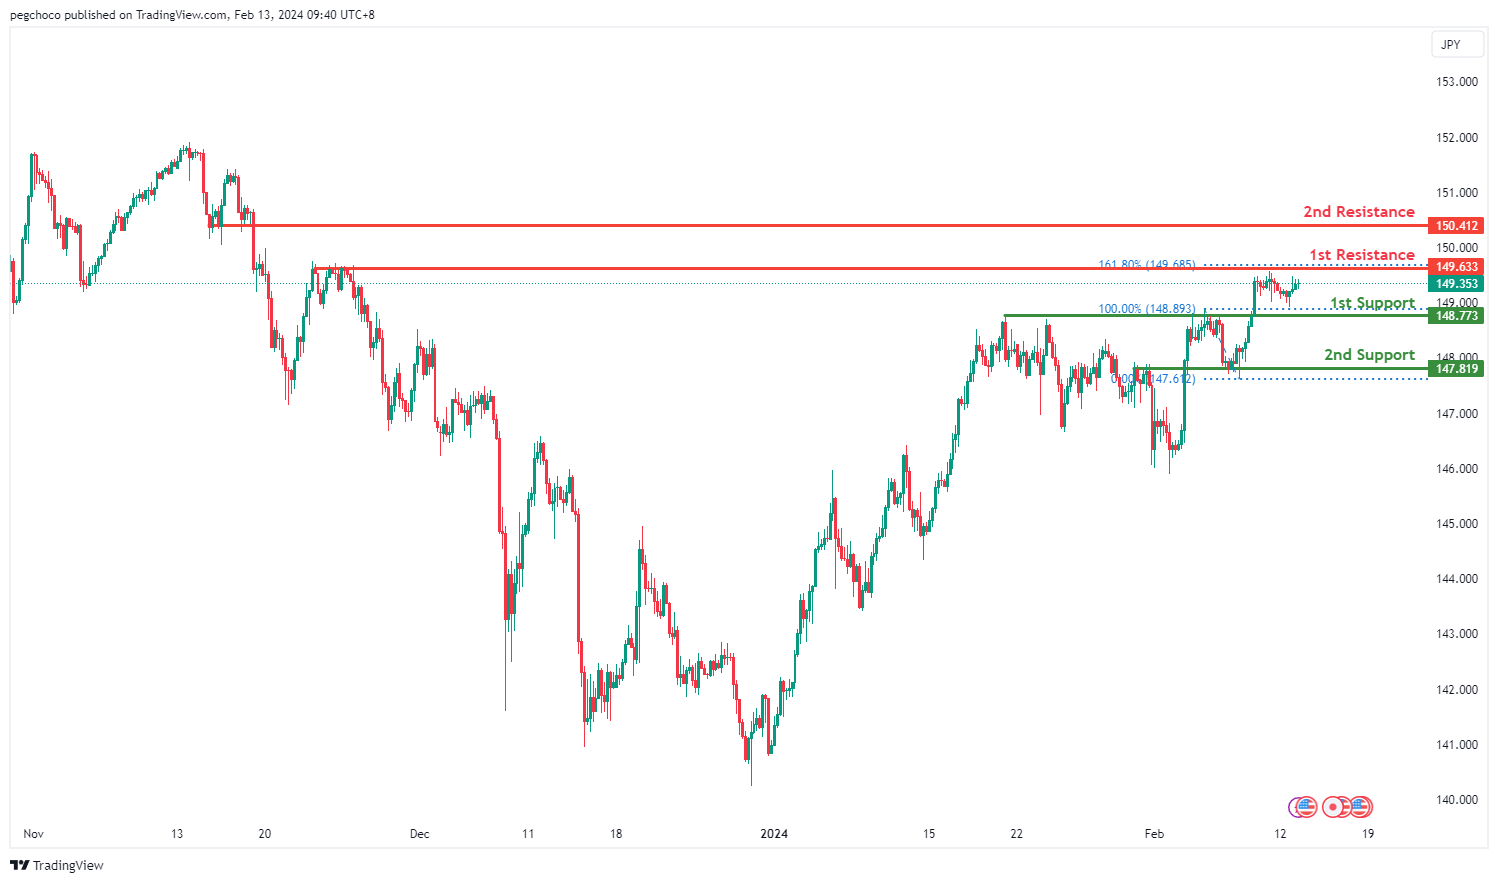
The USD/JPY chart currently exhibits a neutral overall momentum, indicating a lack of clear directional bias. There’s a possibility for price to oscillate between the 1st resistance and 1st support levels.
The 1st support at 148.77 is identified as an overlap support, suggesting its historical significance as a level where buying interest has previously emerged.
Additionally, the 2nd support at 147.81 is also characterized as an overlap support, reinforcing its importance as a potential level of support.
On the resistance side, the 1st resistance level at 149.63 is categorized as a multi-swing high resistance, indicating its historical significance as a point of potential resistance.
Furthermore, the 2nd resistance at 150.41 is identified as a pullback resistance, which adds to its significance as a potential barrier for further upside movement.
USD/CAD:
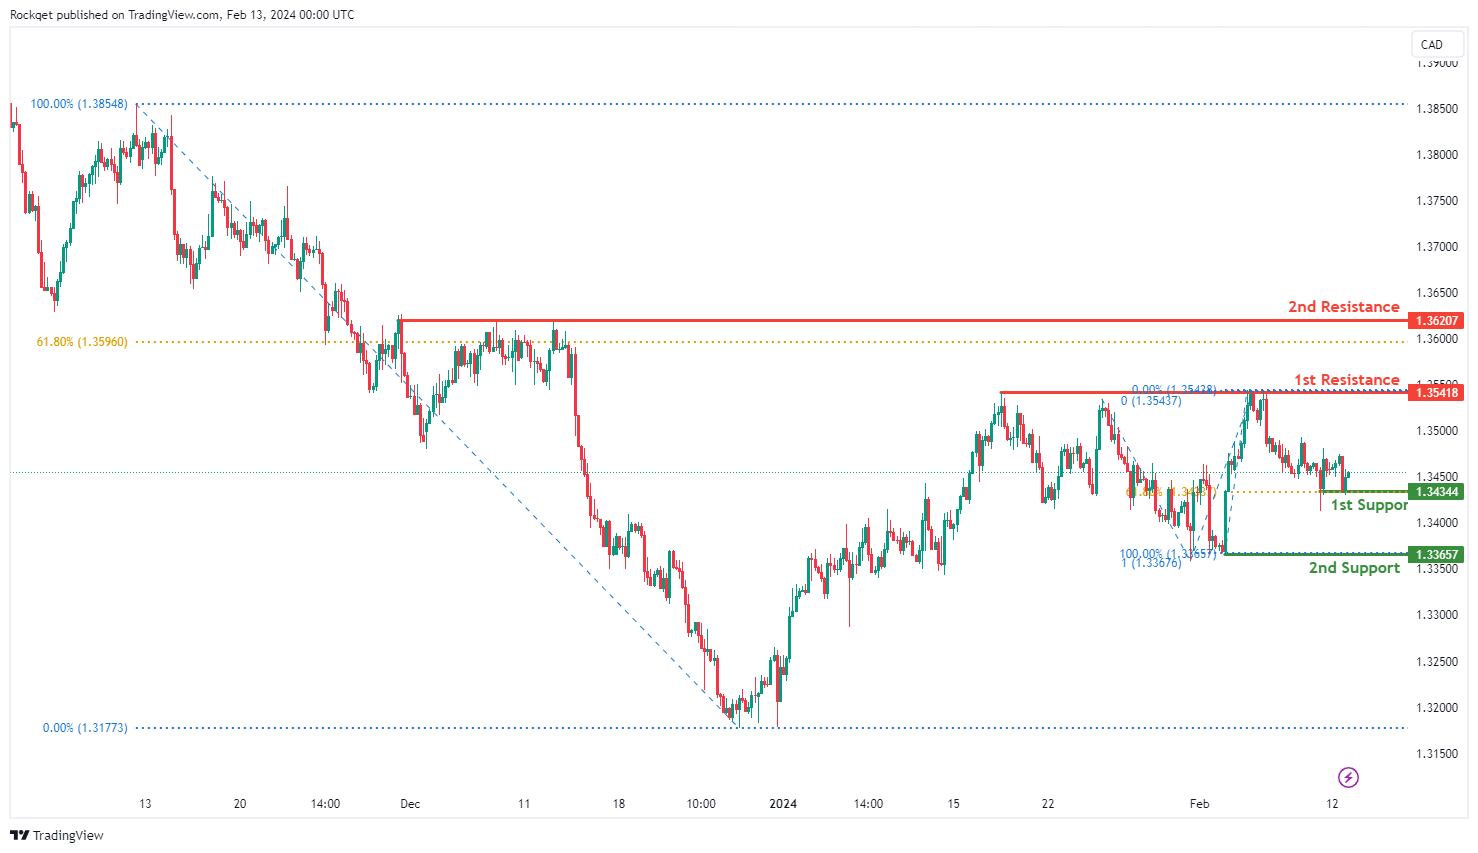
The USD/CAD chart currently exhibits a neutral bias. In this context, there is a potential scenario for price to fluctuate between the 1st support and the 1st resistance.
The 1st support level at 1.3434 is identified as a pullback support that aligns with the 61.80% Fibonacci Retracement level. Further below, the 2nd support level at 1.3365 is marked as a swing-low support that aligns with the 100.00% Fibonacci projection level, further emphasizing its importance as a potential support zone.
To the upside, the 1st resistance level at 1.3541 is identified as a pullback resistance. Higher up, the 2nd resistance level at 1.3620 is also noted as a pullback resistance that aligns close to the 61.80% Fibonacci Retracement level, further highlighting its importance as a potential resistance point.
AUD/USD:
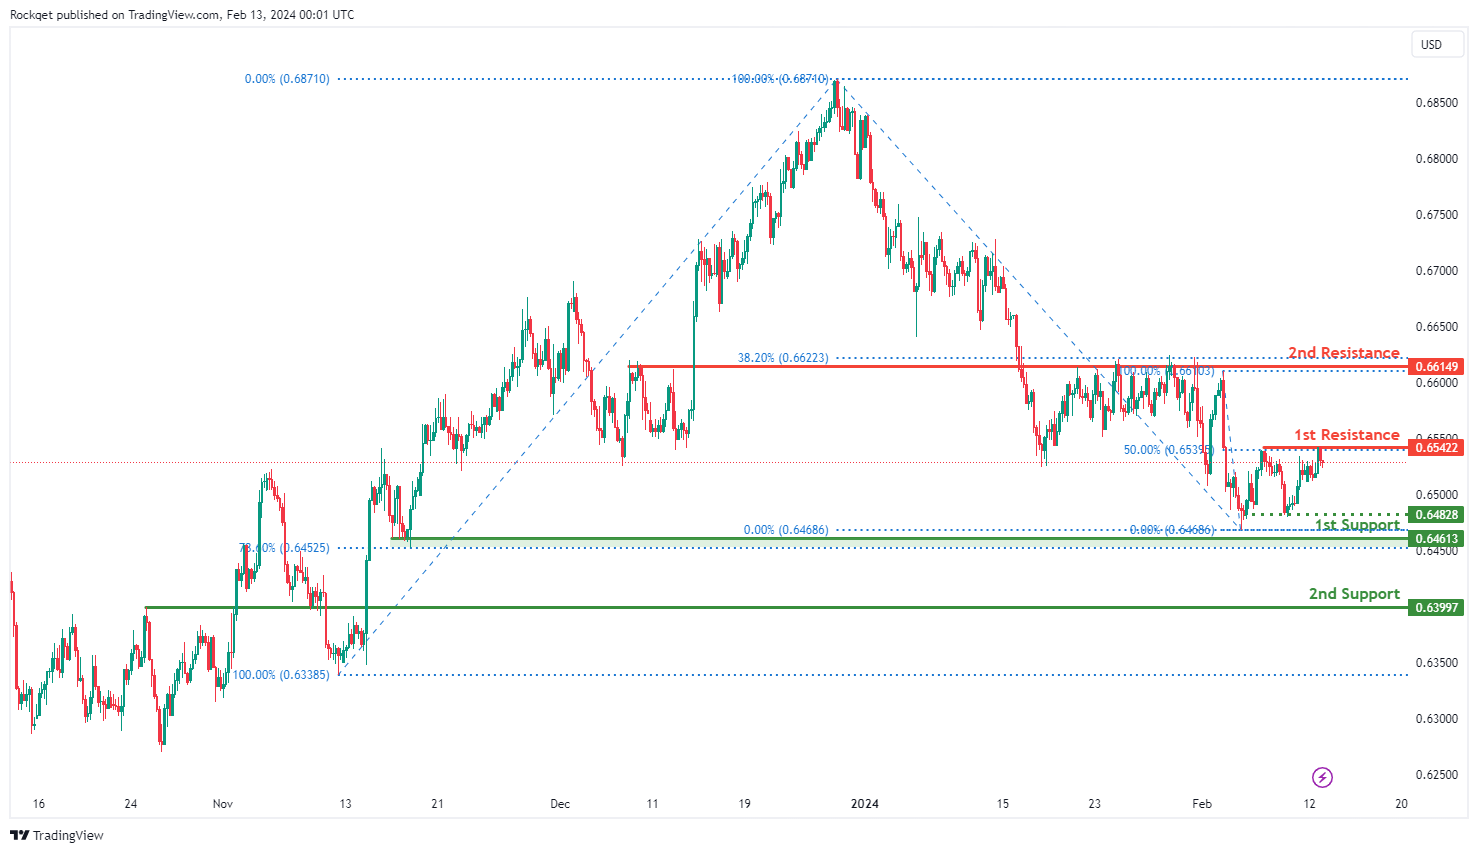
The AUD/USD chart currently exhibits a neutral bias. In this context, there is a potential scenario for price to fluctuate between the 1st support and the 1st resistance.
The intermediate support level at 0.6482 is identified as a pullback support while the 1st support level at 0.6461 is also marked as pullback support that aligns close to the 78.60% Fibonacci Retracement level. Further below, the 2nd support level at 0.6399 is noted as an overlap support, further emphasizing its importance as a potential support zone.
To the upside, the 1st resistance level at 0.6542 is identified as a pullback resistance that aligns with the 50.00% Fibonacci Retracement level. Higher up, the 2nd resistance level at 0.6614 is also marked as a pullback resistance that aligns close to the 38.20% Fibonacci Retracement level, further highlighting its importance as a potential resistance point.
NZD/USD
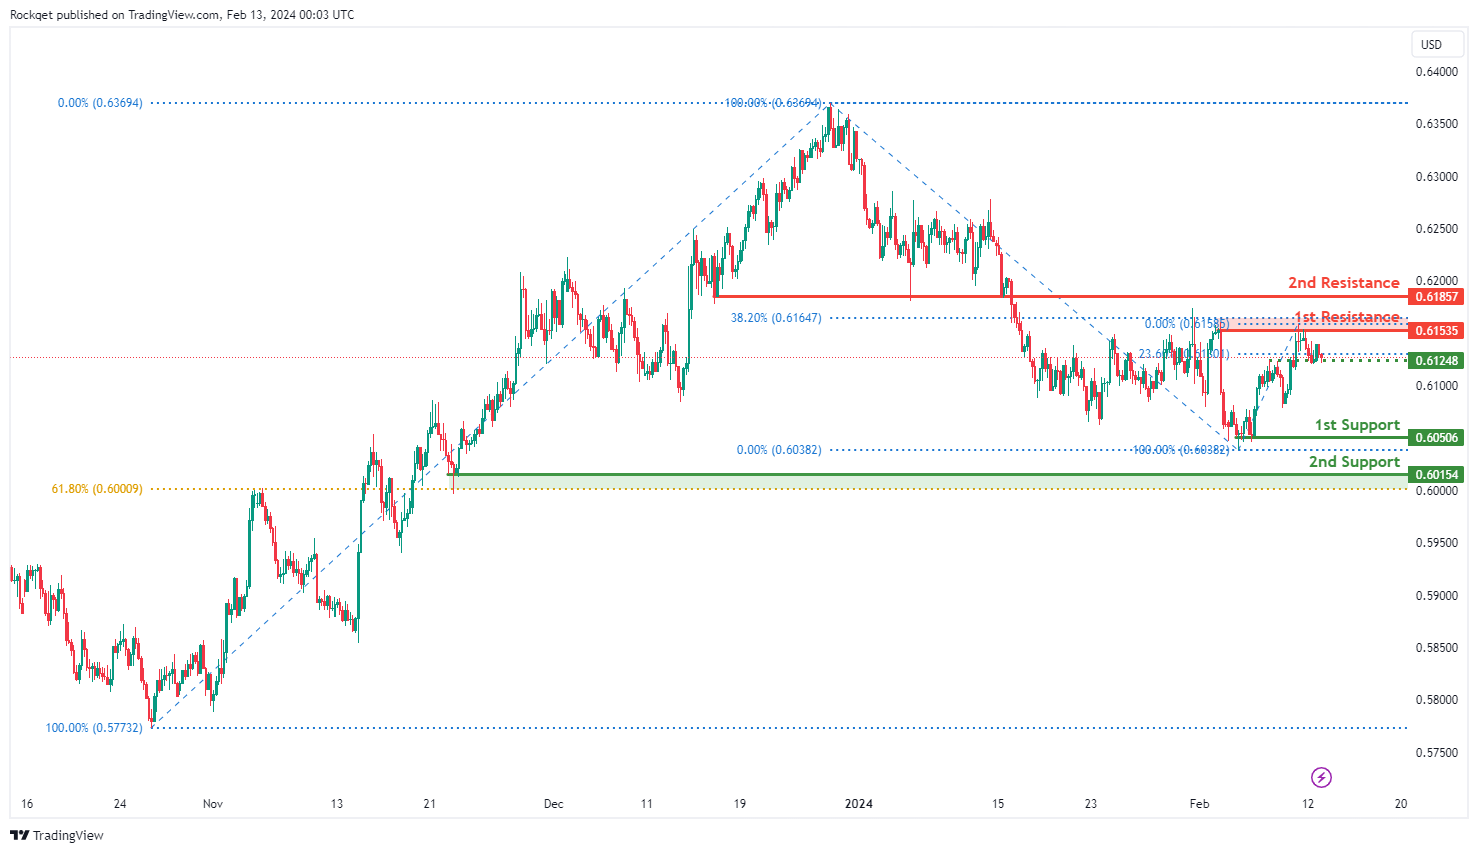
The NZD/USD chart currently exhibits an overall bearish momentum. In this context, there is a potential scenario for price to drop towards the 1st support should it break under the intermediate support.
The intermediate support level at 0.6124 is identified as an overlap support that aligns with the 23.60% Fibonacci Retracement level while the 1st support level at 0.6050 is marked as a pullback support. Further below, the 2nd support level at 0.6015 is also noted as a pullback support that aligns close to the 61.80% Fibonacci Retracement level, further emphasizing its importance as a potential support zone.
To the upside, the 1st resistance level at 0.6153 is marked as a pullback resistance that aligns close to the 38.20% Fibonacci Retracement level. Higher up, the 2nd resistance level at 0.6185 is also marked as a pullback resistance, further highlighting its importance as a potential resistance point.
DJ30:
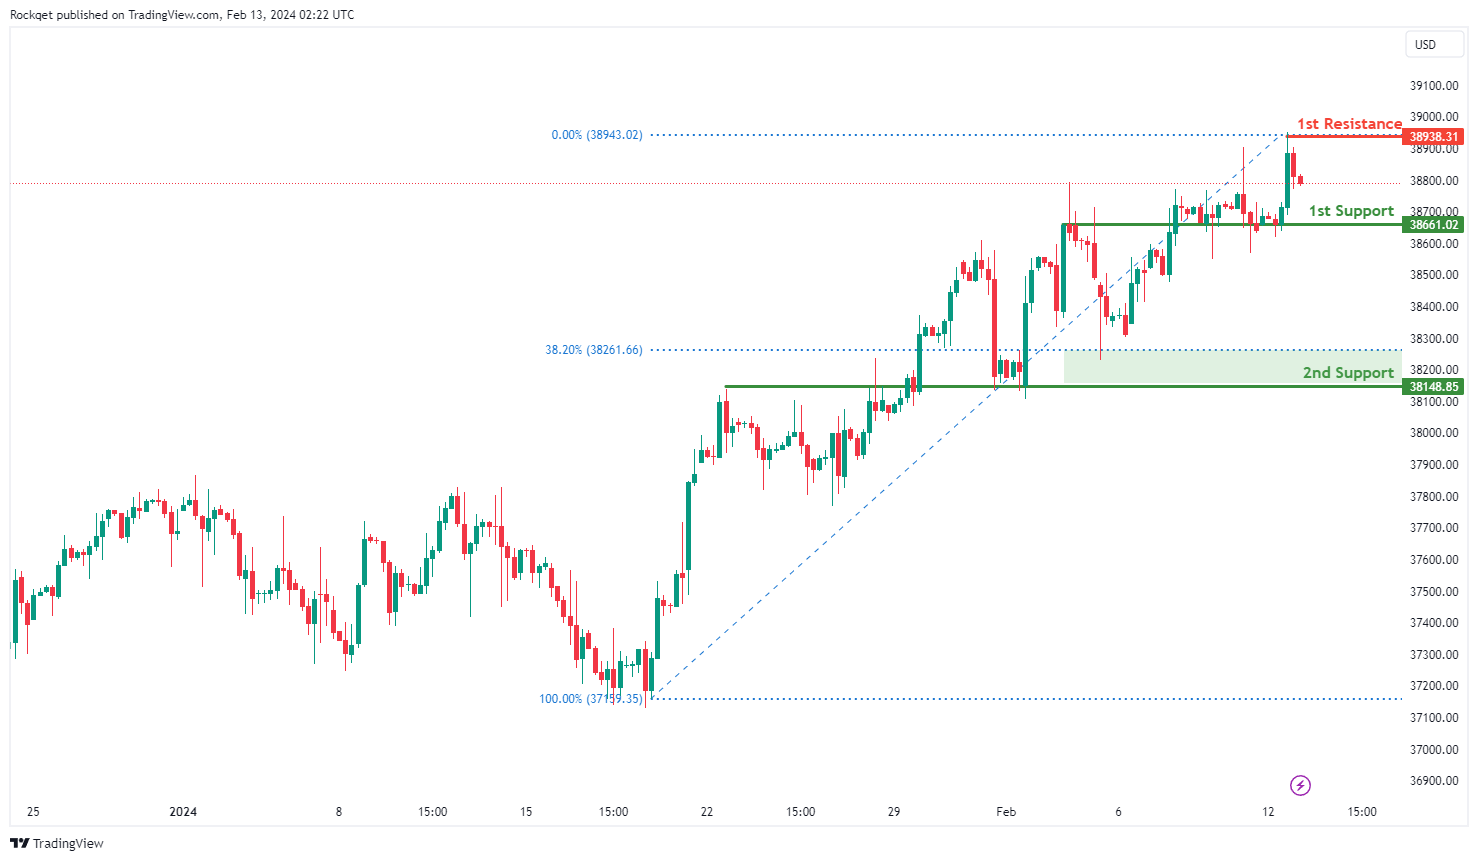
The DJ30 chart currently reflects a bearish momentum, indicating a prevailing downward trend in the market. Given this bearish sentiment, the price could potentially continue its downward movement towards the 1st support level.
The 1st support at 38661.02 is deemed significant as it represents an overlap support, suggesting a historical level where buying interest has previously emerged. Additionally, the 2nd support at 38148.85 aligns with both an overlap support and the 38.20% Fibonacci Retracement level, further reinforcing its potential as a support zone.
On the resistance side, the 1st resistance at 38938.31 is highlighted as a significant barrier where selling pressure may intensify. This level corresponds to a swing high resistance, indicating a historical point where selling interest has emerged.
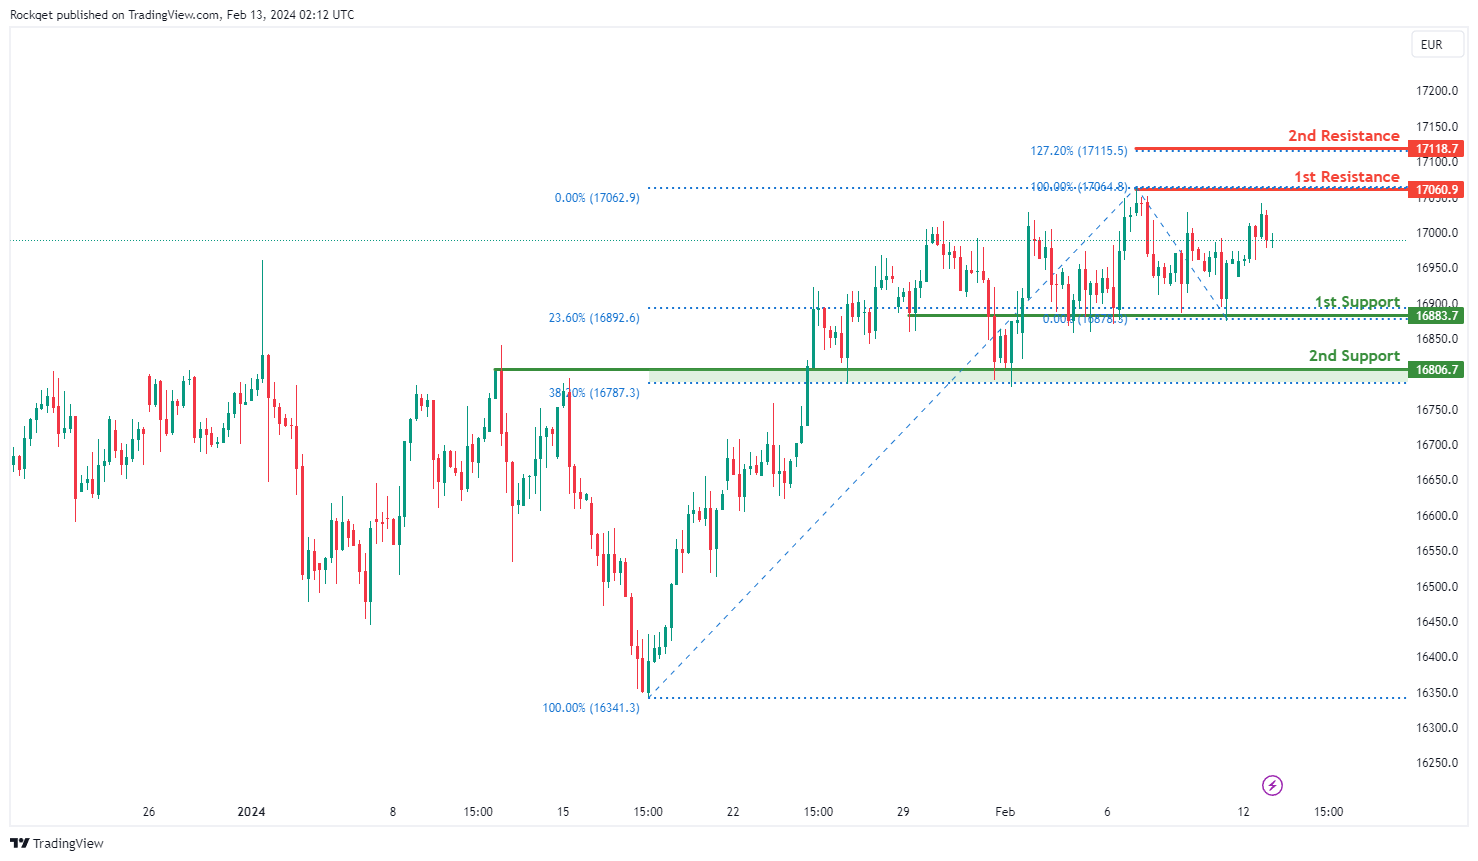
GER40:
The GER40 chart currently demonstrates a bullish momentum, indicating an overall upward trend in the market. Several factors contribute to this bullish sentiment, supporting the potential for a continued upward movement in the price.
The 1st support at 16883.7 is significant as it aligns with an overlap support and the 23.60% Fibonacci Retracement level, indicating a historical level where buying interest has previously emerged. Additionally, the 2nd support at 16806.7 coincides with both an overlap support and the 38.20% Fibonacci Retracement level, further reinforcing its potential as a support zone.
On the resistance side, the 1st resistance at 17060.9 represents a significant barrier where selling pressure may intensify. This level corresponds to a swing high resistance, indicating a historical point where selling interest has emerged.
Furthermore, an intermediate resistance at 17118.7 is identified, aligning with the 127.20% Fibonacci Extension level, adding further significance to this resistance level.
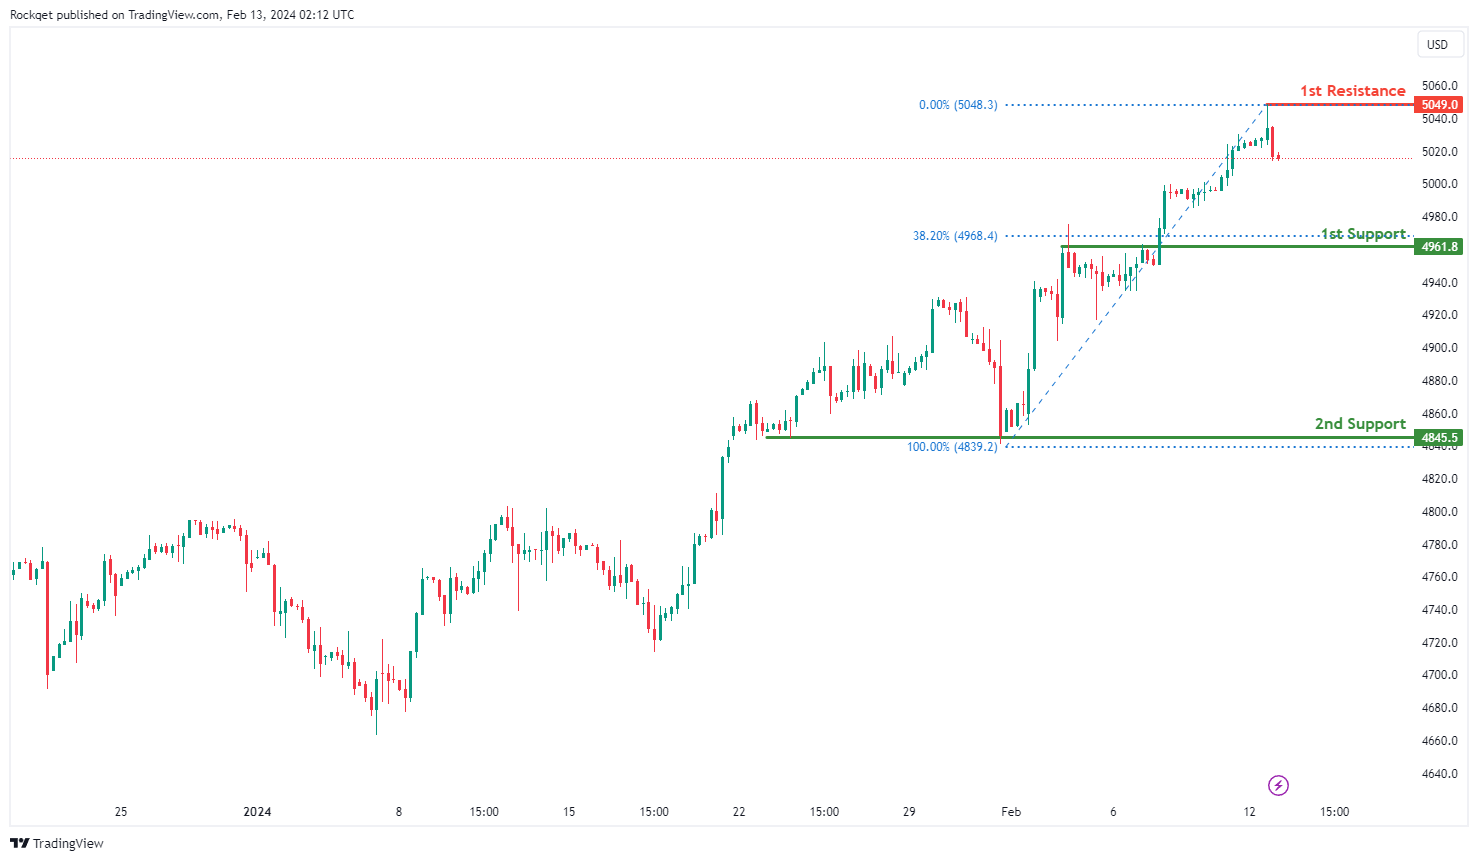
US500:
The US500 chart currently exhibits a bearish momentum, indicating a prevailing downward trend. Several factors contribute to this bearish sentiment, suggesting the potential for a continued downward movement in the price.
The 1st support at 4961.8 is considered significant as it aligns with a pullback support level and the 38.20% Fibonacci Retracement, indicating a historical level where buying interest has previously emerged. Additionally, the 2nd support at 4845.5 is identified as a multi-swing low support, further reinforcing the potential support zone.
On the resistance side, an intermediate resistance level at 5049.0 is noted, corresponding to a swing high resistance. This level may act as a barrier where selling pressure could intensify.
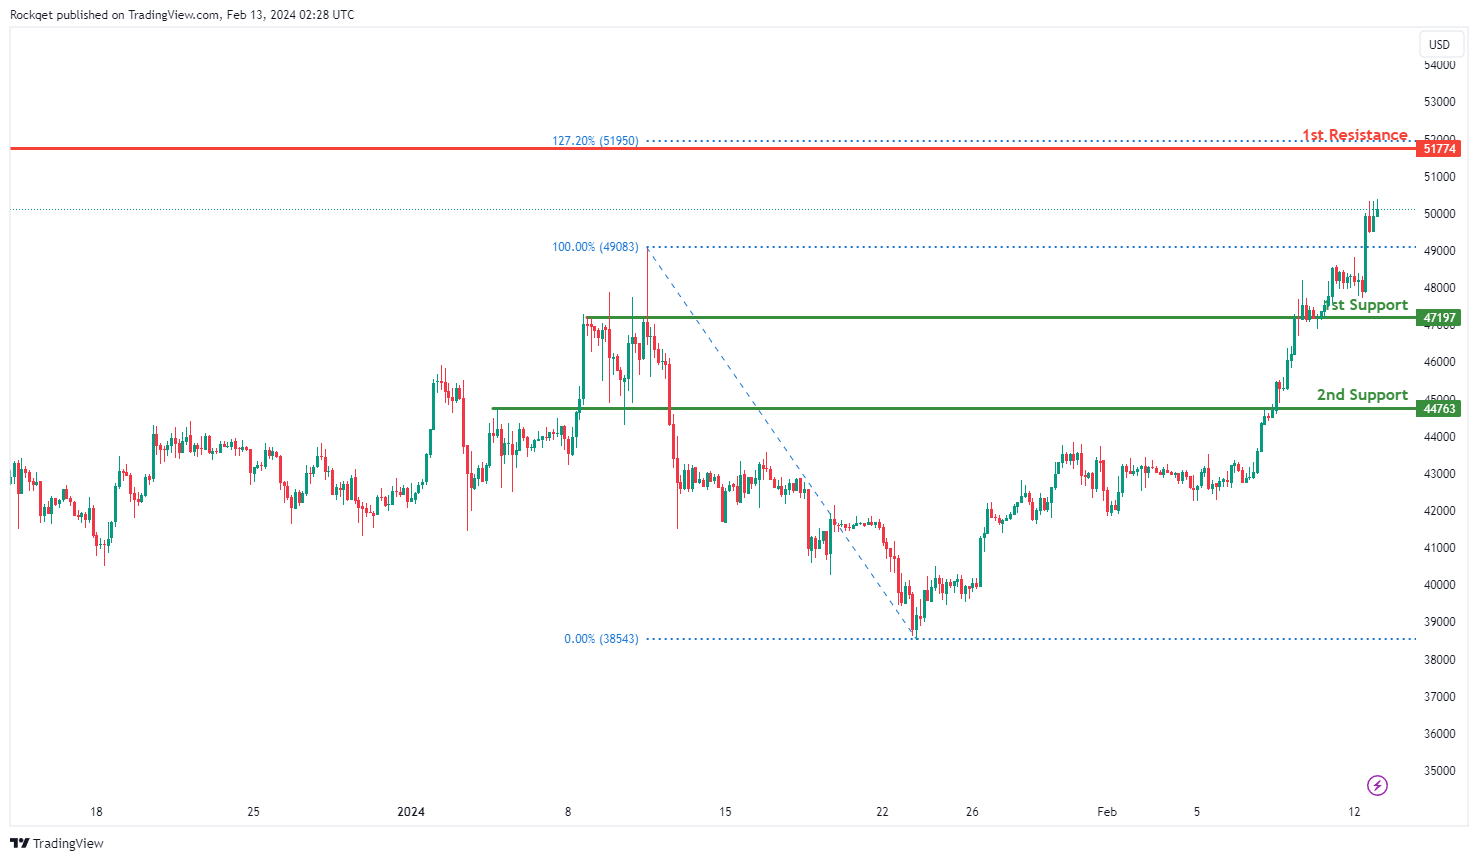
BTC/USD:
The BTC/USD chart currently demonstrates a bullish momentum, indicating an overarching upward trend. Several factors contribute to this bullish sentiment, suggesting the potential for a continued upward movement in the price.
The 1st support level at 47197 is considered significant as it aligns with an overlap support, indicating a historical level where buying interest has previously emerged. Additionally, the 2nd support at 44763 is identified as another overlap support, further reinforcing the potential support zone.
On the resistance side, the 1st resistance level at 51954 is highlighted as a significant barrier where selling pressure may increase, as it coincides with a swing high resistance level and the 127.20% Fibonacci Extension.
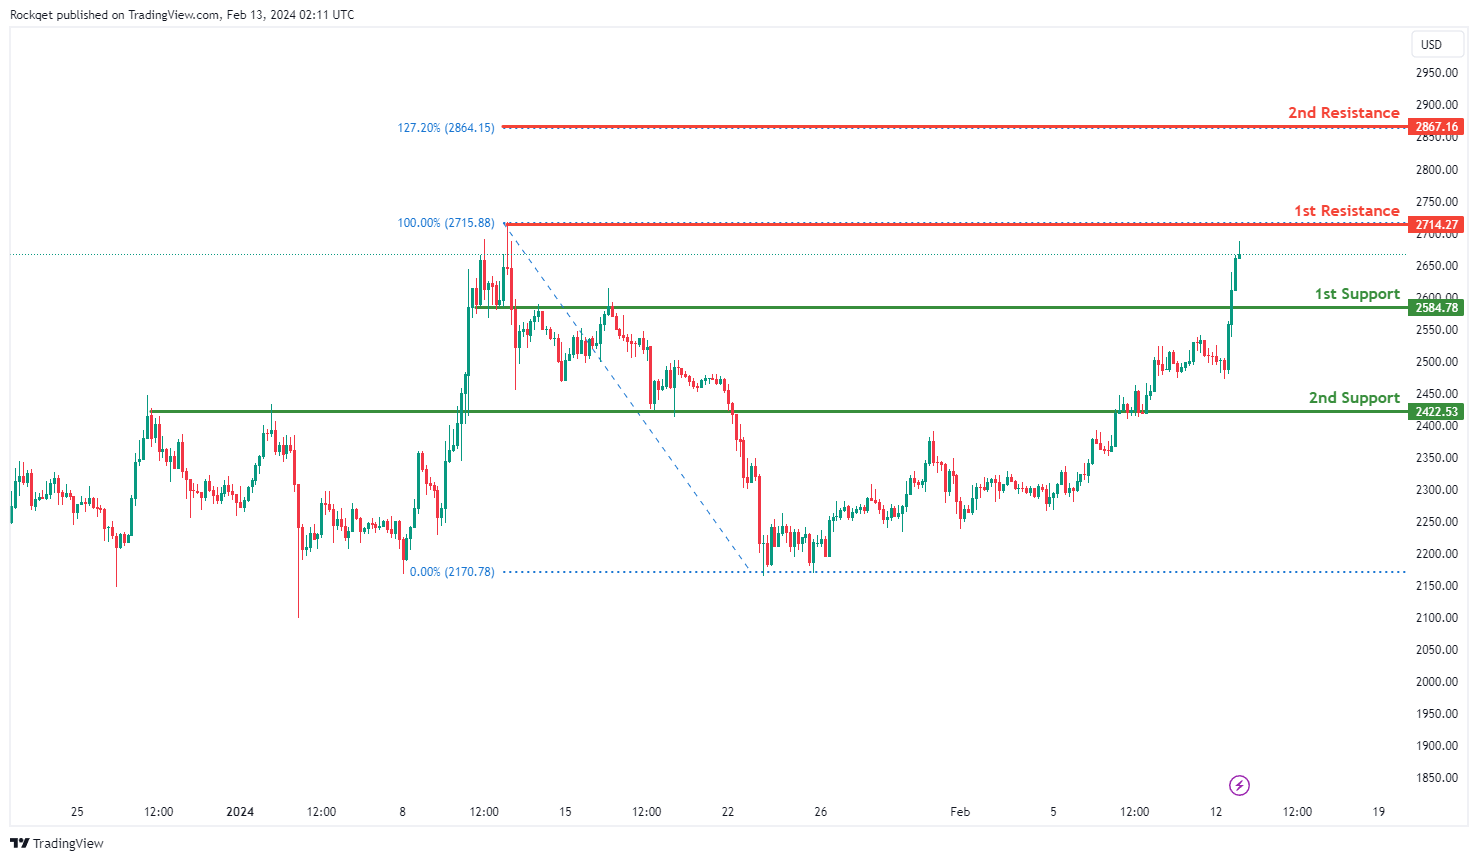
ETH/USD:
The ETH/USD chart currently maintains a bullish momentum, indicating a prevailing upward trend. Several factors contribute to this bullish sentiment, suggesting the potential for further upward movement in the price.
The 1st support level at 2584.78 is considered significant as it aligns with an overlap support, indicating a historical level where buying interest has previously emerged. Furthermore, the 2nd support at 2422.53 also serves as an overlap support, reinforcing the potential support zone.
On the resistance side, the 1st resistance level at 2714.27 stands out as a notable barrier where selling pressure may intensify, as it coincides with a swing high resistance level. Additionally, the 2nd resistance at 2867.16 aligns with the 127.20% Fibonacci Extension, adding further significance to this resistance level.
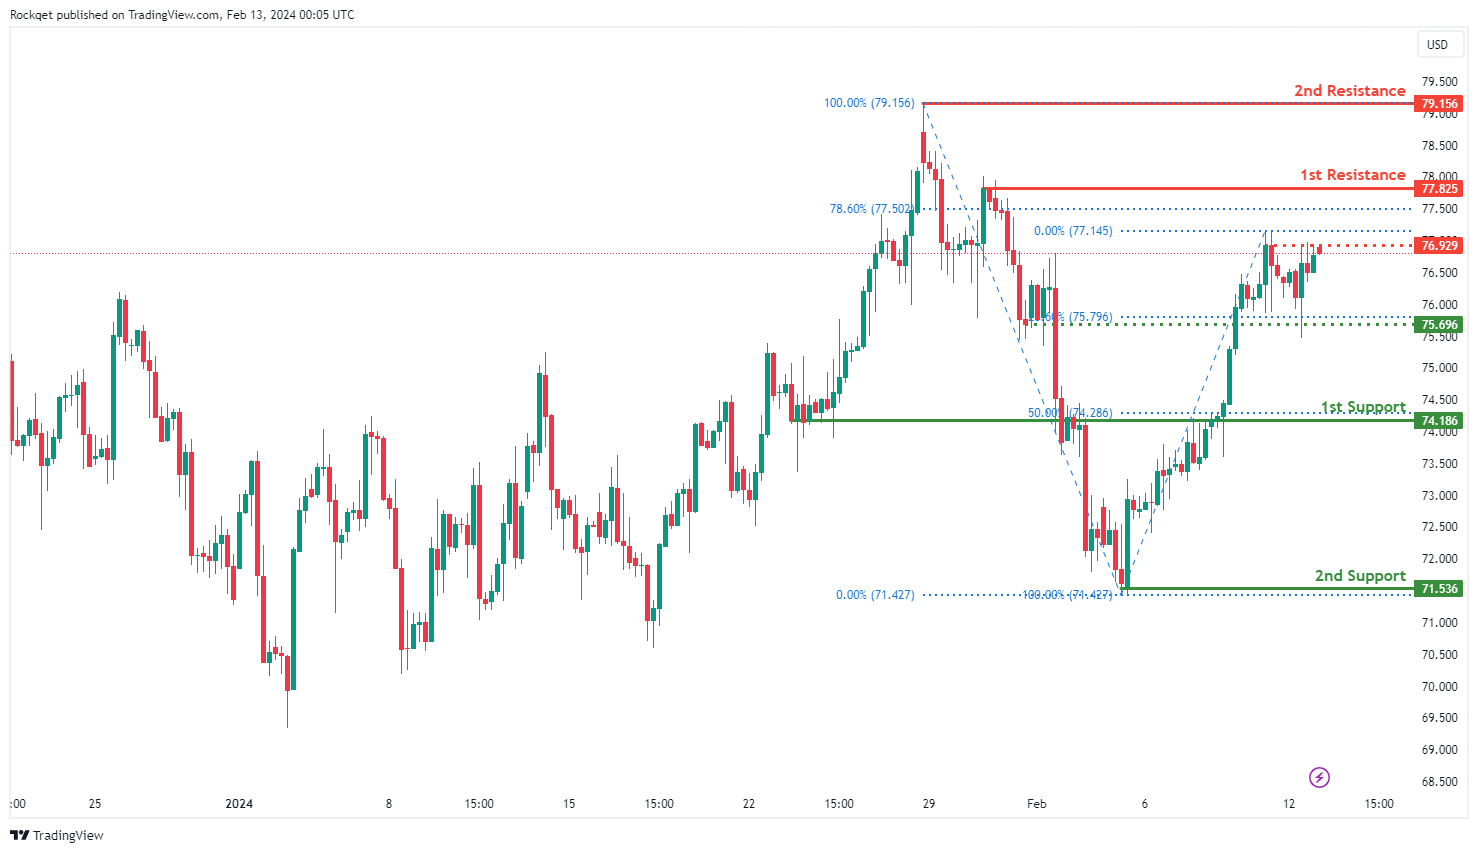
WTI/USD:
The WTI (West Texas Intermediate) chart currently exhibits an overall bullish momentum. In this context, there is a potential scenario for price to rise towards the 1st resistance should it break above the intermediate resistance.
The intermediate resistance level at 76.92 is identified as a pullback resistance while the 1st resistance level at 77.82 is also noted as a pullback resistance that aligns close to the 78.60% Fibonacci Retracement level. Higher up, the 2nd resistance level at 79.15 is marked as a swing-high resistance, further highlighting its importance as a potential resistance zone.
To the downside, the intermediate support level at 75.69 is identified as a pullback support that aligns with the 23.60% Fibonacci Retracement level while the 1st support level at 74.18 is noted as an overlap support that aligns with the 50.00% Fibonacci Retracement level. Further below, the 2nd support level at 71.53 is identified as a swing-low support, reinforcing its significance as a key support level.
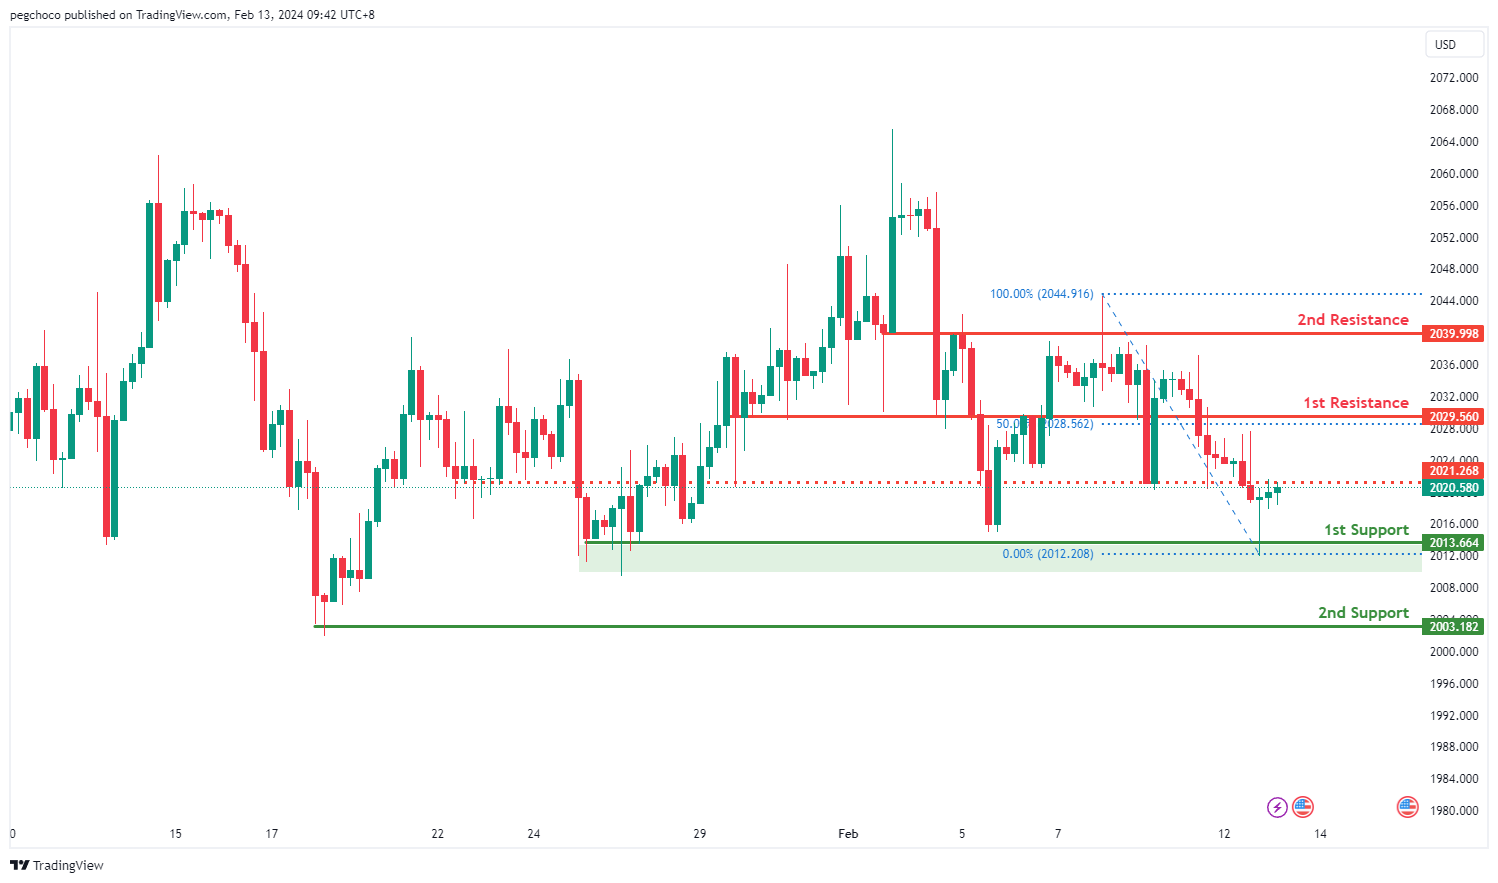
XAU/USD (GOLD):
The XAUUSD chart currently demonstrates bullish momentum, indicating a potential continuation of the upward trend.
The first support level at 2013.66 is recognized as a multi-swing low support, suggesting a significant level where buying interest has historically emerged. Additionally, the second support at 2003.18 is characterized as a swing low support, reinforcing its significance as a level where buyers are likely to intervene.
On the resistance side, the first resistance is identified at 2029.56, noted as an overlap resistance. This level is particularly noteworthy as it aligns with the 50% Fibonacci Retracement level, indicating a potential area where selling pressure could emerge. Similarly, the second resistance at 2039.99 is categorized as an overlap resistance, presenting another potential barrier where price may encounter resistance.
Intermediate resistance at 2021.26 is labeled as an overlap resistance, highlighting another level where selling pressure may materialize.
The accuracy, completeness and timeliness of the information contained on this site cannot be guaranteed. IC Markets does not warranty, guarantee or make any representations, or assume any liability regarding financial results based on the use of the information in the site.
News, views, opinions, recommendations and other information obtained from sources outside of www.icmarkets.com, used in this site are believed to be reliable, but we cannot guarantee their accuracy or completeness. All such information is subject to change at any time without notice. IC Markets assumes no responsibility for the content of any linked site.
The fact that such links may exist does not indicate approval or endorsement of any material contained on any linked site. IC Markets is not liable for any harm caused by the transmission, through accessing the services or information on this site, of a computer virus, or other computer code or programming device that might be used to access, delete, damage, disable, disrupt or otherwise impede in any manner, the operation of the site or of any user’s software, hardware, data or property.


