EUR/USD:
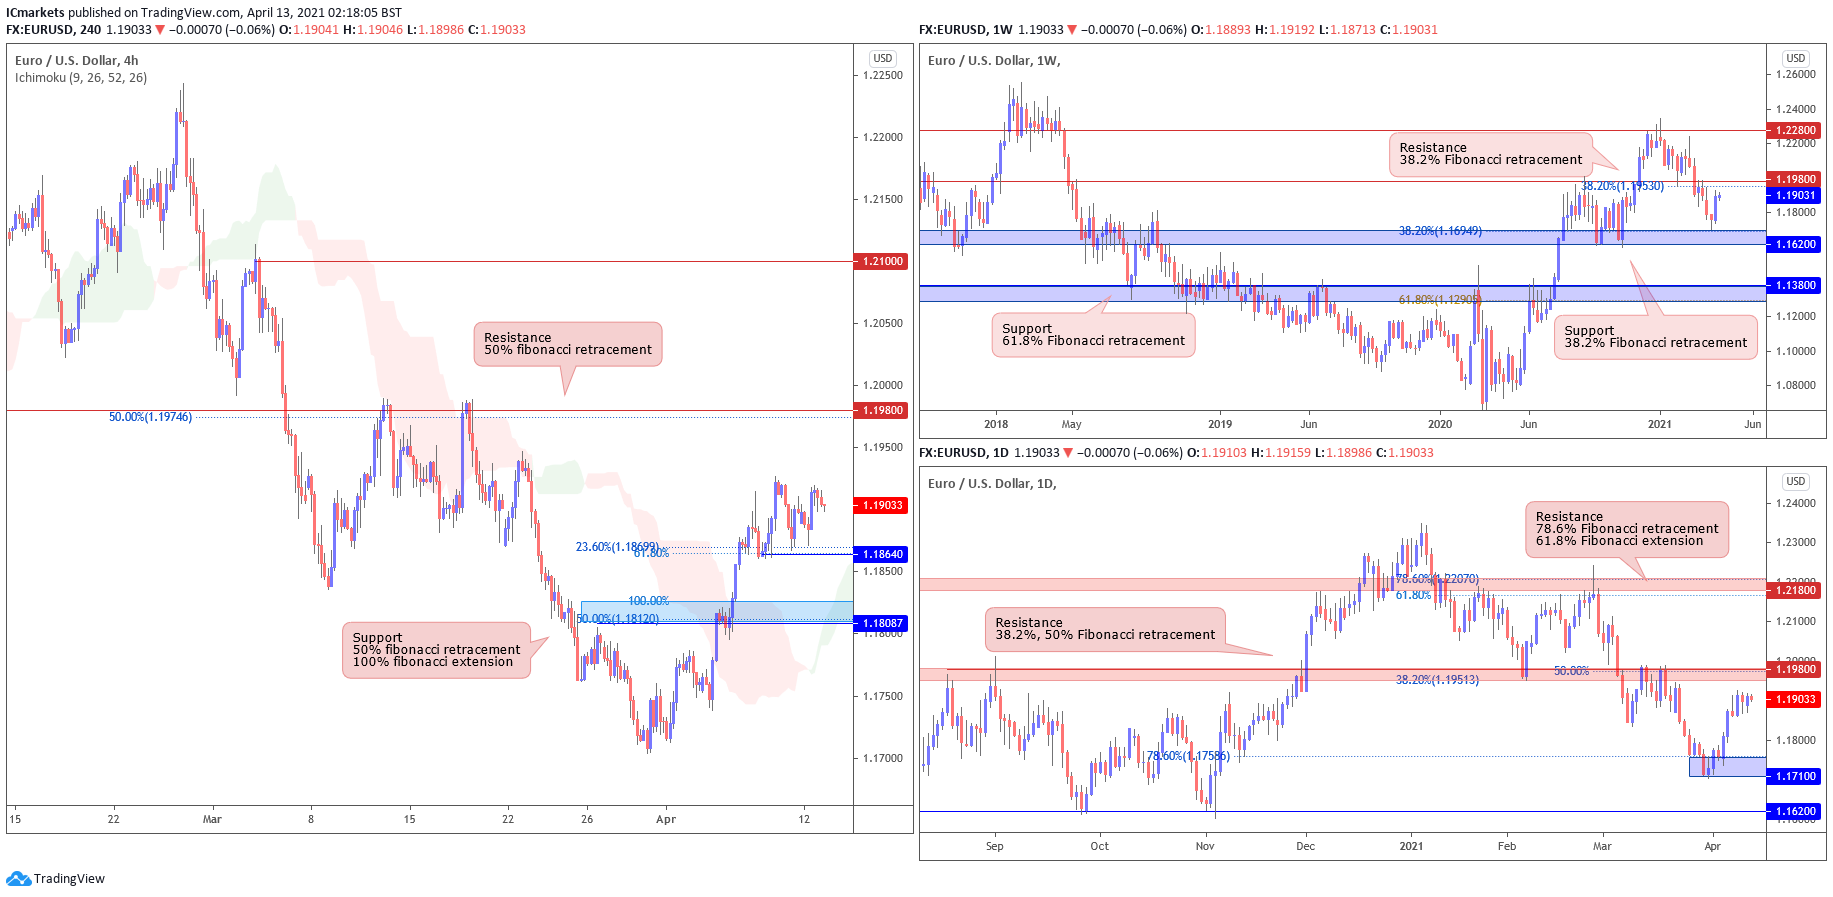
Looking at the weekly chart, we can see that prices are facing bearish pressure from our resistance at 1.19800 where we could see a further drop below this level. On the daily time frame, it echoes the same bearish view as well where we could see a further drop before prices reach its support at 1.17100.
On the H4 timeframe, prices are trading between our resistance at 1.19800 and support at 1.18640. Keeping in mind that the view on the larger time frame is bearish, a break below our H4 support level at 1.18640 could trigger a further drop to our next support target at 1.18087.
Areas of consideration:
- 19800 resistance area found on H4 time frame
- 18640 support area found on H4 time frame
GBP/USD:
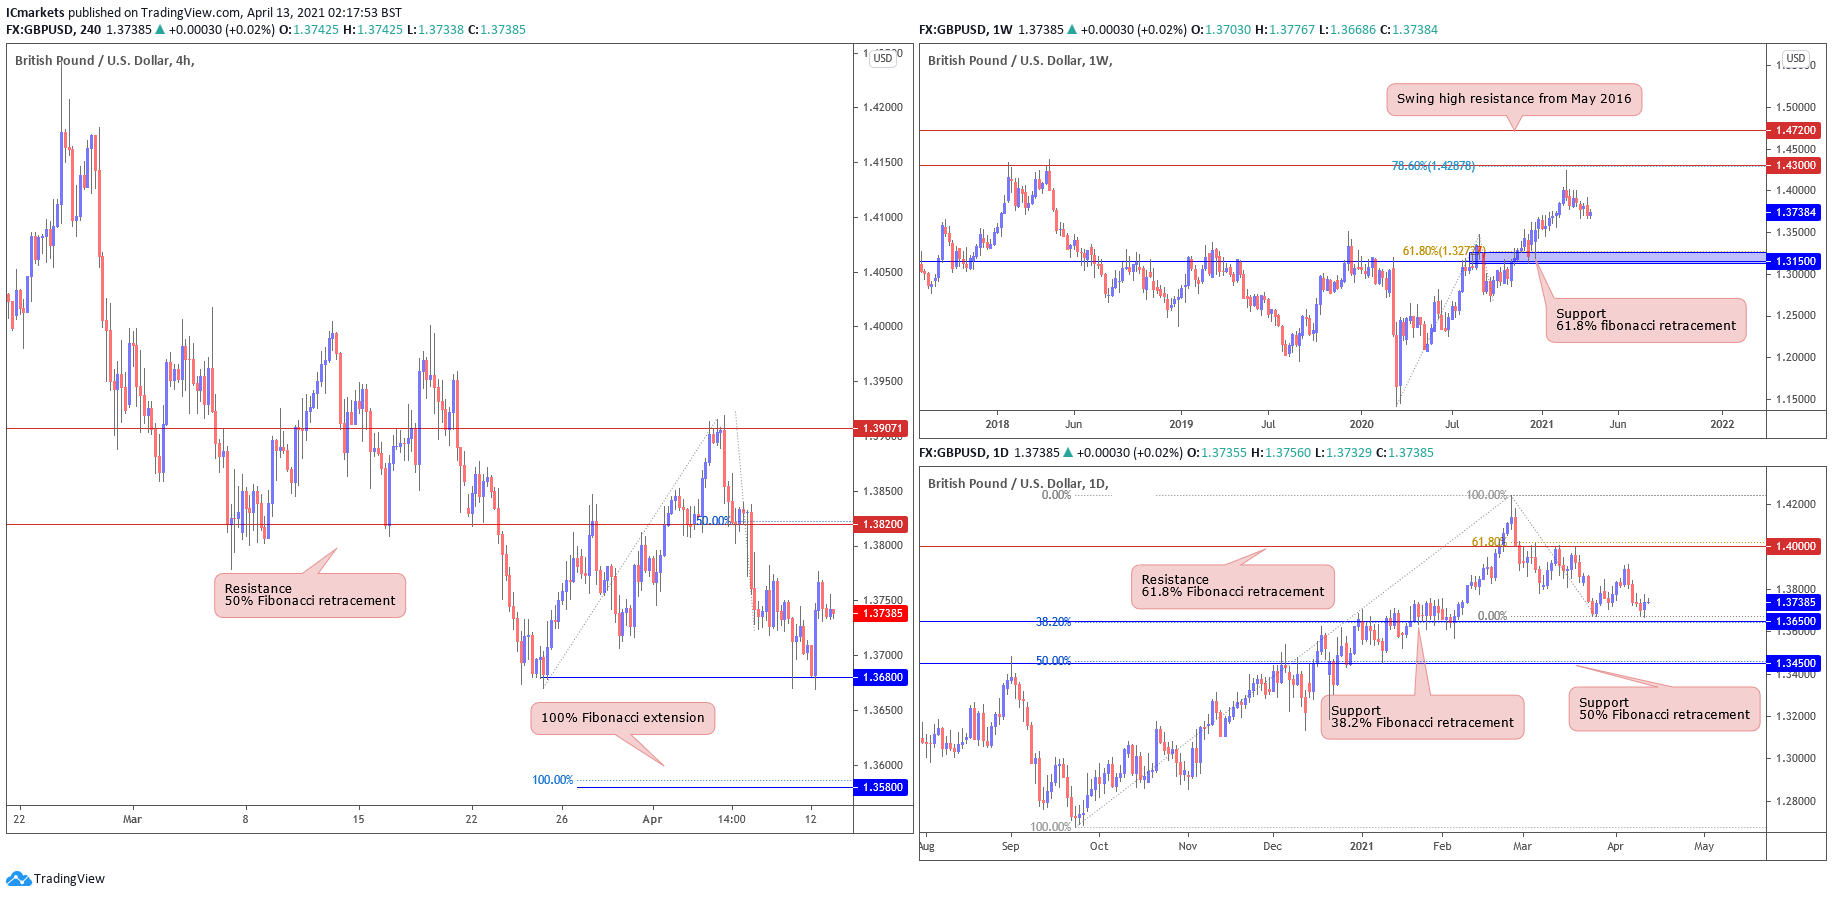
Looking at the weekly chart, we can see that prices are facing bearish pressure from our resistance at 1.43000 and could see a further downside before it reaches our support area at 1.31500. On the daily time frame, prices could see further downside before approaching a key support level at 1.36500, in line with our graphical support level and 38.2% fibonacci retracement.
On the H4 timeframe, prices are trading between our support level at 1.36800 and resistance level at 1.38200. A break below our H4 support at 1.36800 could see a further drop to our next support level at 1.35800 in line with the 100% fibonacci extension.
Areas of consideration:
- 38200 resistance area found on H4 time frame
- 36800 support area found on H4 timeframe
AUD/USD:
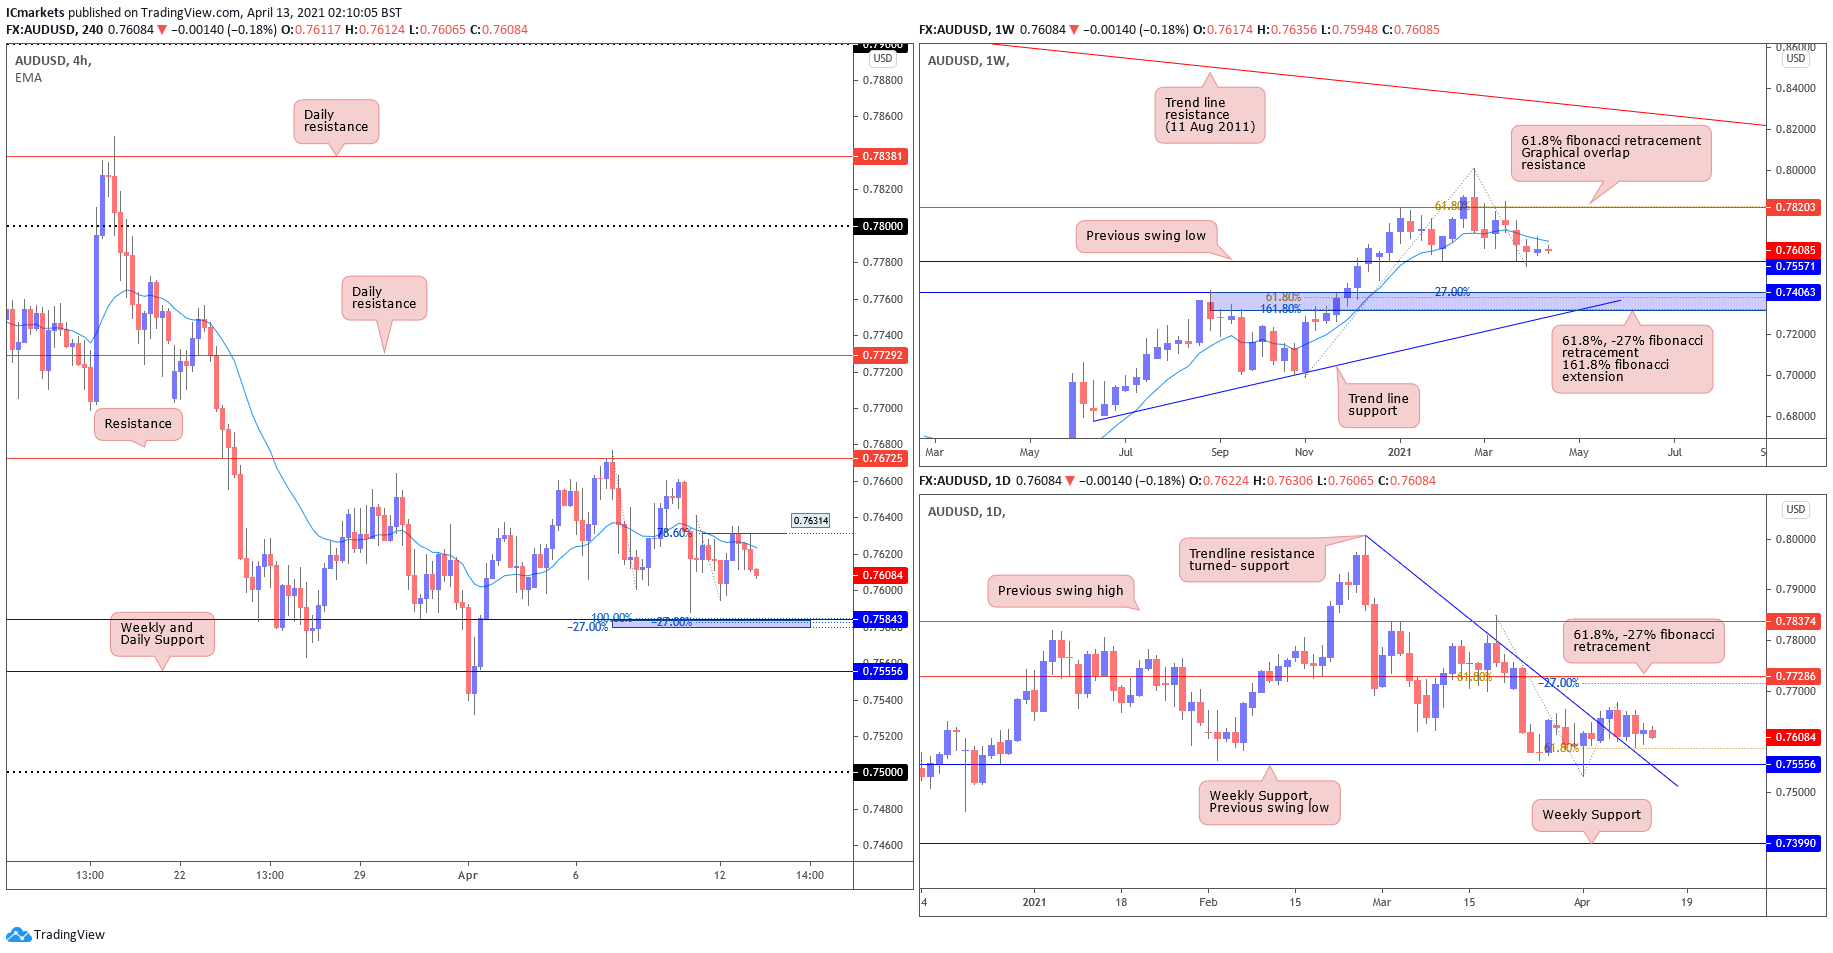
From the Weekly timeframe, prices are holding nicely above ascending trendline support. Prices are taking support from support which is a horizontal pullback support in line with -27%, 61.8% Fibonacci retracement and 161.8% Fibonacci extension. Prices take resistance from 0.78203 level in line with 61.8% FIbonacci retracement and horizontal graphical overlap.
On the daily time frame, prices have broken out of the descending trendline resistance and is taking support from horizontal swing low support which coincides with 61.8% FIbonacci retracement. Prices might push up towards resistance at 0.77286 in line with -27%, 61.8% Fibonacci retracement and horizontal graphical overlap.
On the H4, as expected, price went towards 0.75843 in line with 100% fibonacci extension and -27% fibonacci retracement before making lower highs and lower lows, signifying that a bearish trend is in play. On the recent move, price has reversed from 78.6% fibonacci retracement at 0.76314, and the target for that bearish move will be at -27% fibonacci retracement, in line with our previous support level at 0.75843.
Areas of consideration:
- H4 showing short-term bearish momentum prices might push down towards 0.75843 and take support there
- Daily time frame showing that prices have broken out of descending trendline resistance
- Weekly time shows price approaching ascending trendline support, potential for bounce.
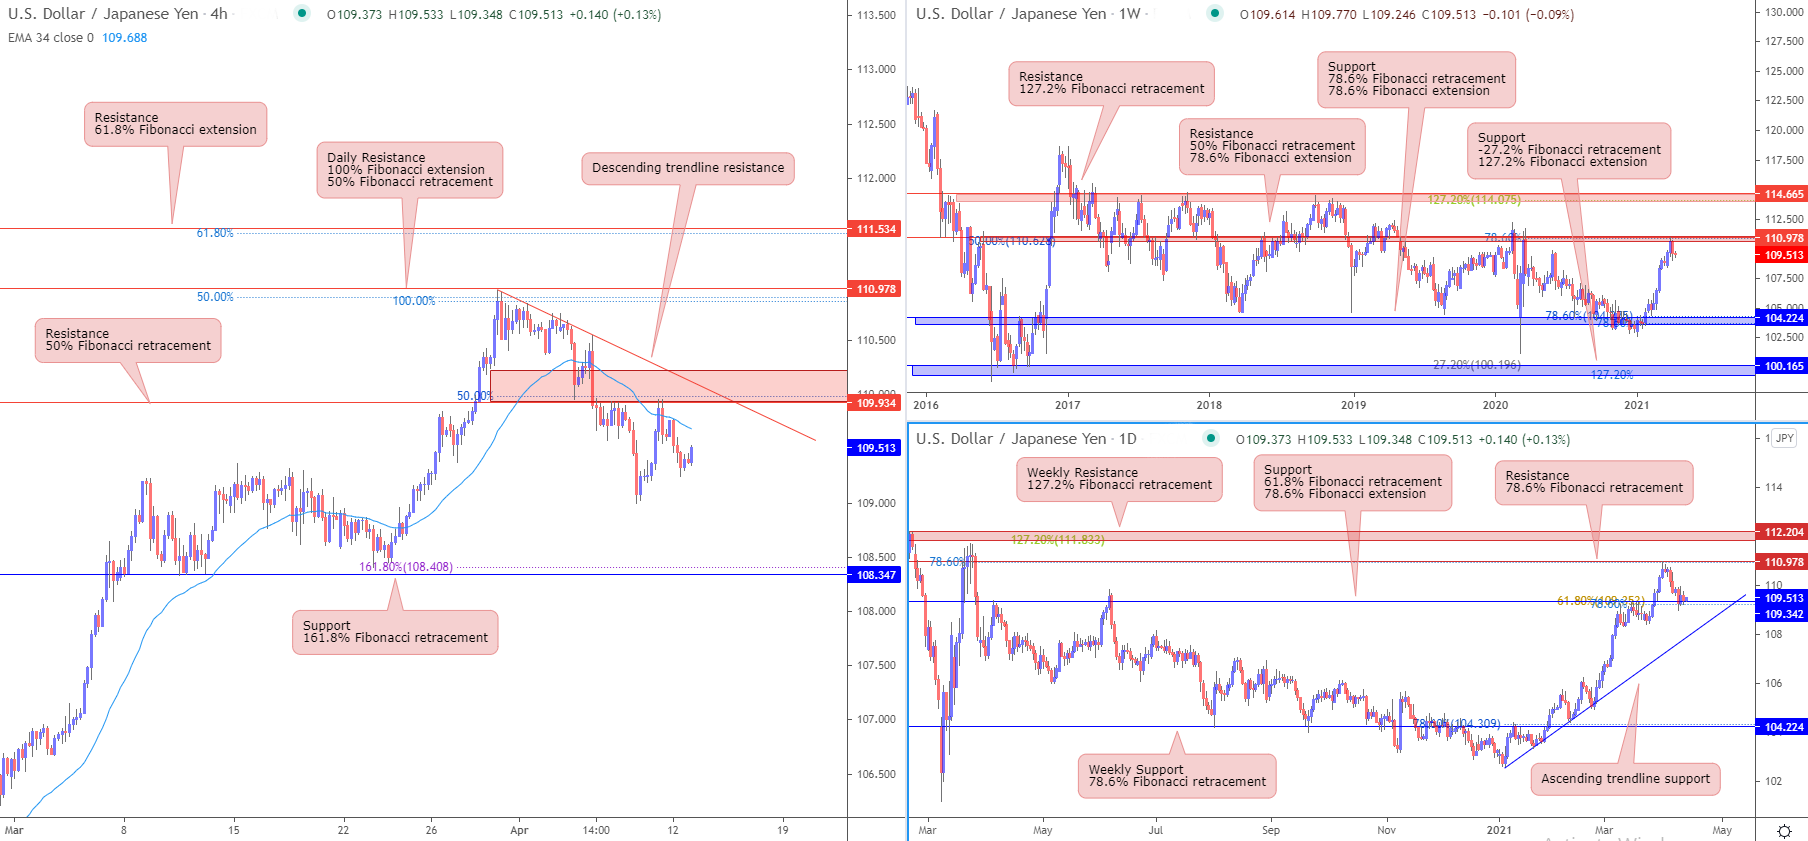
USD/JPY
From the weekly timeframe, prices are facing resistance from horizontal swing high resistance which coincides with 50% Fibonacci retracement and 78.6% Fibonacci extension, taking support from 104.224 level which is in line with 78.6% FIbonacci retracement and 78.6% FIbonacci extension. On the daily time frame, prices are facing resistance from both the horizontal swing high resistance which coincides with 78.6% FIbonacci retracement as well as the 112.204 level. Prices broke through the 109.342 level and is pushing down to take support on ascending trendline support.
On the H4, prices are facing resistance from descending trendline resistance and horizontal swing high resistance in line with 50% Fibonacci retracement. Prices might push down to support level in line with horizontal swing low support which coincides with 161.8% Fibonacci retracement. EMA is also above prices, giving a bearish pressure for prices, in line with our analysis.
Areas of consideration:
- On the H4, prices might push down to support level 108.347
- Price facing resistance from 110.978 on weekly
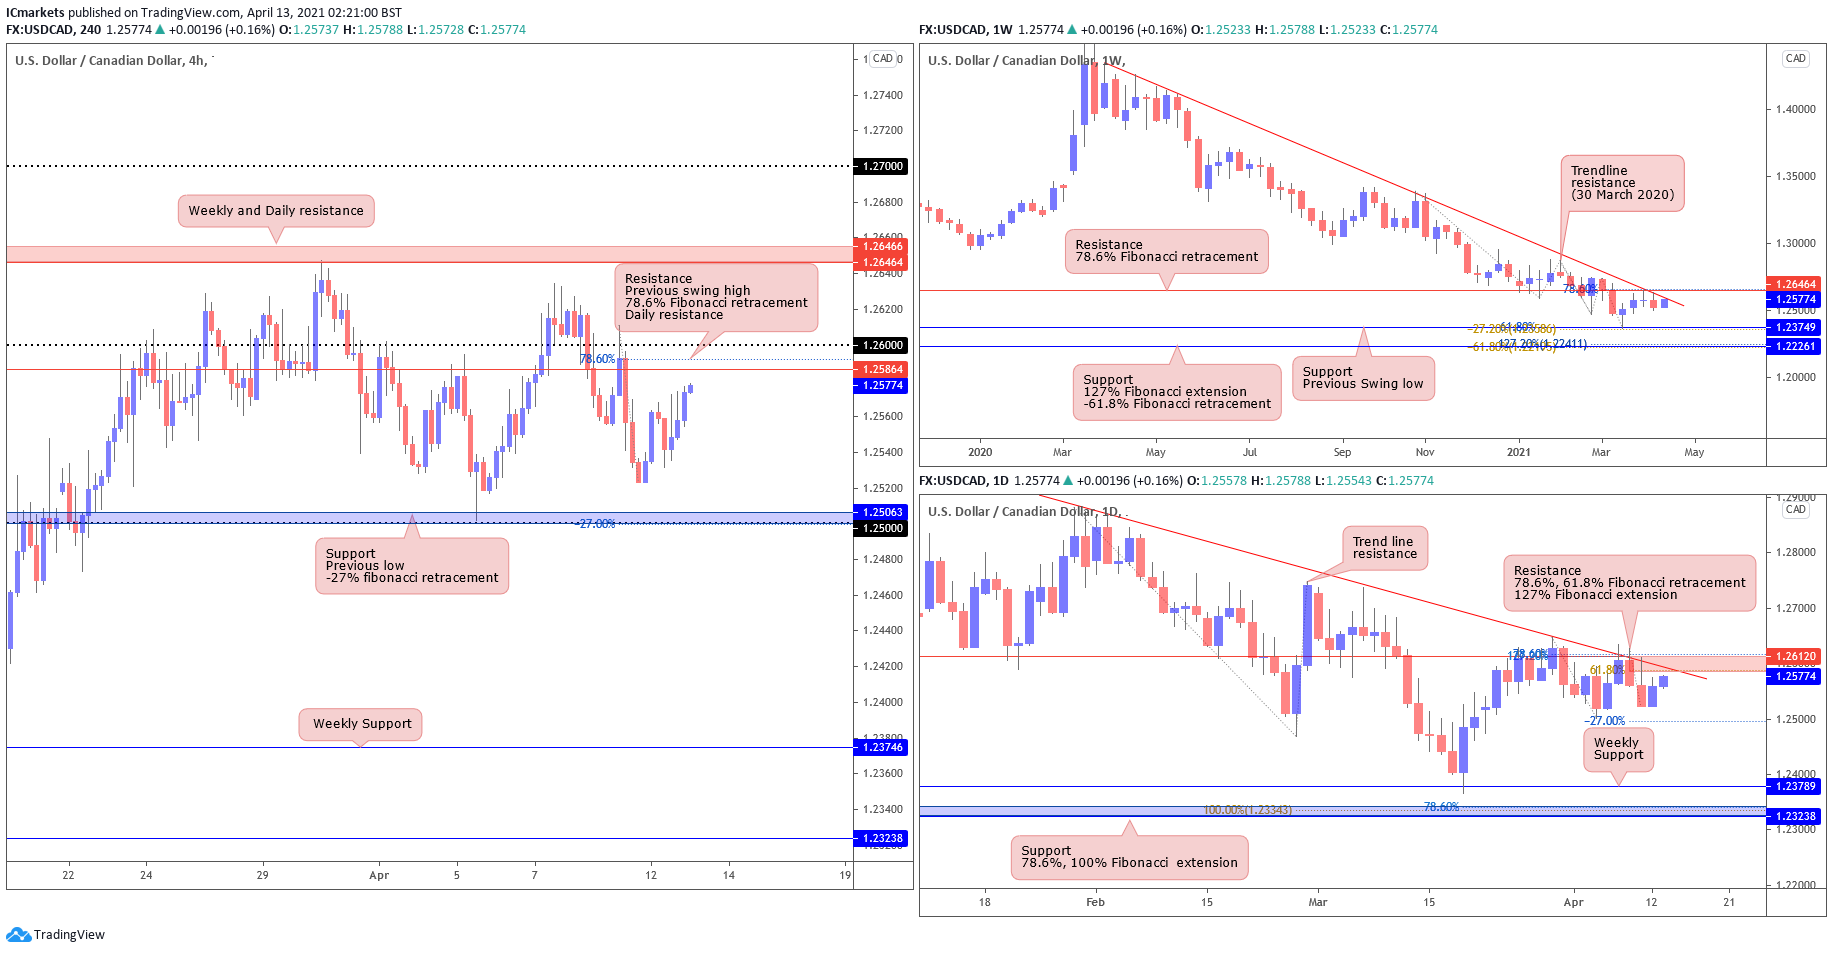
USD/CAD:
The weekly chart shows that price trending sideways and is currently testing the descending trendline resistance drawn from 30 March (2020). It is worth noting that the price has been bearish since. On the daily chart, we are seeing a similar move also shows a similar picture of side ways movement, price is holding under the fibonacci confluence at 1.26120 and may be coming back into 1.25875 area for a test of the 61.8% fibonacci retracement level, before pushing lower.
On the H4, price seems to be making a short-term bullish pullback, where we could possibly see a reversal at the 78.6% fibonacci retracement level at 1.25864, within touching distance of 1.26 major level. This could be a good port of call for the next bearish movement towards the level of 1.25063, in line with -27% fibonacci retracement, in line with previous swing low support.
Areas of consideration:
- The weekly 1.26464 resistance is a key intraday level to watch.
- Price could pull back towards 1.25927 before pushing downside towards 1.25063.
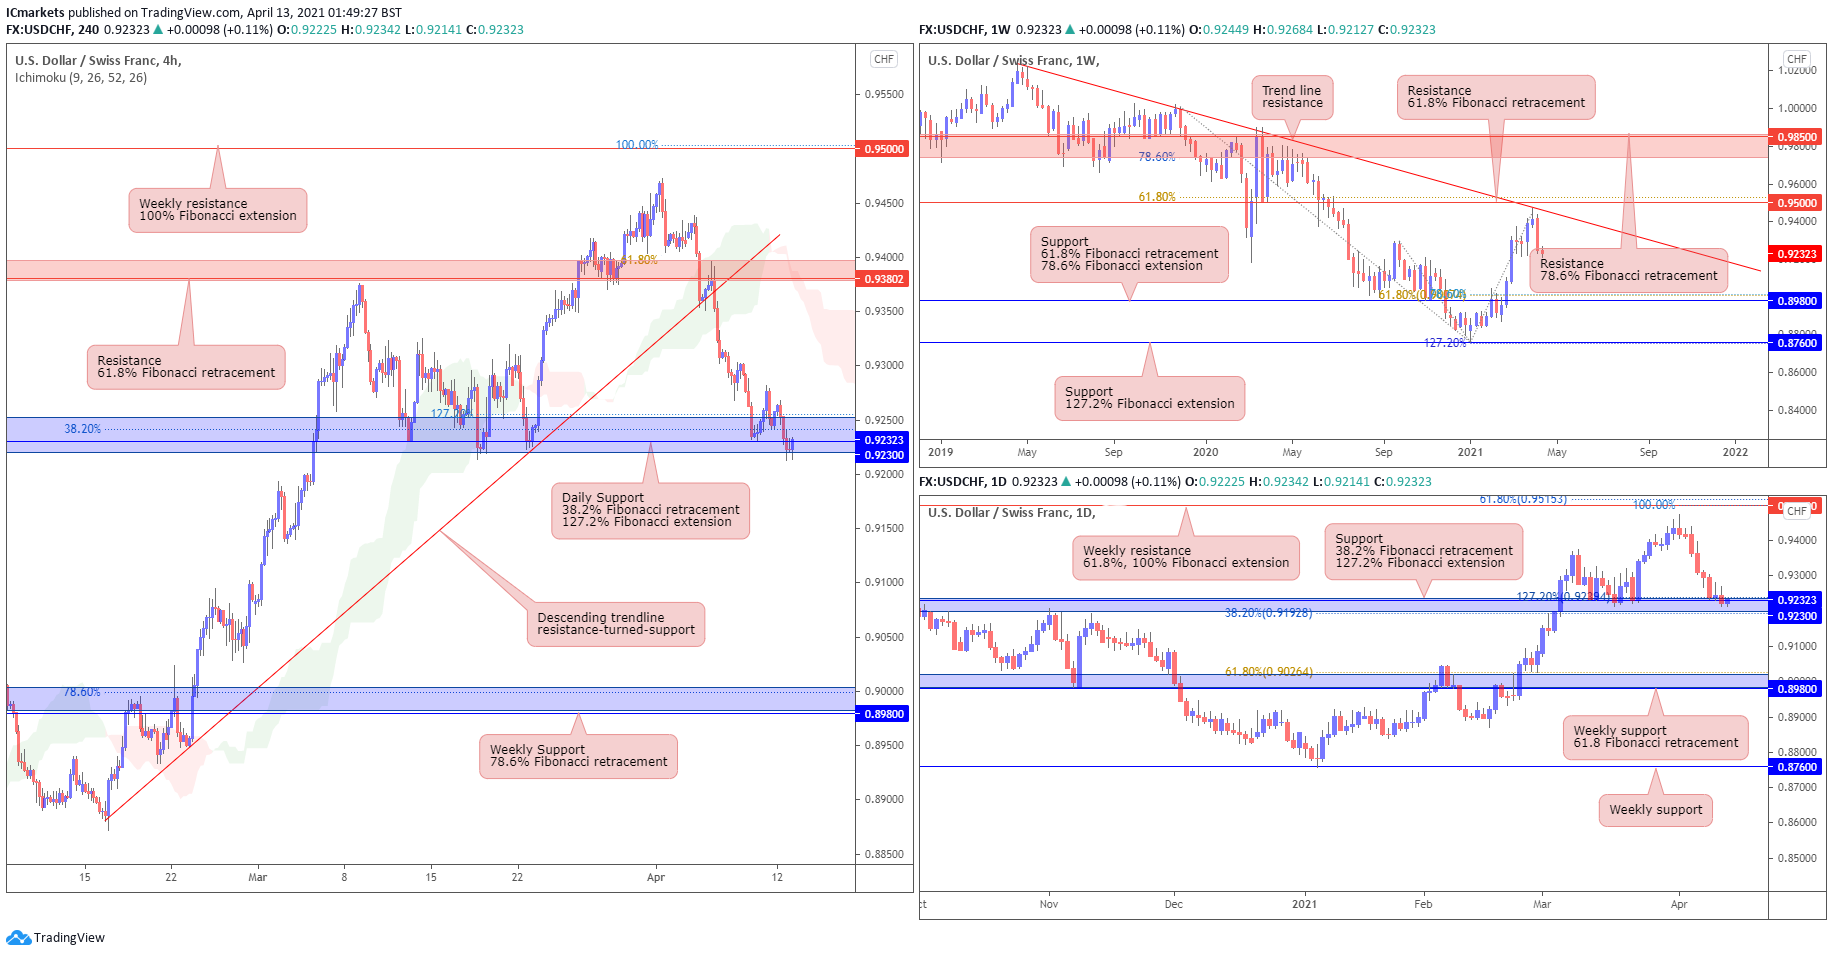
USD/CHF:
USD/CHF has seen a reversal at the descending trendline resistance and is now holding below the weekly 0.95000 resistance level which is in line with our 61.8% Fibonacci retracement. The daily chart shows that price is now testing the key daily 0.92300 support level, in line with our 38.2% Fibonacci retracement and 127.2% Fibonacci extension. We could potentially see further downside should price break below the key daily 0.92300 support level.
On the H4 chart, we can see that price is now testing the key daily 0.92300 support level. The daily 0.92300 support level will be a key intraday level to watch. We note that price is also holding below the Ichimoku cloud after breaking below the ascending trendline support. Should price break and close below the daily 0.92300 support, we could potentially see it swing further towards weekly 0.89800 support level, in line with 78.6% Fibonacci retracement. Otherwise, should price hold above the 0.92300 support, we could see it bounce and retest the 0.93802 resistance in line with 61.8% Fibonacci retracement.
Areas of consideration:
- The daily 0.92300 support level is a key intraday level to watch
- Failure to hold above the key support level may see price swing towards the next 0.89800 weekly support.
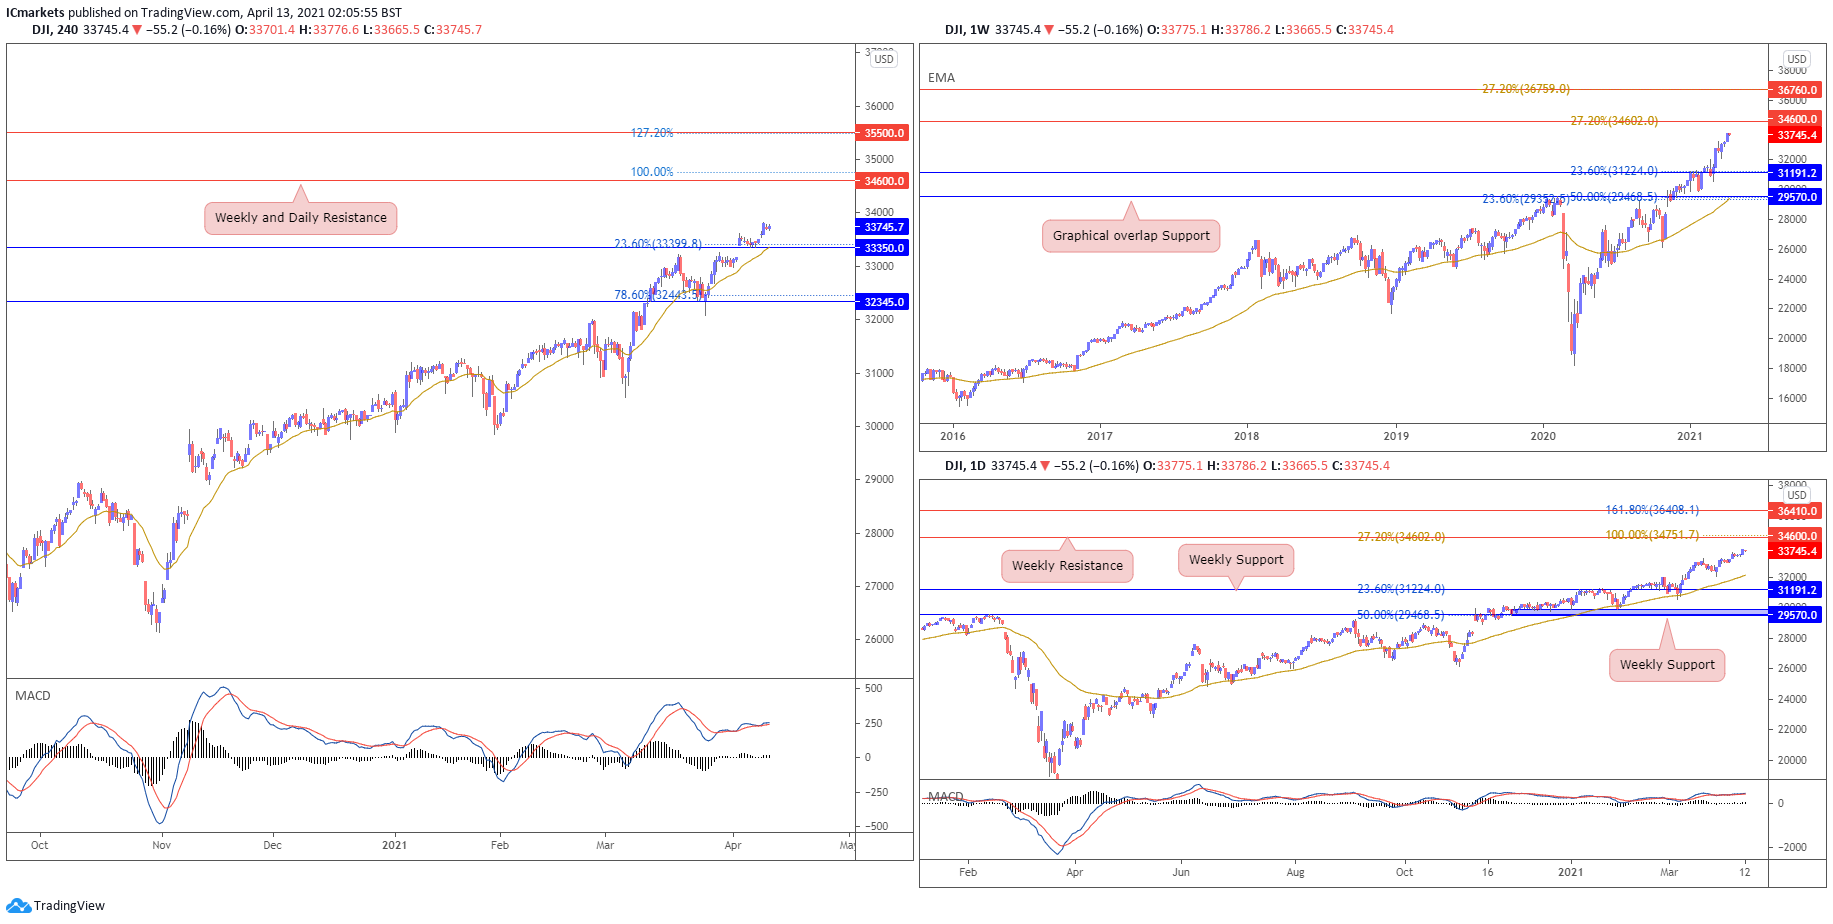
Dow Jones Industrial Average:
On the weekly chart, price made a new all time high, pushing towards 34600 resistance. A weekly close below 34600 resistance could see a short term pullback and long term traders looking to short, may add to their shorts below 34600. On the Daily, we see price drifting higher, with technical indicators continue to show room for further bullish upside. Buyers could possibly look to add to their longs on any price pullbacks with possible target at 34600 weekly resistance. However this upside towards our weekly resistance seems limited.
On the H4, price drifted sideways overnight. With technical indicators still showing room for further bullish momentum, we expect a medium probability scenario where 33350 support is the level buyers could possibly enter with their longs to push price towards 34600 weekly resistance as a possible target. Otherwise, failure to hold above 33350 should see price fall towards 32345.
Areas of consideration:
- H4 33350 support to hold for further rise in price
- Long term indicators show room for further bullish upside
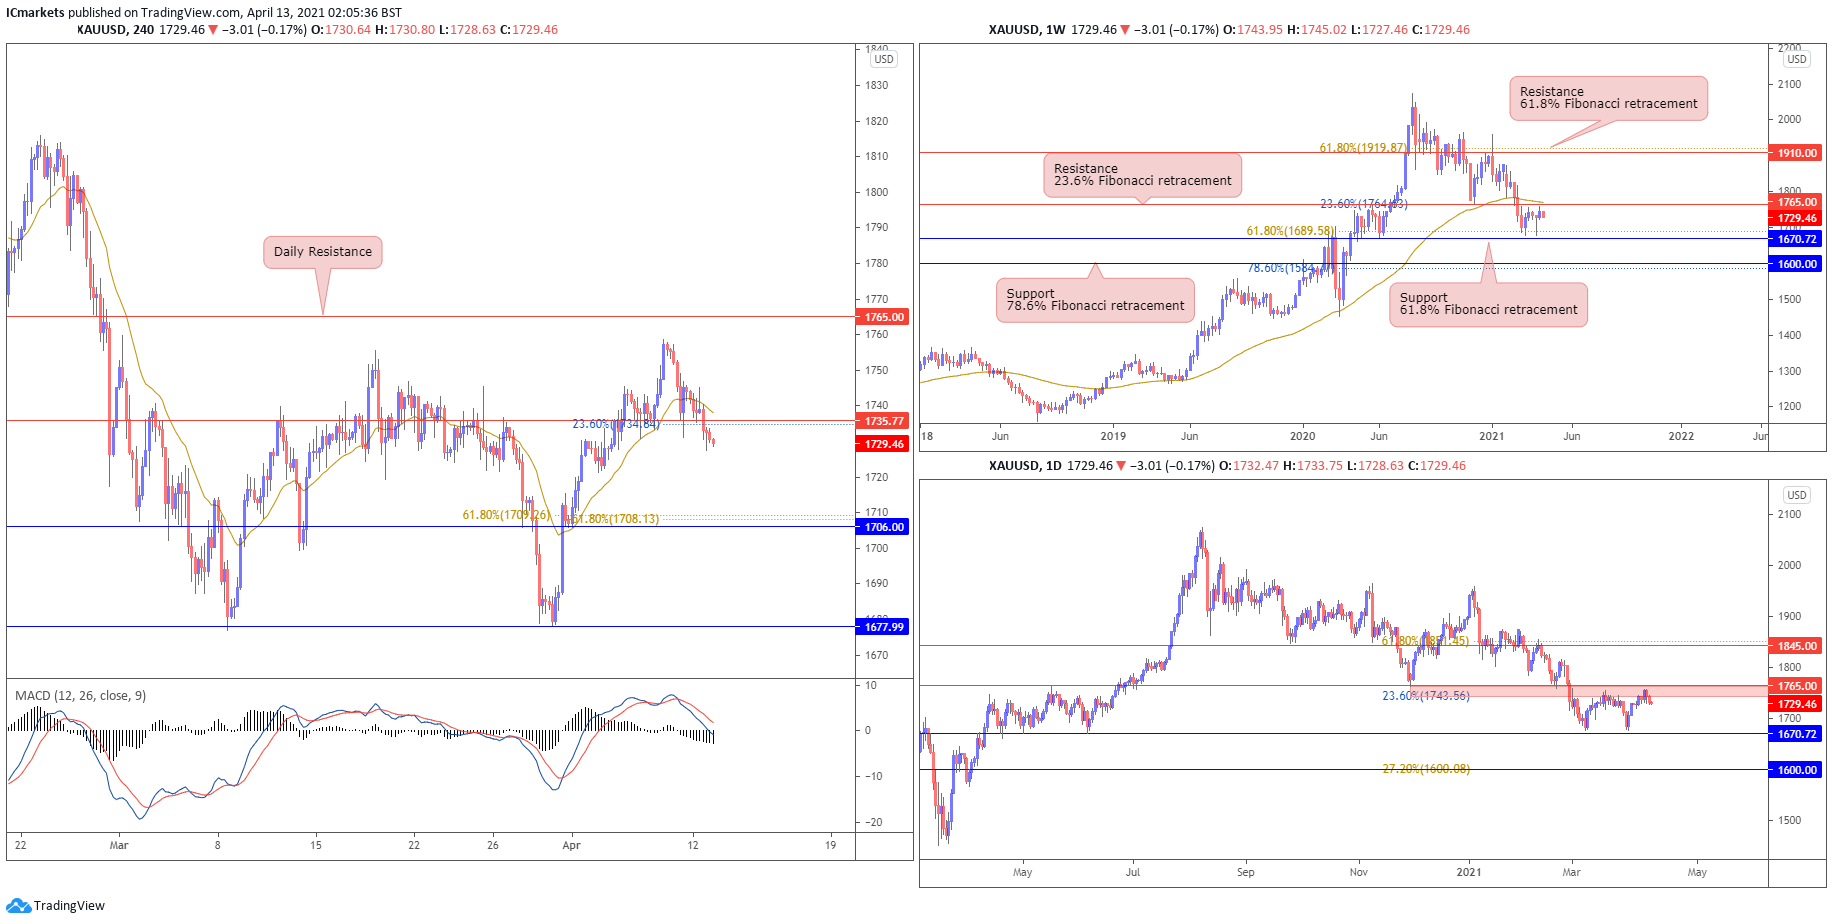
XAU/USD (GOLD):
On the weekly timeframe, gold is testing 1765 resistance. With price still holding below the long term moving average, a weekly close below this resistance will see a medium probability drop towards 1670 support. On the daily chart, price is pulling back below 1765 weekly resistance. We see a possibility where sellers in the neighbourhood could come in and add to their shorts. Otherwise, a break and close above 1765 resistance could see price swing towards 1845 resistance.
On the H4 timeframe, price dropped lower overnight. Technical indicators on the H4 now shows a build up of bearish momentum. Sellers could possibly add to their shorts on any bounce below 1735 resistance with a possible downside target at 1706 support. Otherwise failure to hold below 1735 should see price push higher towards daily resistance at 1765.
Areas of consideration:
- 1765 long term resistance to watch
- H4 technical indicators are now bearish
The accuracy, completeness and timeliness of the information contained on this site cannot be guaranteed. IC Markets does not warranty, guarantee or make any representations, or assume any liability regarding financial results based on the use of the information in the site.
News, views, opinions, recommendations and other information obtained from sources outside of www.icmarkets.com.au, used in this site are believed to be reliable, but we cannot guarantee their accuracy or completeness. All such information is subject to change at any time without notice. IC Markets assumes no responsibility for the content of any linked site.
The fact that such links may exist does not indicate approval or endorsement of any material contained on any linked site. IC Markets is not liable for any harm caused by the transmission, through accessing the services or information on this site, of a computer virus, or other computer code or programming device that might be used to access, delete, damage, disable, disrupt or otherwise impede in any manner, the operation of the site or of any user’s software, hardware, data or property.


