
Key risk events today:
Australia NAB Business Confidence; US CPI m/m and Core CPI m/m.
(Previous analysis as well as outside sources – italics).
EUR/USD:
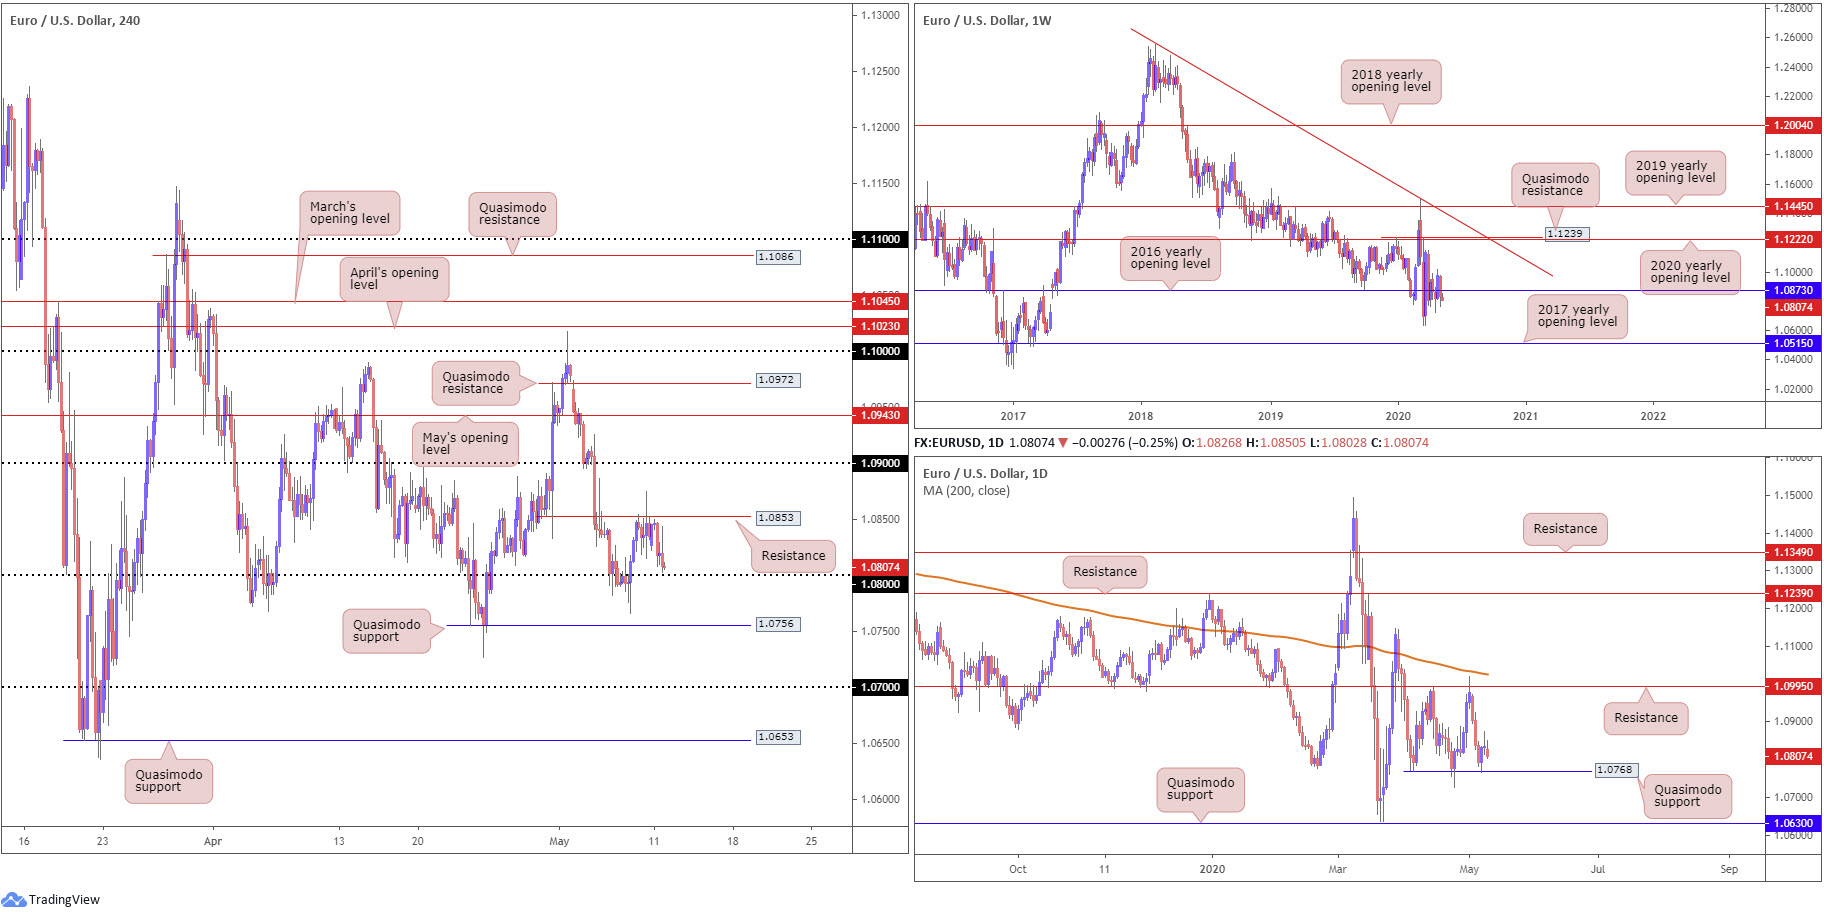
The US dollar index kicked off the week on strong footing, rallying more than 1.00% and reclaiming 100.00+ status. The single currency has been relatively resilient, though is seen nearing 1.08, based on the H4 timeframe.
H4 resistance at 1.0853, a prior Quasimodo support, remains a reasonably dominant fixture on the short-term charts. Thin air is seen beyond 1.08 until reaching Quasimodo support coming in at 1.0756, with a break exposing 1.07. Above 1.0853, on the other hand, we have 1.09 to look forward to.
Further afield, weekly price, as highlighted in Monday’s technical briefing, has traded around its 2016 yearly opening level at 1.0873 since April, offering a somewhat directionless tone at present. Overall, though, EUR/USD has been involved in a long-term downtrend since topping in early 2018. A nudge lower could see multi-year lows enter sight at 1.0635, while firming may eventually witness the 2020 yearly opening level at 1.1222 make a play.
A closer reading of price action on the daily timeframe reveals the unit holding north of Quasimodo support at 1.0768. Despite Monday’s modest decline, should buyers climb this week, resistance at 1.0995 is likely to be the first port of call, closely tailed by the 200-day SMA (orange – 1.1025).
Areas of consideration:
In terms of technical confluence, we’re somewhat lacking on the charts at the moment.
H4 Quasimodo support at 1.0756 is a potential contender today. Sell-stops sub 1.08 and also Thursday’s low at 1.0766 may be enough to tempt buyers into the market off the said support.
Failure to hold off 1.0756 would likely see breakout sellers push for 1.07. The fact we’re trading south of the 2016 yearly opening level at 1.0873 on the weekly timeframe may add weight here.
GBP/USD:
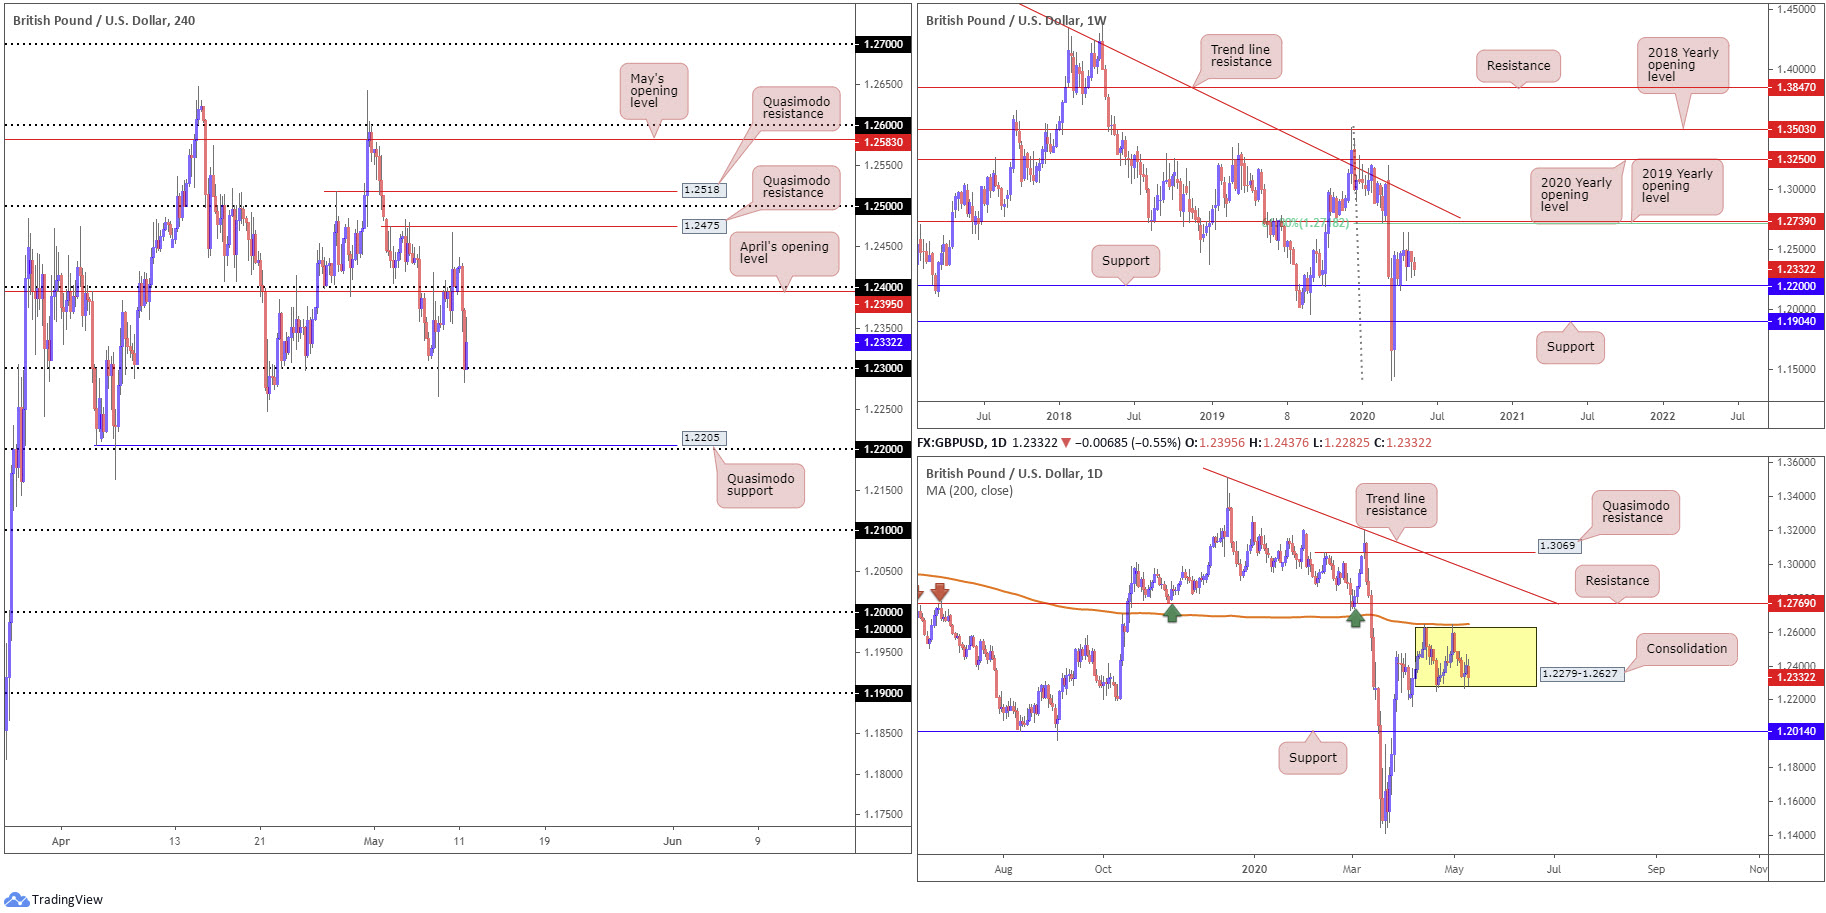
A combination of factors weighed on the British pound Monday, including a robust dollar bid that brought DXY north of the 100.00 handle, Brexit uncertainties and UK Prime Minister Boris Johnson’s calibrated approach to ending lockdown.
Technically, Monday tunnelled through orders at 1.24 and April’s opening level at 1.2395, settling the day off worst levels north of 1.23. H4 Quasimodo support at 1.2205, sited a handful of pips off 1.22, is next in line in the event we explore lower ground today. What’s also interesting is sell-stops likely lurking beneath last Thursday’s low at 1.2266 and also under the 1.2247 April 21 low. This may provide enough liquidity to rebound price off 1.22ish.
Meanwhile, on the weekly timeframe, support at 1.2200 offers a pivotal base, holding price action higher since the beginning of April. Scope to explore higher ground is visible until reaching the 2019 yearly opening level at 1.2739, which aligns closely with a 61.8% Fibonacci retracement ratio at 1.2718. A break of the aforementioned levels reveals a long-standing trend line resistance, taken from the high 1.5930. Additionally, we see the pair pulled back from historic lows at 1.1409 in March. Seeing as the pair has been trending south since April 2018, sellers could eventually make a run for fresh lows.
Following Thursday’s rebound off 1.2279ish, this formed the basis for a consolidation area between 1.2279-1.2627 (yellow) on the daily timeframe. Interestingly, the upper boundary of the aforesaid range is currently reinforced by the 200-day SMA (orange – 1.2648). Traders will also note external resistance sits at 1.2769 and support at 1.2014.
Areas of consideration:
Coming off daily range lows, upside could gain speed off 1.23 today. However, conservative traders will seek at least additional candlestick confirmation before committing as round numbers are prone to fakeouts.
Breaching 1.23 on the other hand will jolt buyers and perhaps fill breakout sellers’ orders, targeting 1.22. Not only is 1.22 a widely watched figure by and of itself, it comes together with a H4 Quasimodo support at 1.2205 and weekly support at 1.2200. Therefore, 1.22 serves as a downside target for breakout sellers sub 1.23 and also a platform for buying opportunities.
AUD/USD:
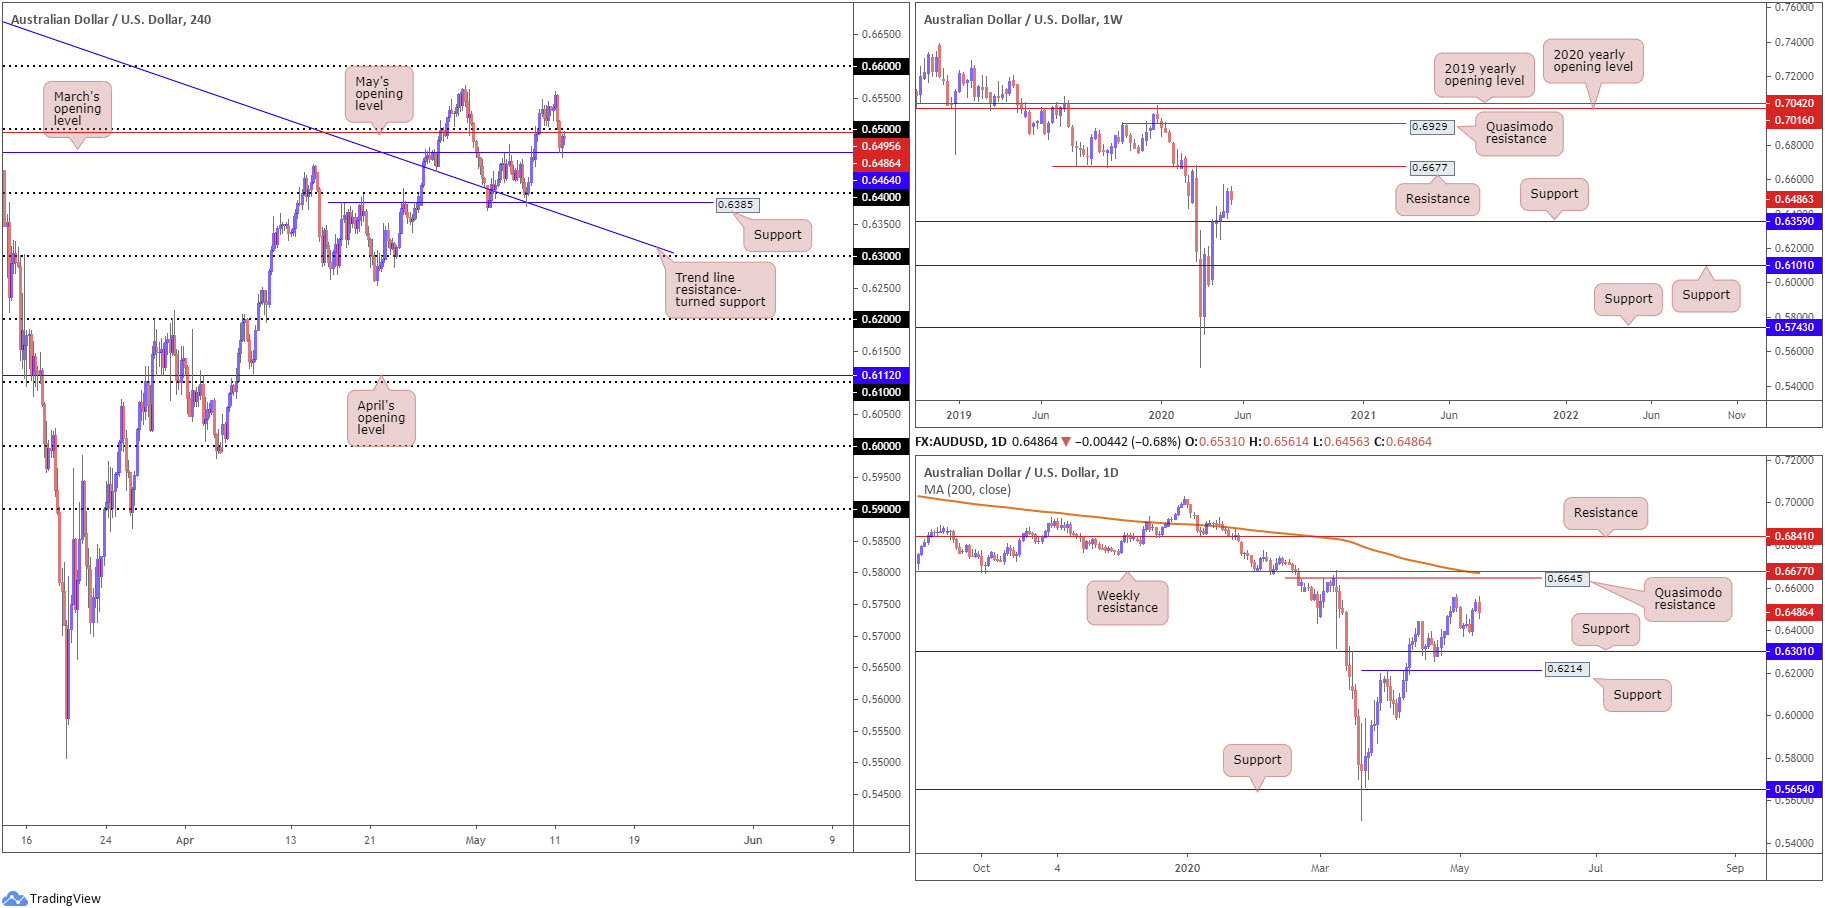
Demand for the greenback, coupled with deteriorating risk sentiment, weighed on the Australian dollar Monday, shedding 0.70%. Intraday movement glided through the 0.65 handle and May’s opening level at 0.6494 on the H4 timeframe, though managed to mount a modest recovery off March’s opening level plotted nearby at 0.6464.
A break of 0.6464, technically speaking, would likely further confirm downside to 0.64 and nearby support seen at 0.6385.
Across the page on the weekly timeframe, we can see the overall tone remains biased to the upside, recording its fifth consecutive weekly gain last week. Closing the week out shaped by a near-full-bodied bullish candle ahead of support at 0.6359, traders’ crosshairs are likely fixed on resistance at 0.6677 this week. Overall, however, longer-term traders will also note we have been trading lower since the start of 2018, therefore recognising that current upside from multi-year lows at 0.5506 could simply be a bulky pullback before pressing lower.
From the daily timeframe, local support is seen around 0.6370ish, with the possibility of the April 30 high at 0.6569 serving up resistance. Major resistance can be seen at a Quasimodo formation from 0.6645, parked just ahead of the weekly resistance level mentioned above at 0.6677 and a 200-day SMA (orange – 0.6670). Beneath 0.6370, 0.6301 is noted as possible support.
Areas of consideration:
For those who read Monday’s technical briefing you may recall the following piece (italics):
0.65, coupled with May’s opening level at 0.6494, could generate support in early trade this week, but a fakeout to March’s opening level at 0.6464 would not be a surprise.
As you can see, a fakeout to 0.6464 has indeed come about. A H4 close above 0.65 from here, therefore, may tempt buyers into the fold. Upside targets form at 0.6569, 0.66 and possibly to 0.6650ish, the daily Quasimodo resistance level.
Breaking through 0.6464, nevertheless, may trigger breakout selling to 0.64.
USD/JPY:
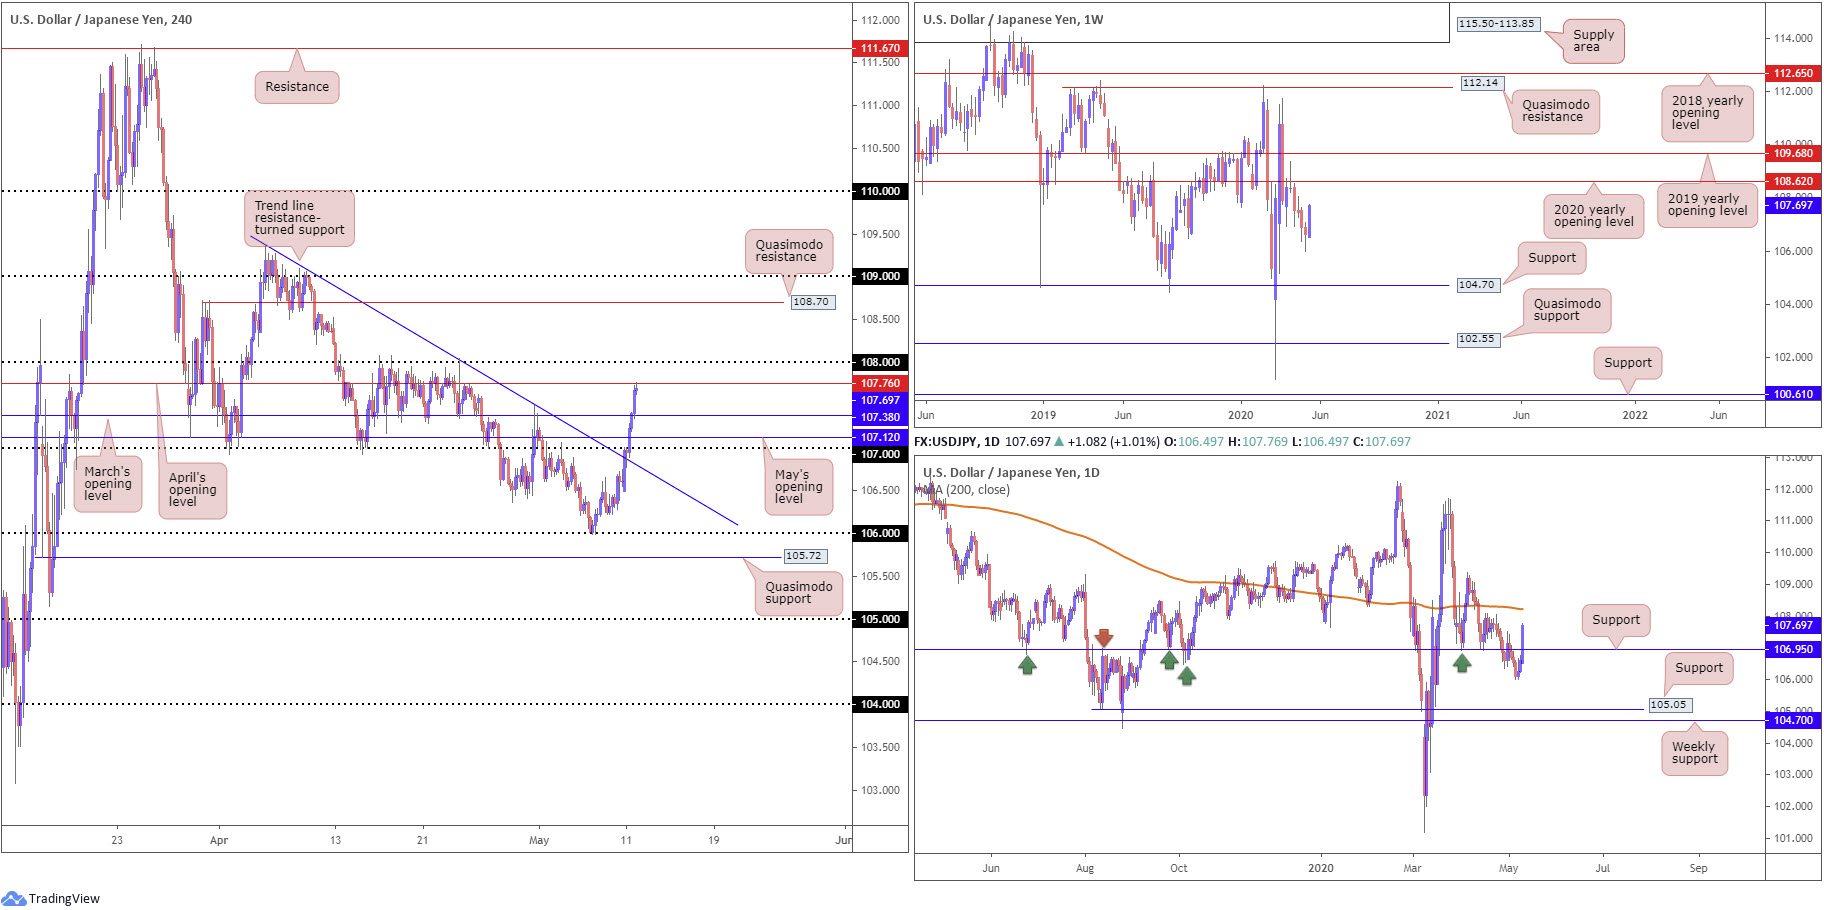
USD/JPY bulls entered a strong offensive phase Monday, gaining more than 1.00%.
According to the weekly timeframe, this has positioned the pair within close proximity of the 2020 yearly opening level at 108.62. The story on the daily timeframe saw price action take out resistance at 106.95 and rush to highs of 107.76, throwing the 200-day SMA (orange – 108.22) in the firing range.
Against the backdrop of higher-timeframe flow, we can see H4 action closing in on 108 after man handling 107 as well as May and March’s opening level at 107.12 and107.38, respectively. April’s opening level at 107.76 is all that stands in the way of price reaching 108 on the H4 scale. Breaking 108 to the upside potentially sets the stage for an approach to Quasimodo resistance at 108.70, and possibly 109.
Areas of consideration:
Before reaching 108, a pullback to March’s opening level at 107.38 on the H4 timeframe could be seen, which may be of interest to buyers.
108 as a resistance is interesting, joining closely with the 200-day SMA at 108.22. However, traders are also urged to pencil in the possibility of a move to the 2020 yearly opening level at 108.62. Conservative traders, therefore, will likely seek additional candlestick confirmation before pulling the trigger off 108.22/108. Alternatively, some may feel a H4 close back beneath 107.76 is sufficient to justify a short position, targeting 107.38 as the first port of call.
USD/CAD:
Monday had WTI prices modestly retreat from session highs at $26.70/bbl, weighing on the Canadian dollar. On top of this, we had the US dollar index firing on all cylinders, powering through 100.00 and reaching highs of 100.28.
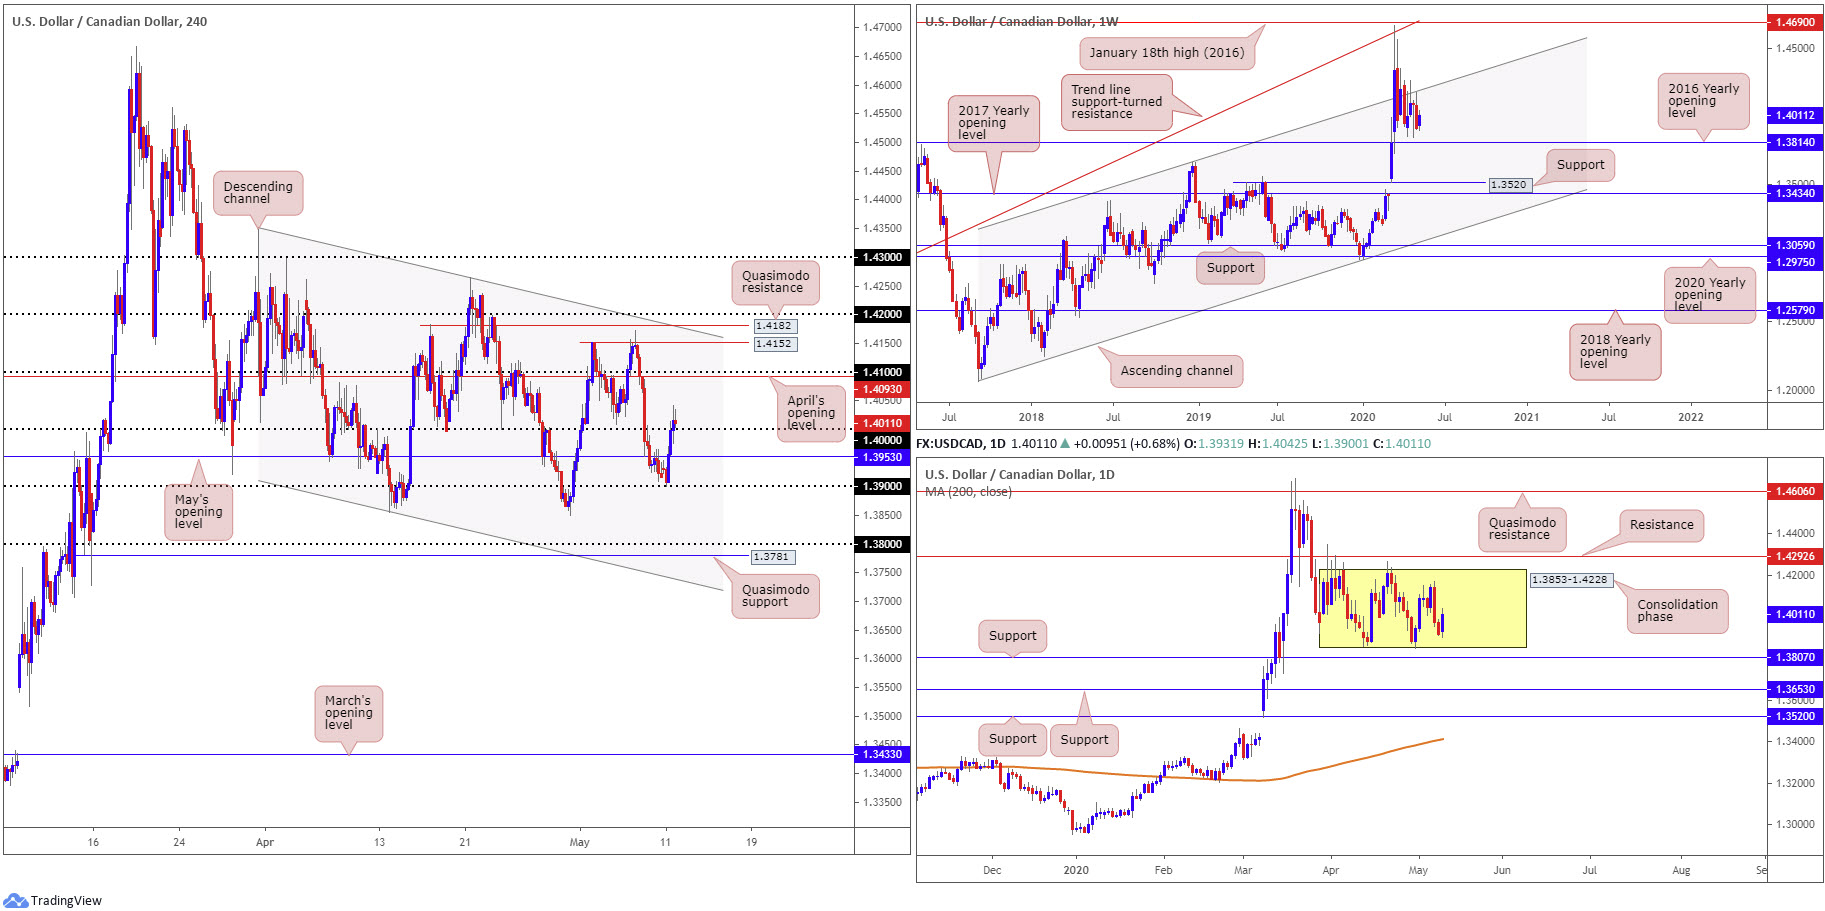
From the weekly timeframe, price structure remains pretty much unchanged. USD/CAD came within inches of clipping a long-term channel resistance, taken from the high 1.3661, last week, before collapsing to lows at 1.3908. Sellers, in the event of further selling, will face possible support off the 2016 yearly opening level at 1.3814. the said base stands in a reasonably healthy position, as overall we’ve been trending higher since September 2017.
Since kicking off April, we have been carving out a consolidation between 1.3853-1.4228 on the daily timeframe. Areas outside of this base can be found at resistance drawn from 1.4292 and support at 1.3807. The 200-day SMA (orange – 1.3411), as you can probably see, has been drifting northbound since March.
Following a to-the-pip retest at 1.39 Monday, price movement overthrew May’s opening level at 1.3953 and eventually toppled the key figure 1.40. To the upside, the next areas to keep an eye on fall in at April’s opening level from 1.4093 and the 1.41 handle. Interestingly, above here we also have two nearby Quasimodo resistances at 1.4152 and 1.4182 along with a channel resistance, taken from the high 1.4349.
Areas of consideration:
Breakout buyers are likely filled above 1.40, with the 1.41 neighbourhood firmly on the radar as an upside target. A move through 1.41 should not surprise, owing to the H4 Quasimodo resistances seen at 1.4152/1.4182 and channel resistance.
Traders may also find interest in the 1.42 level later in the week, should we advance, given its connection with the current weekly channel resistance.
USD/CHF:
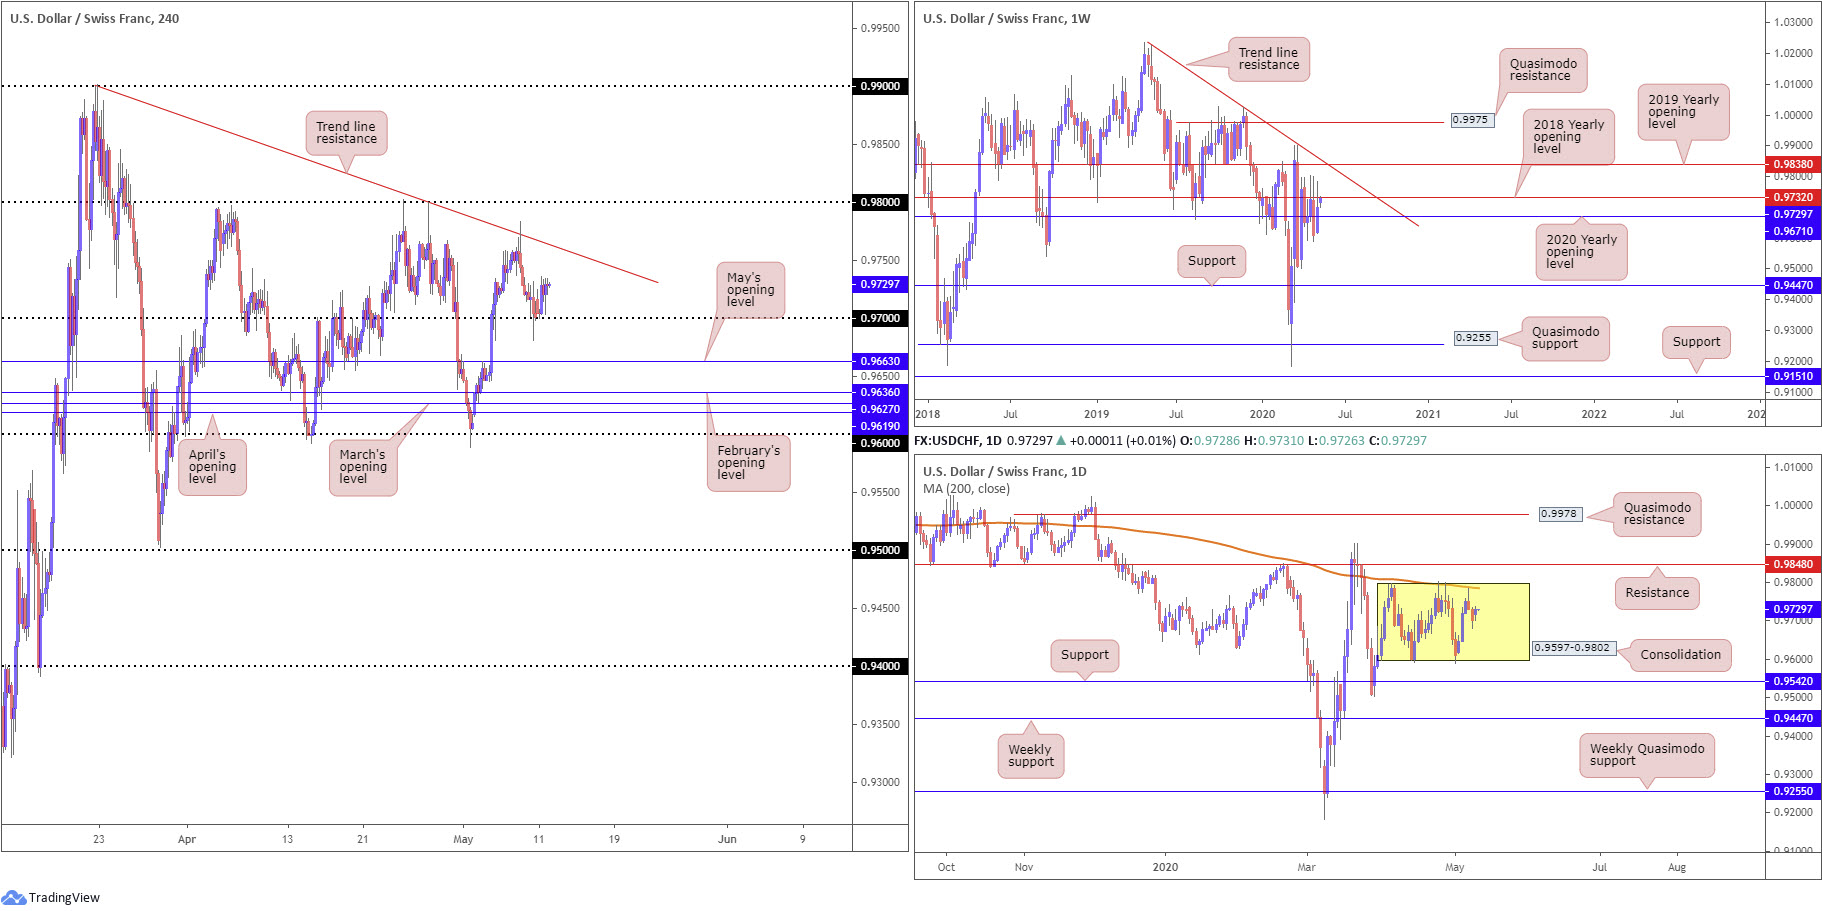
Likely fuelled on the back of broad-based USD bidding Monday, USD/CHF managed to maintain a modestly bullish position above 0.97. This could lead to a retest at trend line resistance, etched from the high 0.9900, today; a break higher would see 0.98 call for attention.
A H4 close beneath 0.97 reveals a relatively clear run to May’s opening level at 0.9663, followed by 0.9619/0.9636, an area made up of April, March and February’s opening levels.
Weekly action is seen retesting its 2018 yearly opening level at 0.9732. After failing to sustain gains beyond this level over recent weeks, traders are likely expecting the level to hold, perhaps forcing a retest at the 2020 yearly opening level from 0.9671, with a break throwing light on the possibility of a run to support coming in at 0.9447.
Price action on the daily timeframe continues to hover within the upper limits of a month-long range between 0.9597-0.9802. Note the 200-day SMA (orange – 0.9785) is also seen circling the upper edge of the said range. Outside of the consolidation, we see resistance at 0.9848 while support is found at 0.9542.
Areas of consideration:
Having noted weekly price gripping the underside of resistance at 0.9732, upside attempts off 0.97 on the H4 timeframe may fall flat. The flip side to this, of course, is daily price tests the upper boundary of its current range around 0.98 before rotating lower. A H4 close above the current H4 trend line resistance may prove enough to stimulate buyers to 0.98.
Moves to 0.98, a level which aligns with the upper boundary of the daily range at 0.9802 and the 200-day SMA, could see a show from sellers.
Dow Jones Industrial Average:
Major US equity indexes finished mixed Monday. The Dow Jones Industrial Average erased 109.33 points, or 0.45%; the S&P 500 closed flat, while the tech-heavy Nasdaq 100 concluded higher by 78.57 points, or 0.85%.
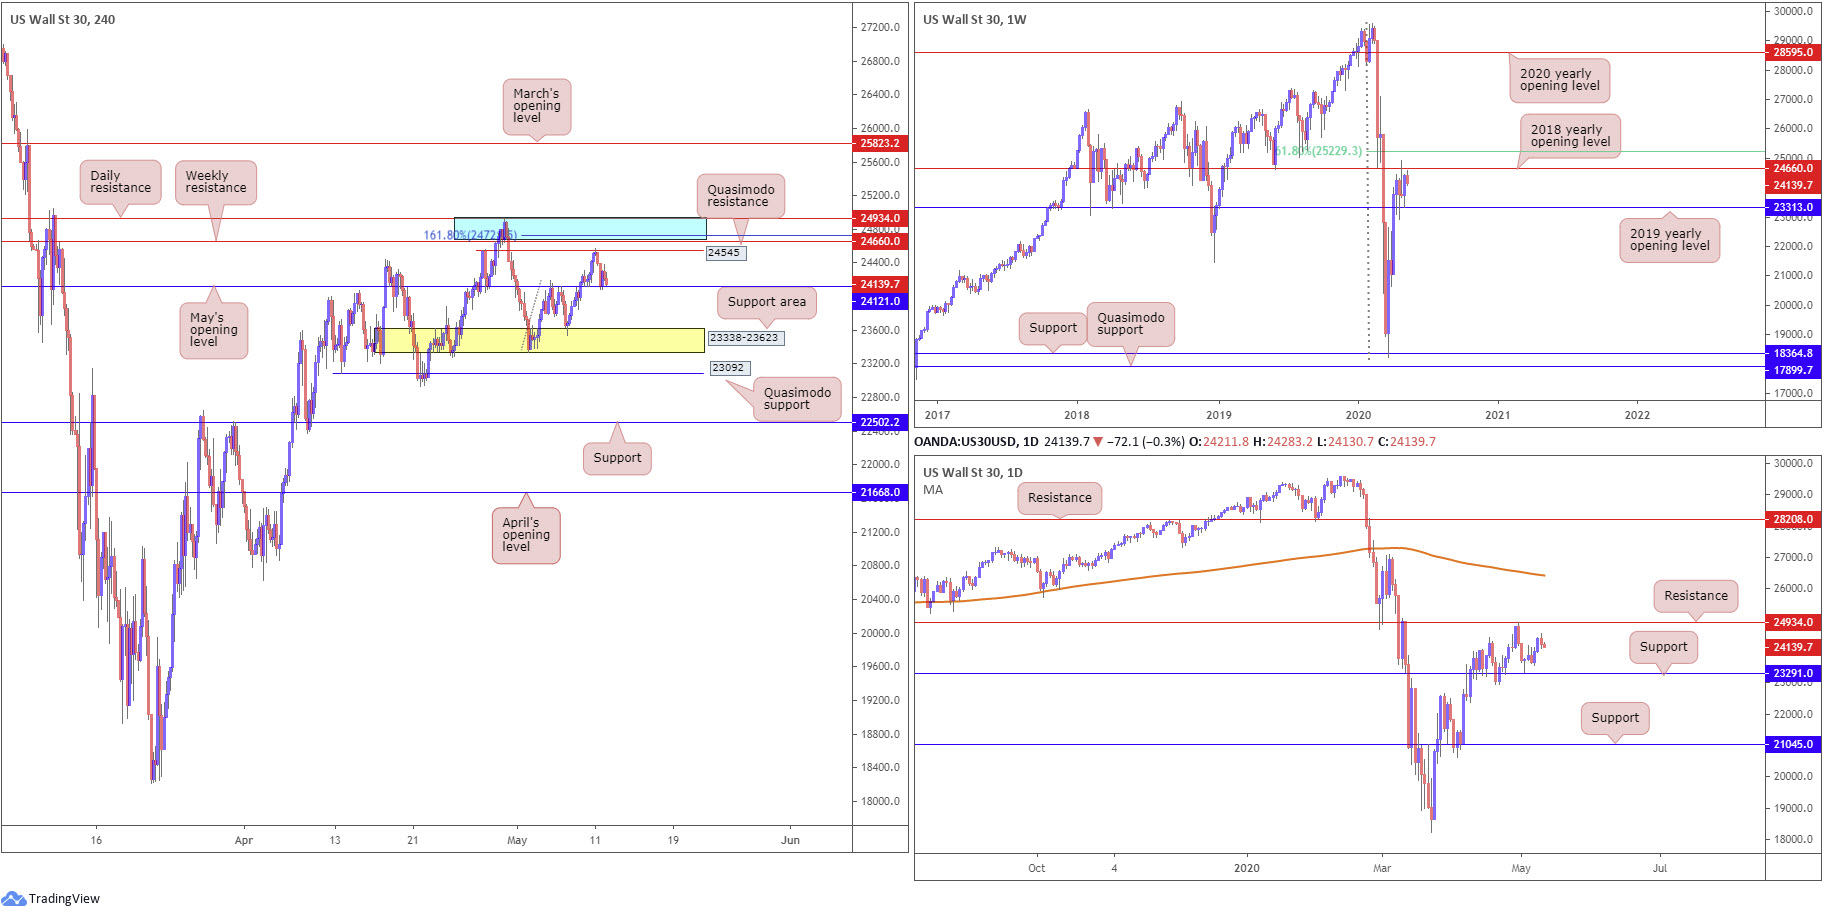
Technical action welcomed H4 Quasimodo resistance at 24545 into the fight on Monday, a level located just south of 24934/24660, which saw price action retreat to May’s opening level at 24121. 24934/24660 is an area (blue) marked on the H4 timeframe made up of daily resistance at 24934 and weekly resistance at 24660 (the 2018 yearly opening level). Additionally, the area also holds a 161.8% Fibonacci extension point at 24721.
Across the page on the weekly timeframe, we can see price remains sandwiched between the 2019 yearly opening level at 23313 and the 2018 yearly opening level mentioned above at 24660, followed by a 61.8% Fibonacci retracement ratio at 25229. Breaking through 25229 potentially sets the stage for moves towards the 2020 yearly opening level at 28595; a violation of 23313, on the other hand, shines light on support from 18364. In terms of the daily timeframe, support can be found at 23291, while resistance is seen at 24934.
Areas of consideration:
Sustained selling today could overwhelm buyers at May’s opening level from 24121 on the H4 timeframe and clear the pathway south to a support area drawn from 23338-23623. This could unlock the door for bearish scenarios.
A rotation back to the upside off 24121, however, places 24934/24660 back in the firing range, an area that has the potential to hamper upside and provide sellers a platform. Conservative sellers may seek candlestick confirmation before committing; yet, aggressive traders may enter at 24660 with protective stop-loss orders tucked above 24934.
XAU/USD (GOLD):
Bullion tumbled for a second consecutive session Monday amid broad USD strength.
From a technical perspective, yesterday’s sell-off has had little effect on higher-timeframe structure. In fact, it remains pretty much unchanged from Monday’s technical briefing:
Weekly timeframe:
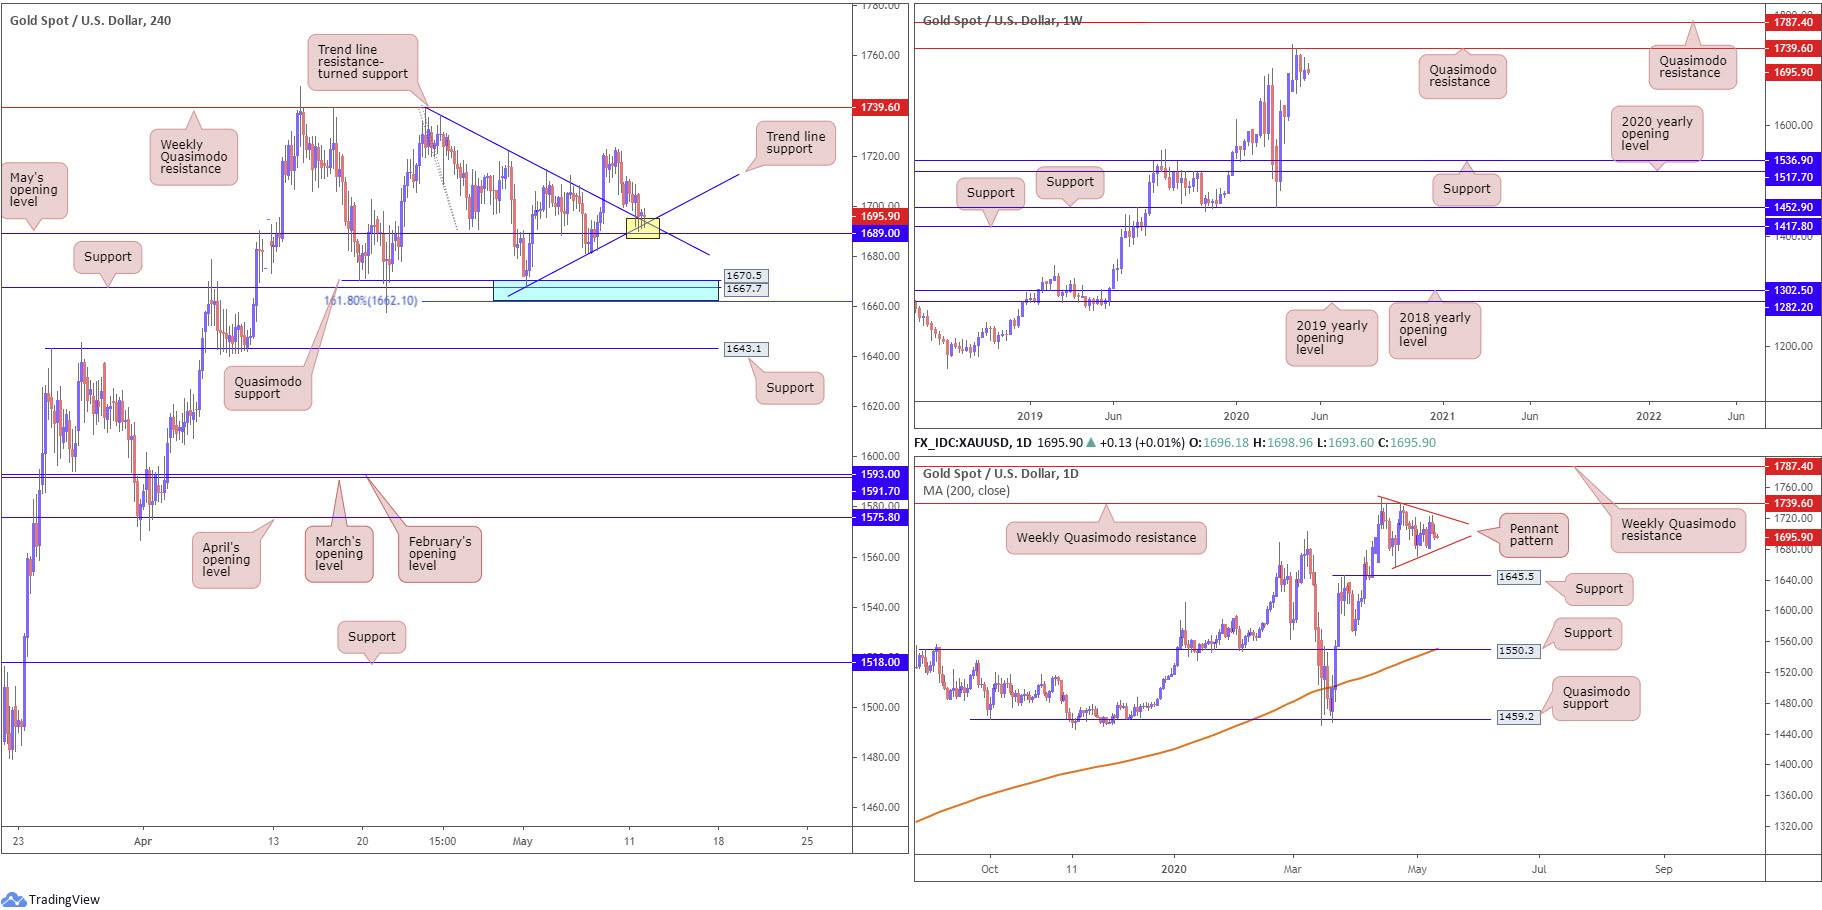
Buyers and sellers continue to square off around the underside of Quasimodo resistance at 1739.6. Downside from this region echoes the prospect of eventually reaching support at 1536.9, while a breach of 1739.6 shifts focus towards another layer of Quasimodo resistance at 1787.4. It may also interest some traders to note the primary trend on gold has faced a northerly trajectory since 2016.
Daily timeframe:
In similar fashion to the weekly timeframe, the weekly Quasimodo formation at 1739.6 is also posted as prominent resistance on the daily chart. The difference can be seen with reference to supports: the next support target on the daily timeframe falls in at 1645.5. Pattern traders may also acknowledge a forming pennant pattern at the underside of the weekly Quasimodo base, established from a high of 1747.7 and a low of 1658.1.
H4 timeframe:
From the H4 timeframe, we recently shook hands with two merging trend line supports (1739.1/1668.0), sited just north of May’s opening level at 1689.0 (yellow).
South of here, traders may recognise familiar support (blue), comprised of a 161.8% Fibonacci extension point at 1662.1, support at 1667.7 and Quasimodo support at 1670.5.
Areas of consideration:
The area of confluence on the H4 timeframe around May’s opening level at 1689.0 offers intraday traders an area of confluence to work with today. Failure to hold here will likely trigger breakout selling towards 1662.1-1670.5 (blue), which is another potential reversal zone buyers may have noted.
Printing a H4 close above 1739.6 will see longer-term breakout buyers make a show, perhaps taking aim at weekly Quasimodo resistance from 1787.4 as an initial target. This would also likely seal a daily close above the upper boundary of the current daily pennant pattern, adding fuel to any upside.
The accuracy, completeness and timeliness of the information contained on this site cannot be guaranteed. IC Markets does not warranty, guarantee or make any representations, or assume any liability regarding financial results based on the use of the information in the site.
News, views, opinions, recommendations and other information obtained from sources outside of www.icmarkets.com.au, used in this site are believed to be reliable, but we cannot guarantee their accuracy or completeness. All such information is subject to change at any time without notice. IC Markets assumes no responsibility for the content of any linked site.
The fact that such links may exist does not indicate approval or endorsement of any material contained on any linked site. IC Markets is not liable for any harm caused by the transmission, through accessing the services or information on this site, of a computer virus, or other computer code or programming device that might be used to access, delete, damage, disable, disrupt or otherwise impede in any manner, the operation of the site or of any user’s software, hardware, data or property.


