
A note on lower timeframe confirming price action…
Waiting for lower timeframe confirmation is our main tool to confirm strength within higher timeframe zones, and has really been the key to our trading success. It takes a little time to understand the subtle nuances, however, as each trade is never the same, but once you master the rhythm so to speak, you will be saved from countless unnecessary losing trades. The following is a list of what we look for:
- A break/retest of supply or demand dependent on which way you’re trading.
- A trendline break/retest.
- Buying/selling tails – essentially we look for a cluster of very obvious spikes off of lower timeframe support and resistance levels within the higher timeframe zone.
- Candlestick patterns. We tend to only stick with pin bars and engulfing bars as these have proven to be the most effective.
For us, lower timeframe confirmation starts on the M15 and finishes up on the H1, since most of our higher timeframe areas begin with the H4.
EUR/USD:
Following Sunday’s open 1.0915 price aggressively pierced above H4 resistance seen at 1.0946-1.0931, reaching highs of 1.0969 before collapsing for the remainder of the day. Psychological support 1.0900 was taken out and quickly retested as resistance before the single currency headed lower to test bids at mid-level support 1.0850.
Given the above movement, a huge round of stops was likely consumed above the aforementioned H4 resistance zone. As a result, should price visit this area again today, the path north is potentially clear up to the H4 Quasimodo level at 1.0984. This, right now, is the only number we’d be comfortable shorting from in this market. Not only does daily supply at 1.0992-1.0951 encapsulate this level, but it also blends beautifully with the 78.6% Fibonacci barrier. In addition to our original analysis posted yesterday, we’ve also now added in the large psychological resistance 1.1000 to the sell zone. Therefore, our pending sell order at 1.0983 remains the same, but our stop has been widened to above 1.1000 at 1.1010.
To the downside, nevertheless, we have our eye on daily support at 1.0813 for longs today. This number boasts both a 61.8% Fibonacci level at 1.0808 and psychological support coming in at 1.0800. Dependent on the time of day and the H4 approach to this zone, we would consider entering long from here at market.
Right now you may be thinking why not look at trading 1.0900 and 1.0850? Well, in our book, these levels are considered mid-range since both do not merge with higher timeframe areas, hence favoring the outer zones.

Levels to watch/live orders:
- Buys: 1.0813 [Possible enter at market here] (Stop loss: 1.0795).
- Sells: 1.0983 [Pending order] (Stop loss: 1.1010).
GBP/USD:
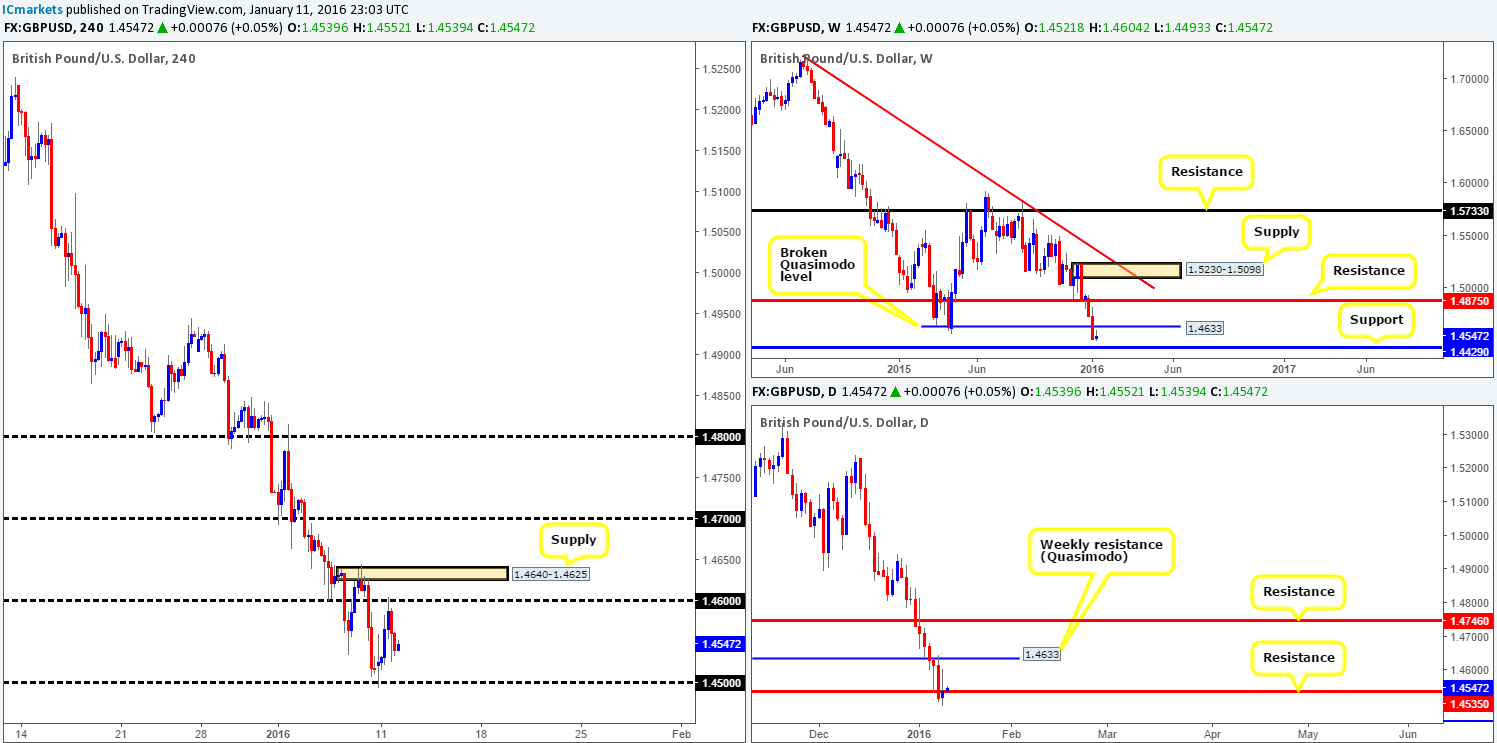
During the course of yesterday’s sessions, Cable rallied from the psychological boundary 1.4500 up to 1.4600, where price was offered, consequently trimming intraday gains considerably into the close 1.4539.
In view of this recent action and the clear downtrend this pair is in right now, we’re looking at the following:
- Firstly, from current prices, we may see 1.4500 tested once again, and, just like in our previous report, we’re looking for this number to break and be retested as resistance. The reason for why is both the weekly Quasimodo support at 1.4633 and the daily support (now resistance) at 1.4530 were taken out, potentially setting the stage for further downside this week to support fixed at 1.4429. Therefore, a break below and retest of 1.4500 would, in effect, be our cue to begin looking for lower timeframe sell entries into this market, targeting mid-level support 1.4450, followed closely by weekly support mentioned above at 1.4429. Ultimately, our plan would consist of closing our full position here due to this weekly barrier being rather significant, which could see prices consolidate or even reverse.
- Secondly, it is possible weekly action may rally to retest the underside of the recently broken Quasimodo line at 1.4633, which, by looking at the H4, you’ll see is encapsulated by a supply drawn from 1.4640-1.4625. Ideally, a nice fake above 1.4600 into this supply would be our cue to begin looking to short this market.
Levels to watch/live orders:
- Buys: Flat (Stop loss: N/A).
- Sells: Watch for bids to be consumed around 1.4500 and look to trade any retest seen thereafter (lower timeframe confirmation required). 1.4640-1.4625 [Tentative – confirmation required] (Stop loss: dependent on where one confirms this area).
AUD/USD:
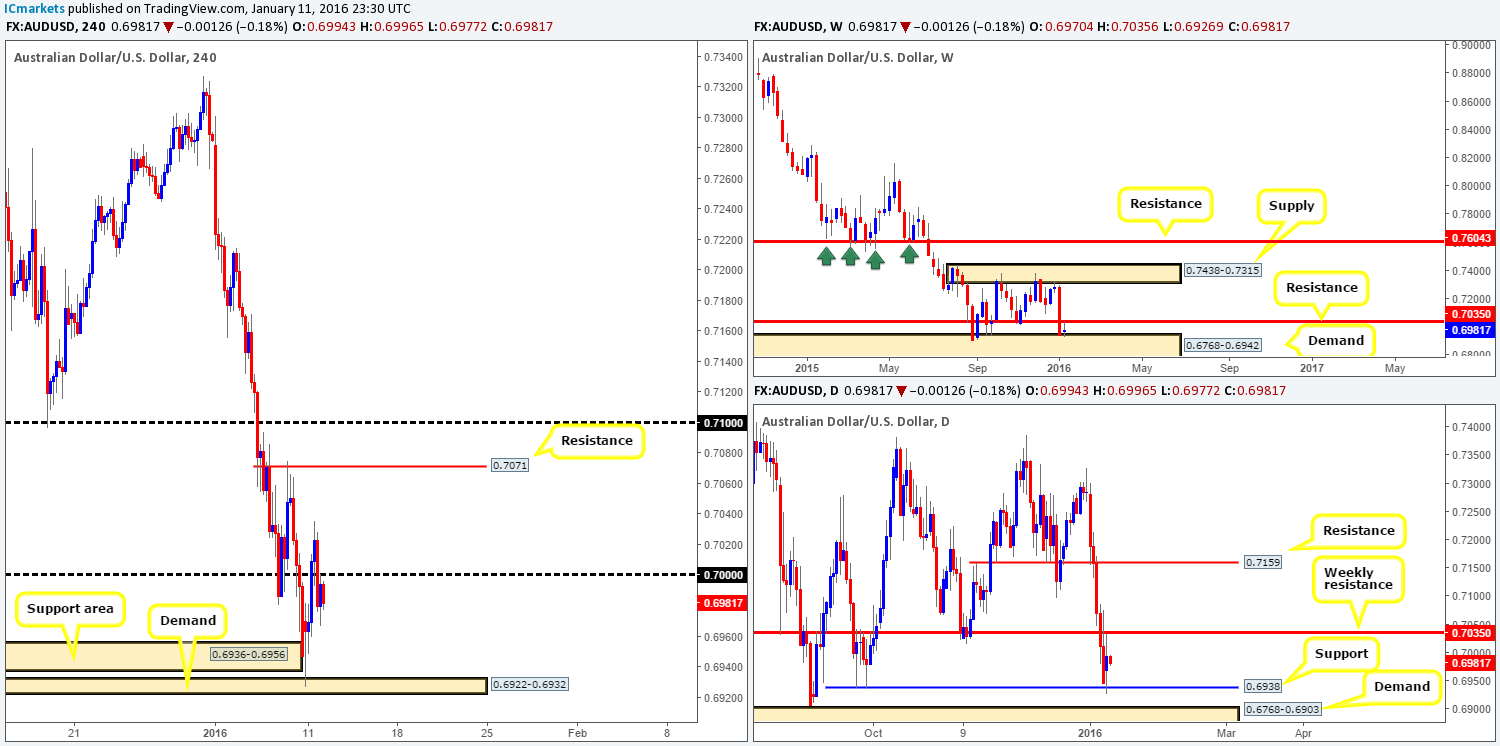
Beginning our analysis with a look at the weekly chart this morning, we can see that the commodity currency has recently shook hands with demand penciled in at 0.6768-0.6942. As bullish as this looks, the buyers have their work cut out for them here since there is immediate resistance at 0.7035 to contend with (seen clearer on the daily picture).
Zooming in lower, we can actually see that daily action bounced beautifully from support at 0.6938 yesterday, and is for the time being holding firm. Nevertheless, as we mentioned above, price hit offers around weekly resistance so further buying is questionable.
Moving down a step lower to the H4, price stabbed through the H4 support area at 0.6936-0.6956 and bounced from a small H4 demand at 0.6922-0.6932 in the early hours of opening trade. The rally from this boundary saw price whipsaw through the large psychological resistance 0.7000, which ended with the market closing the day out at 0.6994. For those who read our previous report (http://www.icmarkets.com/blog/monday-11th-january-weekly-technical-outlook-and-review/), you may recall us mentioning to keep a close eye on the above barriers for confirmed longs. Unfortunately, we were unable to find an entry here, well done to any of our readers who did though.
At this point in time, we do not see any immediate opportunity that takes our fancy. With that being said, however, since price has rebounded from weekly resistance (see above), we could see further selling amid today’s trade. Assuming that the small H4 demand is consumed, we can be pretty confident price is on its way to touching gloves with psychological support 0.6900, and at the same time, the top-side of daily demand at 0.6768-0.6903. This could, seeing as price is trading at weekly demand (see above), be a nice zone to have noted on your watch lists for possible longs into the market.
Levels to watch/live orders:
- Buys: Flat (Stop loss: N/A).
- Sells: Flat (Stop loss: N/A).
USD/JPY:
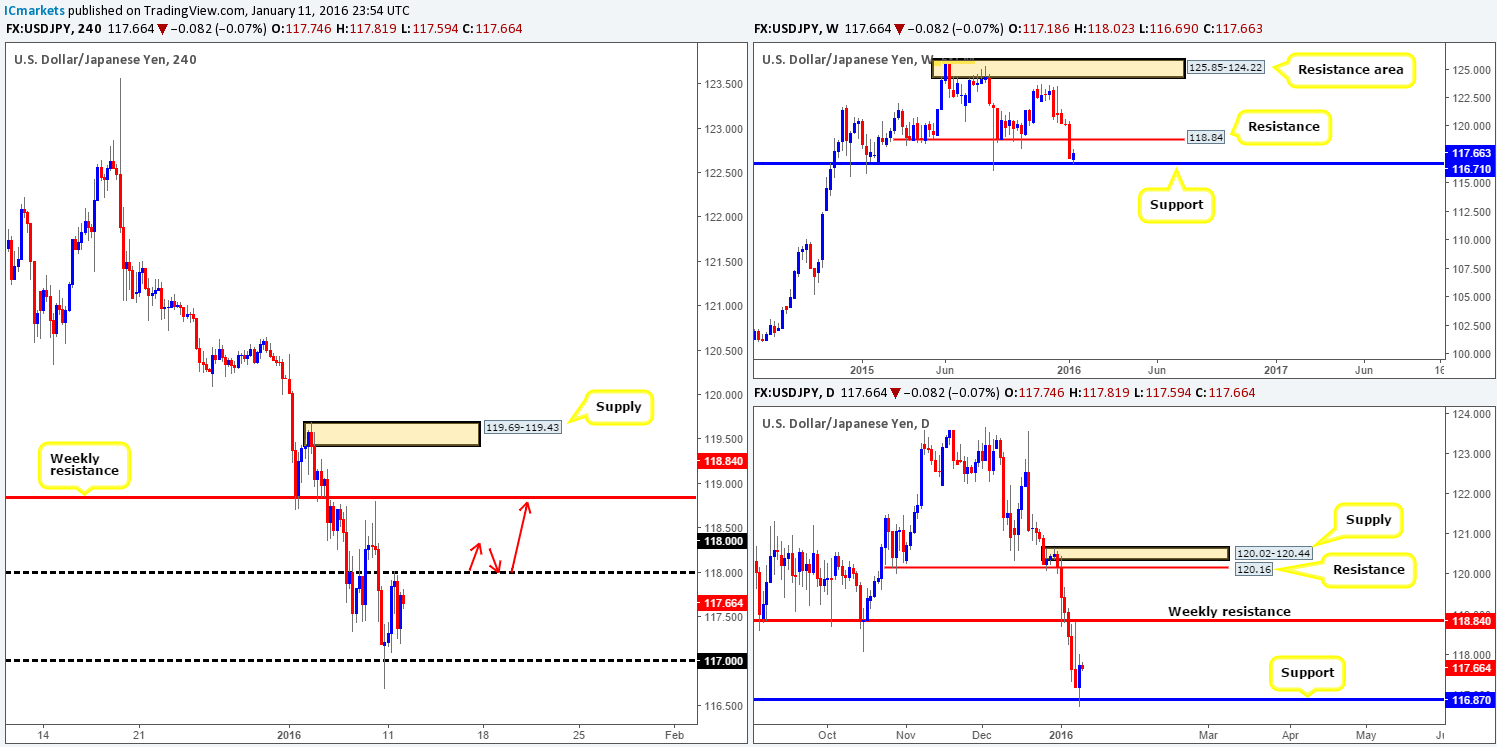
In our previous report (http://www.icmarkets.com/blog/monday-11th-january-weekly-technical-outlook-and-review/), we noted to watch for confirmed buys around the psychological support 117.00, due to both weekly support at 116.71 and daily support at 116.87 located nearby. As we can all see, price reacted nicely from 117.00 and rallied to connect with psychological resistance 118.00, before pulling back to lows of 117.19 by the day’s end. Well done to any of our readers who managed to lock in some green pips from this 100-pip move.
With there being little resistance seen overhead on the higher-timeframe picture until 118.84, there appears room for this market to appreciate further today. Despite this, we mustn’t forget that 118.00 on the H4 is seen holding this market lower right now. This makes our analysis relatively simple. Either price breaks above 118.00 and retests it as support to enter long, or price continues to trade lower and we remain flat. In the event the former takes place, we’ll be looking to close the full position out around the weekly resistance level at 118.84.
Levels to watch/live orders:
- Buys: Watch for offers to be consumed around 118.00 and look to trade the retest thereafter (lower timeframe confirmation preferred).
- Sells: Flat (Stop loss: N/A).
USD/CAD:
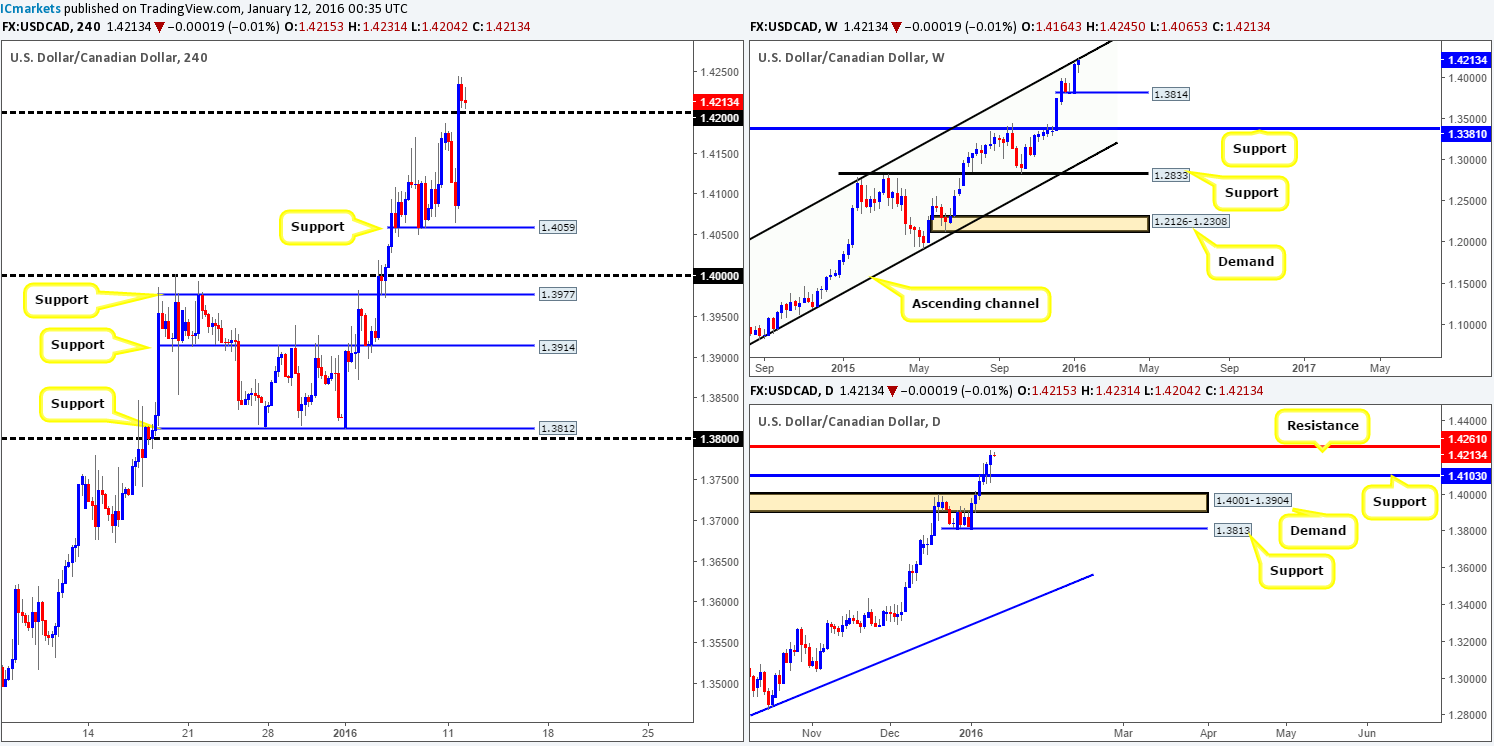
This morning’s analysis will kick-off with a look at the weekly timeframe, which shows price testing the upper channel resistance band extended from the high 1.1173. Alongside this, down on the daily timeframe, price recently retested support at 1.4103 and bounced higher, consequently placing the Loonie within shouting distance of resistance at 1.4261.
From the H4 chart, we can see that price dropped to lows of 1.4065 (six pips from support at 1.4059) going into the U.S. open, before the pair catapulted itself above psychological resistance 1.4200 in one fell swoop! In our previous report (http://www.icmarkets.com/blog/monday-11th-january-weekly-technical-outlook-and-review/), we mentioned to keep an eye out for longs around the 1.4100 region. Unfortunately, price moved too fast here for a setup to form.
Given the recent movement this pair has seen, here’s what we have jotted down for today’s upcoming sessions:
- Although price on the weekly chart is trading from a resistance structure right now, trading long on a retest of 1.4200 (with confirmation) is still a possibility today in our opinion due to the strength of the underlying trend. However, should we manage to locate a setup to long from 1.4200, 80% of the position would be liquidated at the aforementioned daily resistance line and our stop moved to breakeven…
- Should the above come to fruition, however, and a lower timeframe sell setup is seen at the daily resistance, we would likely close out any longs we have and look to short. We know the USD/CAD has done very little but advance lately, but that does not mean we cannot short the retracements when trading at clear higher timeframe converging resistance points.
Levels to watch/live orders:
- Buys: 1.4200 [Tentative – confirmation required] (Stop loss: dependent on where one confirms this level).
- Sells: 1.4261 [Tentative – confirmation required] (Stop loss: dependent on where one confirms this level).
USD/CHF:
Sunday’s open 0.9940 began with a quick sell-off in the market dragging price to lows of 0.9879, before changing tracks and advancing above 1.0000 (parity) by the close 1.0012. With price trading above such a large number, and there being little resistance seen overhead (check out the supply consumption wicks marked with black arrows at 1.0052/1.0076), further buying is a strong possibility in today’s sessions.
Adding extra weight to additional upside today is the fact that yesterday’s rally was bolstered by not only a weekly support area at 0.9796-0.9902, but also a daily demand area drawn from 0.9851-0.9926.
With the above points taken into consideration, today’s spotlight will firmly be focused on 1.0000. Ultimately, we’re looking for price action to retest this boundary and shortly after produce a lower timeframe buy setup to enter the market. Should this come to fruition, the full position will be liquidated around 1.0100, since this number combined with daily resistance at 1.0123 and a 61.8% Fibonacci level at 1.0120 could be enough to repel the market.
Seeing as this is quite a hefty structure, shorting from here alongside lower timeframe confirming price action is also another possibility today. The reason for requiring confirmation here with all this confluence simply comes from the possibility that weekly price may fake above this level to connect with offers at a faked supply coming in at 1.0239-1.0131.
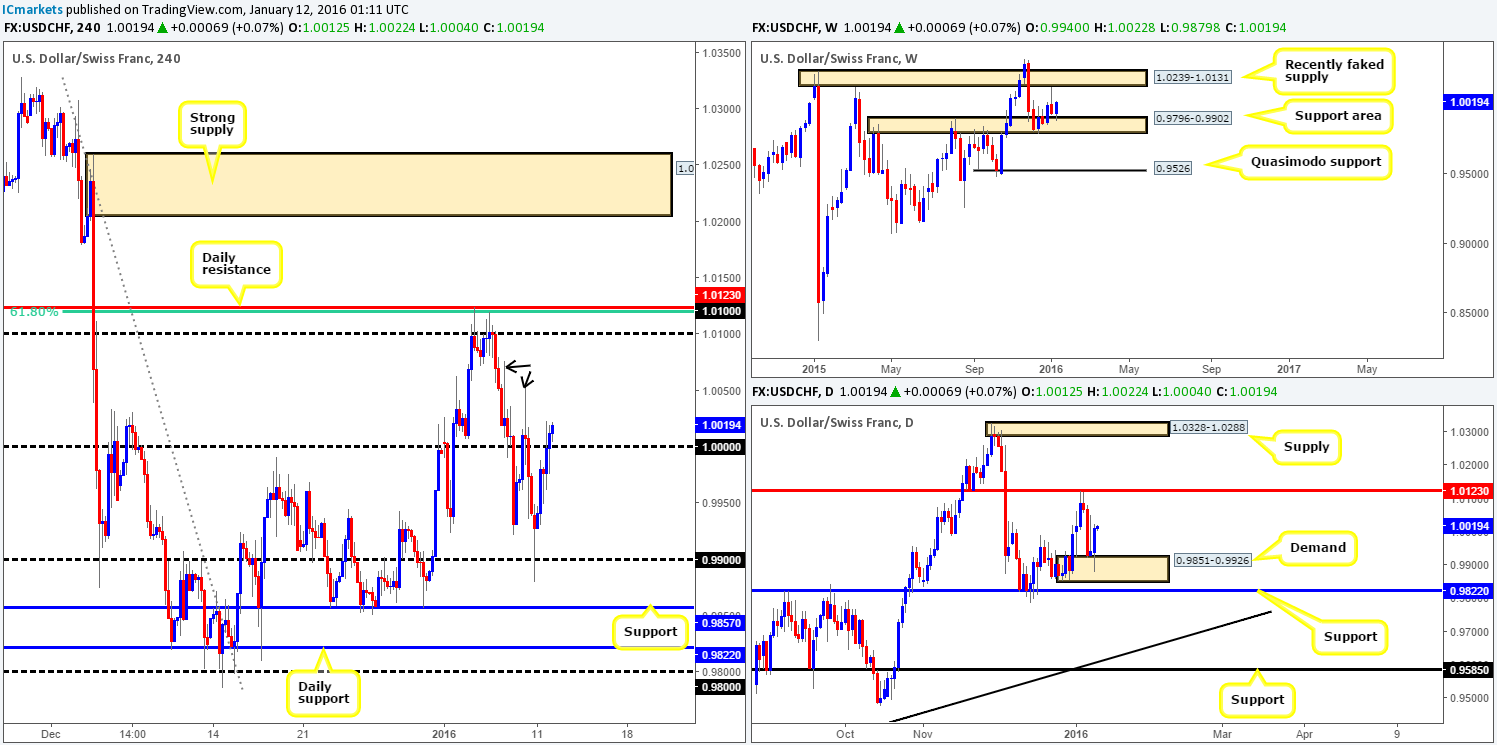
Levels to watch/live orders:
- Buys: 1.0000 [Tentative – confirmation required] (Stop loss: dependent on where one confirms this level).
- Sells: 1.0100/1.0123 [Tentative – confirmation required] (Stop loss: dependent on where one confirms this area).
DOW 30:
As the markets entered into the London session yesterday, price was seen retesting a recently broken demand (now supply) at 16426-16472. Selling interest is clearly present here as price already attempted to drive lower reaching lows of 16231. This was (and still is) an area our team is interested to sell from, but pulling the trigger without any supporting lower timeframe confirmation is not something we’d be comfortable with at this point.
In addition to price trading at a H4 sell zone, weekly action shows room to continue driving lower to support penciled in at 15978. Meanwhile, down on the daily chart, the next downside target to be aware of on this timeframe falls in around 15902-16083 – a clear area of support. Therefore, as far as we’re concerned all three timeframes are pointing south.
To that end, we’ve opted to stick with our original analysis and continue to look for confirmed shorts from the current H4 supply. Regarding targets, we really only have one in mind at present and that is H4 support at 16036, which sits within the daily support base mentioned above.
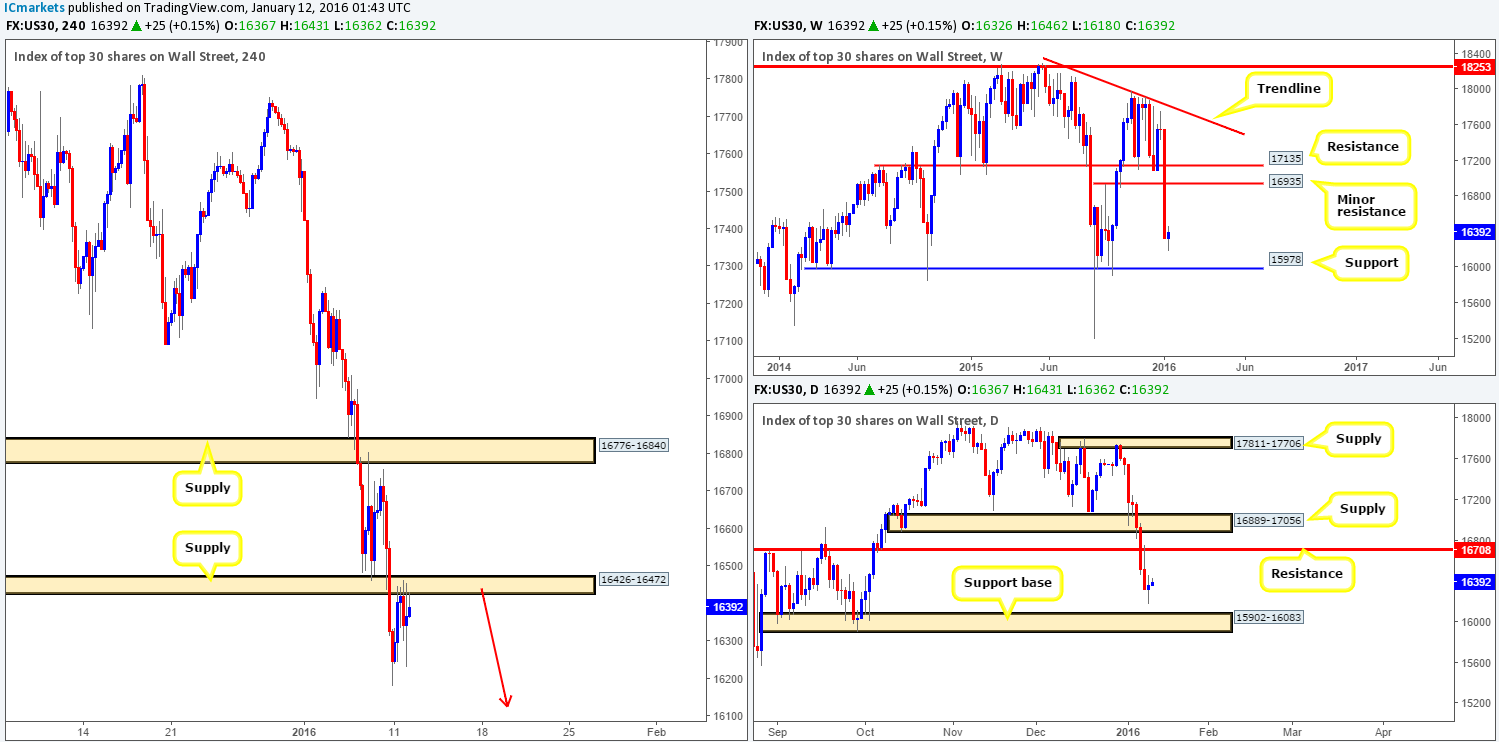
Levels to watch/live orders:
- Buys: Flat (Stop loss: N/A).
- Sells: 16426-16472 [Tentative – confirmation required] (Stop loss: dependent on where one confirms this area).
XAU/USD: (Gold)
Early on in yesterday’s sessions, the yellow metal came under pressure as price was offered from H4 supply at 1110.3-1108.0. This, as you can see, forced Gold below the H4 broken Quasimodo line at 1095.6 into the close 1093.8, which is, as we write, being retested as resistance. Should this barrier hold firm today and print a lower timeframe sell signal, would we consider this a valid opportunity to short this market?
From a technical standpoint, this market does indeed appear ready to decline further today. Weekly action is currently trading from supply at 1098.6-1121.7, and the fakeout above daily supply at 1098.6-1108.6 seen on Friday followed through with a nice sell-off on Monday. On top of that, there’s room on both higher timeframe charts to drive lower – the closest structure seen is support on the daily timeframe penciled in at 1084.5.
Therefore, with the above points in mind, our prime focus today will on looking for lower timeframe shorts around 1095.6, targeting 1084.5.
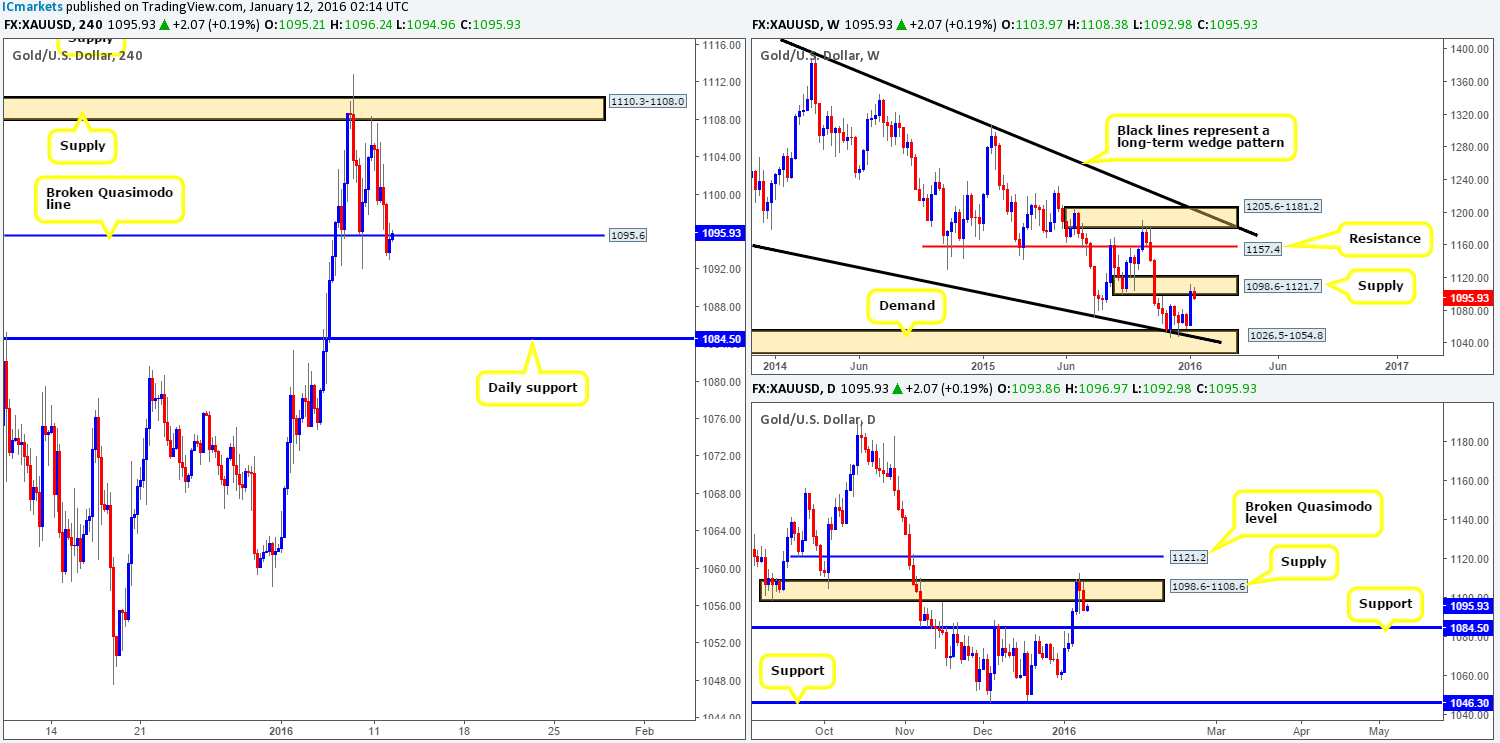
Levels to watch/live orders:
- Buys: Flat (Stop loss: N/A).
- Sells: 1095.6 [Tentative – confirmation required] (Stop loss: dependent on where one confirms this level).


