A note on lower timeframe confirming price action…
Waiting for lower timeframe confirmation is our main tool to confirm strength within higher timeframe zones, and has really been the key to our trading success. It takes a little time to understand the subtle nuances, however, as each trade is never the same, but once you master the rhythm so to speak, you will be saved from countless unnecessary losing trades. The following is a list of what we look for:
- A break/retest of supply or demand dependent on which way you’re trading.
- A trendline break/retest.
- Buying/selling tails – essentially we look for a cluster of very obvious spikes off of lower timeframe support and resistance levels within the higher timeframe zone.
- Candlestick patterns. We tend to only stick with pin bars and engulfing bars as these have proven to be the most effective.
For us, lower timeframe confirmation starts on the M15 and finishes up on the H1, since most of our higher timeframe areas begin with the H4.
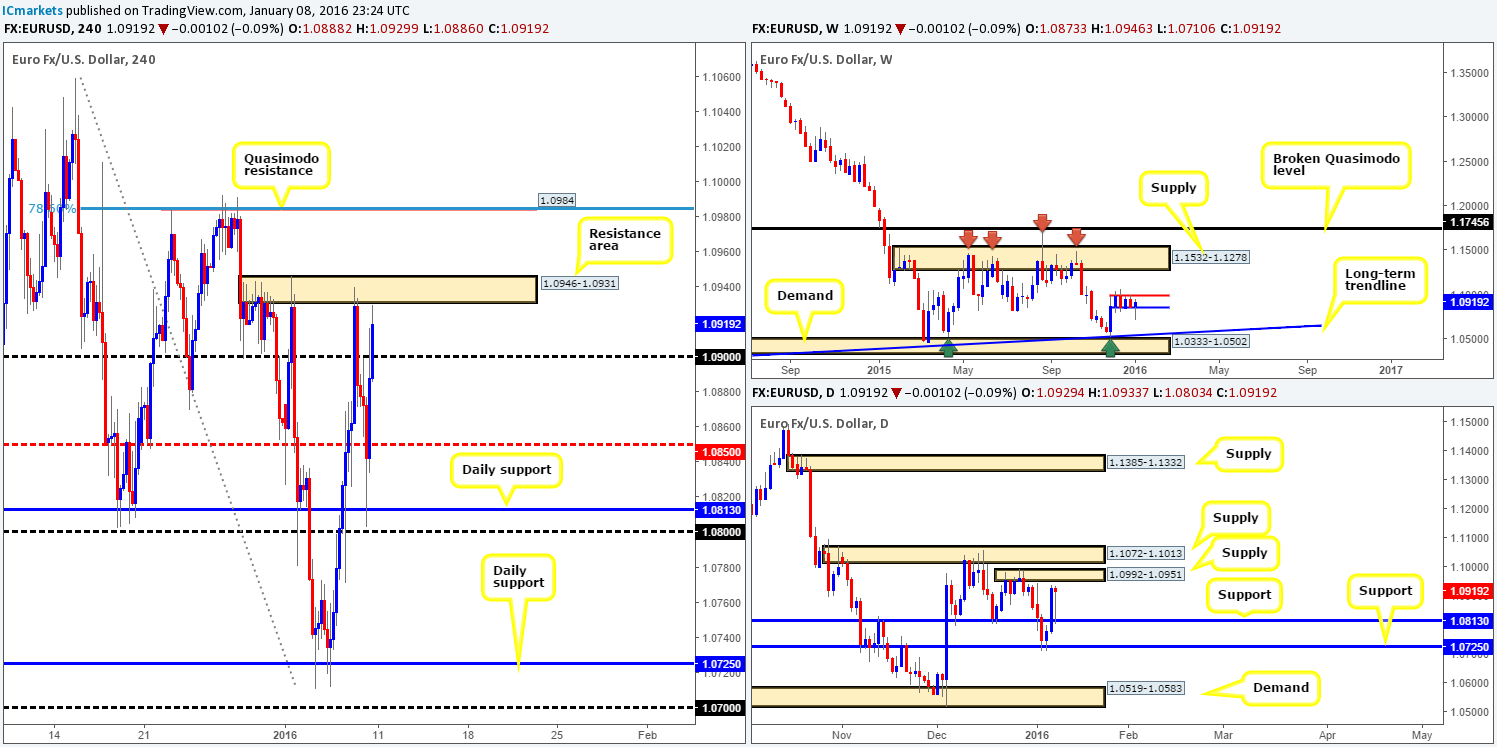
EUR/USD:
Beginning with the weekly timeframe, we can see that last week’s trade ended with the EUR printing a nice-looking buying tail, closing 56 pips in the green at 1.0919. Since Dec 7th 2015, weekly action has been confined between 1.0983/1.0851 (blue/red lines), which, as you can see, still remains to be the case. Beyond this tight range, however, there’s demand seen penciled in below at 1.0333-1.0502 (converges with a long-term trendline extended from the low 0.8231), and supply coming in above at 1.1532-1.1278.
Moving down to the daily timeframe, it’s clear to see that the EUR turned bullish going into Wednesday’s session from support at 1.0725. This, as a result, broke above 1.0813 on Thursday and held beautifully as support on Friday, as price pinned this barrier to-the-pip and closed the day painting a buying tail. Should traders be looking to go long this pair based on this buying momentum, we see little room for price to stretch its legs. Directly above, a formation of stacked supply waits at 1.1072-1.1013/1.0992-1.0951.
Turning our attention to the H4, US nonfarm payrolls surged at 292k in December versus 252k in November (revised up from 211k). The unemployment rate was steady at 5.0% for a third consecutive month. Following this release the EUR immediately fell, slightly surpassing daily support at 1.0813 and just missing psychological support at 1.0800. Despite this, the U.S. dollar could not maintain this momentum as bids flooded the market rallying price over 100 pips, ending the week nudging into a resistance area drawn from 1.0946-1.0931.
Given that today’s fundamental docket is relatively light, today’s action could be somewhat limited. That being said, we really only have one level on our watch list this week – the H4 Quasimodo resistance level at 1.0984. Here’s why:
- It converges beautifully with the upper range band seen on the weekly timeframe mentioned above at 1.0983.
- Daily supply at 1.0992-1.0951 encapsulates this H4 level.
- The 78.6 Fibonacci level fuses nicely with the barrier.
In light of the above confluence, our team has placed a pending sell order at 1.0983, with a stop above daily supply at 1.0994. Targets will be determined by the approach to our sell zone.
Levels to watch/live orders:
- Buys: Flat (Stop loss: N/A).
- Sells: 1.0983 [Pending order] (Stop loss: 1.0994).
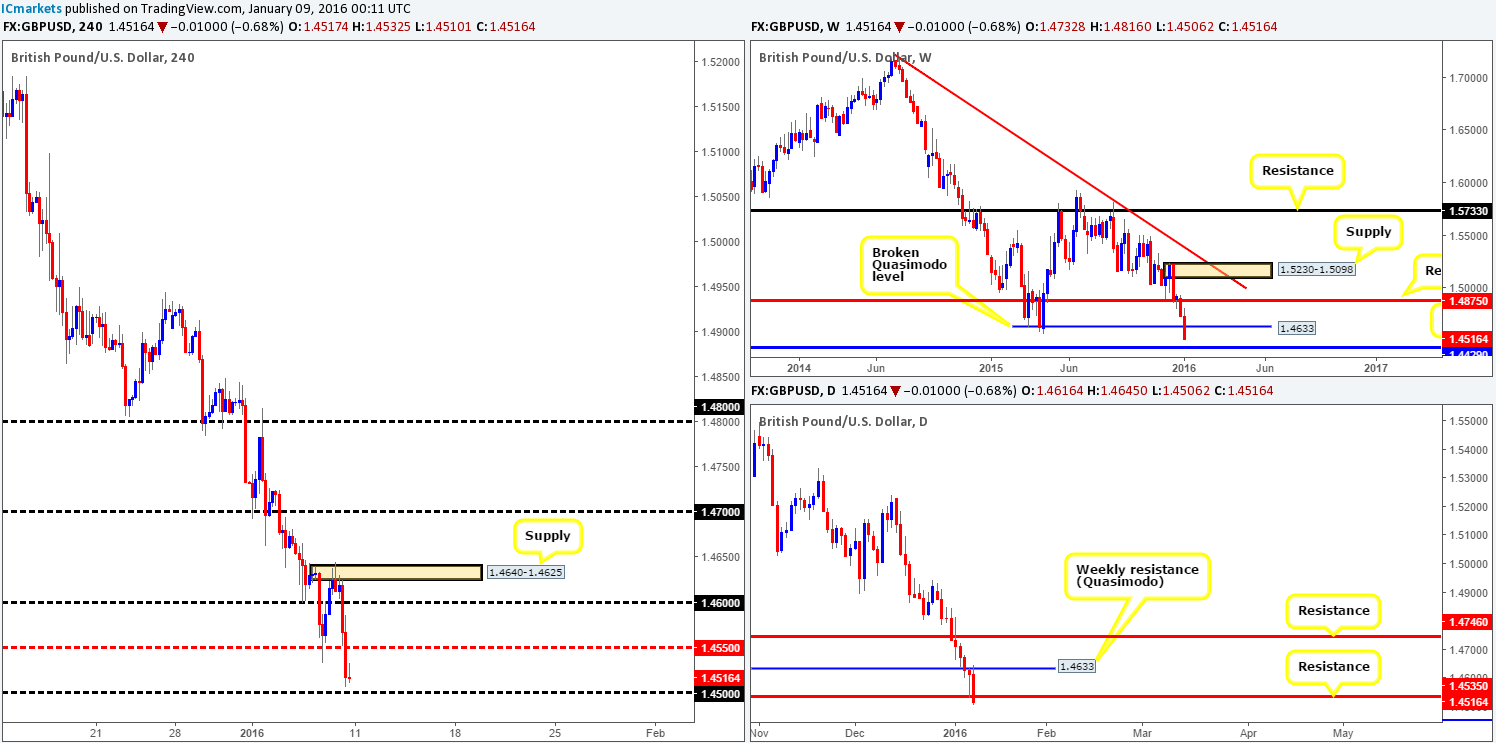
GBP/USD:
Cable suffered a nasty decline in value last week, losing around 220 pips into the close 1.4733. This bearish assault engulfed bids around the weekly Quasimodo support level at 1.4633, potentially setting the stage for further downside this week to support fixed at 1.4429.
Zooming in and looking at the daily chart shows that Thursday’s break of the weekly Quasimodo saw price attack bids at support drawn from 1.4530. This not only printed a nice-looking buying tail, but also dragged this pair back up to the underside of the weekly level itself. A lot of pin-bar traders possibly got burned on Friday buying this pattern, as price was heavily offered from this weekly level which ended with the market closing just below the above said support (now resistance). Downside targets from this angle come in the same as the weekly chart – 1.4429.
A quick recap of Friday’s sessions on the H4 show that the Pound reacted nicely to supply at 1.4640-1.4625 (a noted area to keep an eye on for lower timeframe confirmed sells). Unfortunately, we were unable to locate a setup to short this zone, well done to any of our readers who did though!
The 120-pip descent from this supply was aggressive and likely bolstered by the positive U.S. Payroll figures. Cable settled for the week just above psychological support 1.4500, which we feel will see some action later on today. In view of the higher timeframe structures (see above), nevertheless, our team is reluctant to buy from here. Instead, we’re looking for this number to break and be retested as resistance. This would, in effect, be our cue to begin looking for lower timeframe sell entries into this market, targeting mid-level support 1.4450, followed closely by weekly support mentioned above at 1.4429. Ultimately, we plan on closing our full position here due to this weekly barrier being rather significant, which could see prices consolidate or even reverse.
Levels to watch/live orders:
- Buys: Flat (Stop loss: N/A).
- Sells: Watch for bids to be consumed around 1.4500 and look to trade any retest seen thereafter (lower timeframe confirmation required).
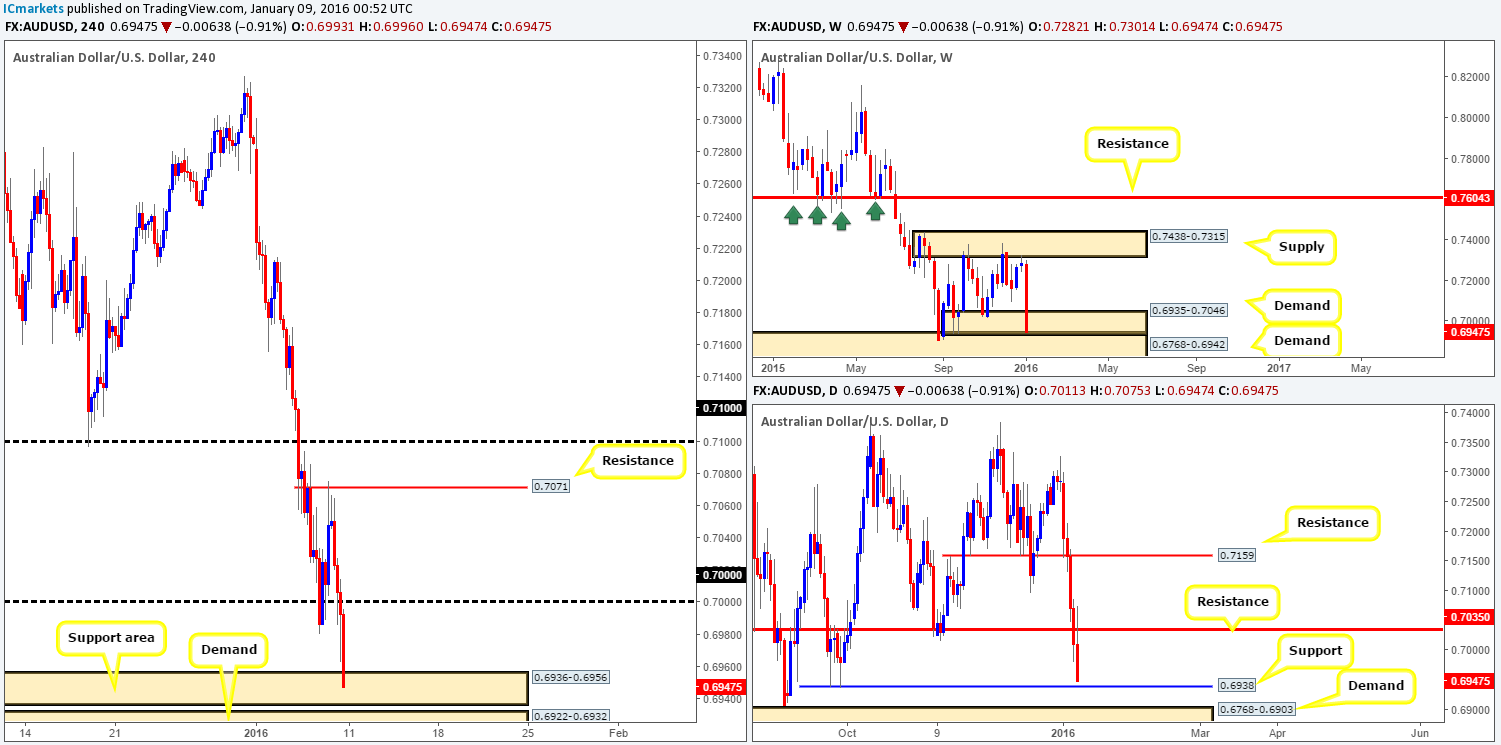
AUD/USD:
The start of 2016 for this commodity currency has been rather miserable. The pair dropped around 340 pips by the close 0.6947 last week with China being the main fundamental stimulant. This saw price drive deep into the jaws of demand coming in at 0.6935-0.7046, which as of yet, has seen very little response. Should this bearish assault continue this week, we expect the Aussie to visit demand lurking just below the current base at 0.6768-0.6942.
Looking to the daily chart, one can see just how little action the buyers saw last week! Multiple supports were taken out with trade concluding just above a clear support found at 0.6938 (located just within the weekly demand area seen at 0.6935-0.7046). In the event that this level holds firm, we’re expecting a bounce up to at least the 0.7035 region. Should bids fail here, however, an attack will then likely be seen on demand drawn from 0.6768-0.6903.
Moving down to the H4, the Aussie came under pressure from around 0.7071 in the early hours of Friday’s sessions. Following three clear selling wicks, the market aggressively drove lower going into European trade, which, continued until the close. This rather steep descent took out the large psychological support 0.7000 with relative ease, and ended the week pushing down into demand seen at 0.6936-0.6956.
Although the Aussie suffered last week, we cannot ignore the fact that this pair is now trading around supportive structures on all three of the above timeframes. That being the case, our team is going to keep a close eye on the current H4 support area and also the small demand seen below it at 0.6922-0.6932 for confirmed longs today, primarily targeting 0.7000.
Assuming that these areas are consumed, nevertheless, we can be pretty confident price is on its way to touching gloves with psychological support 0.6900, and at the same time, the top-side of daily demand mentioned above at 0.6768-0.6903.
Levels to watch/live orders:
- Buys: 0.6936-0.6956/ 0.6922-0.6932 [Tentative – confirmation required] (Stop loss: Dependent on where one confirms these areas).
- Sells: Flat (Stop loss: N/A).
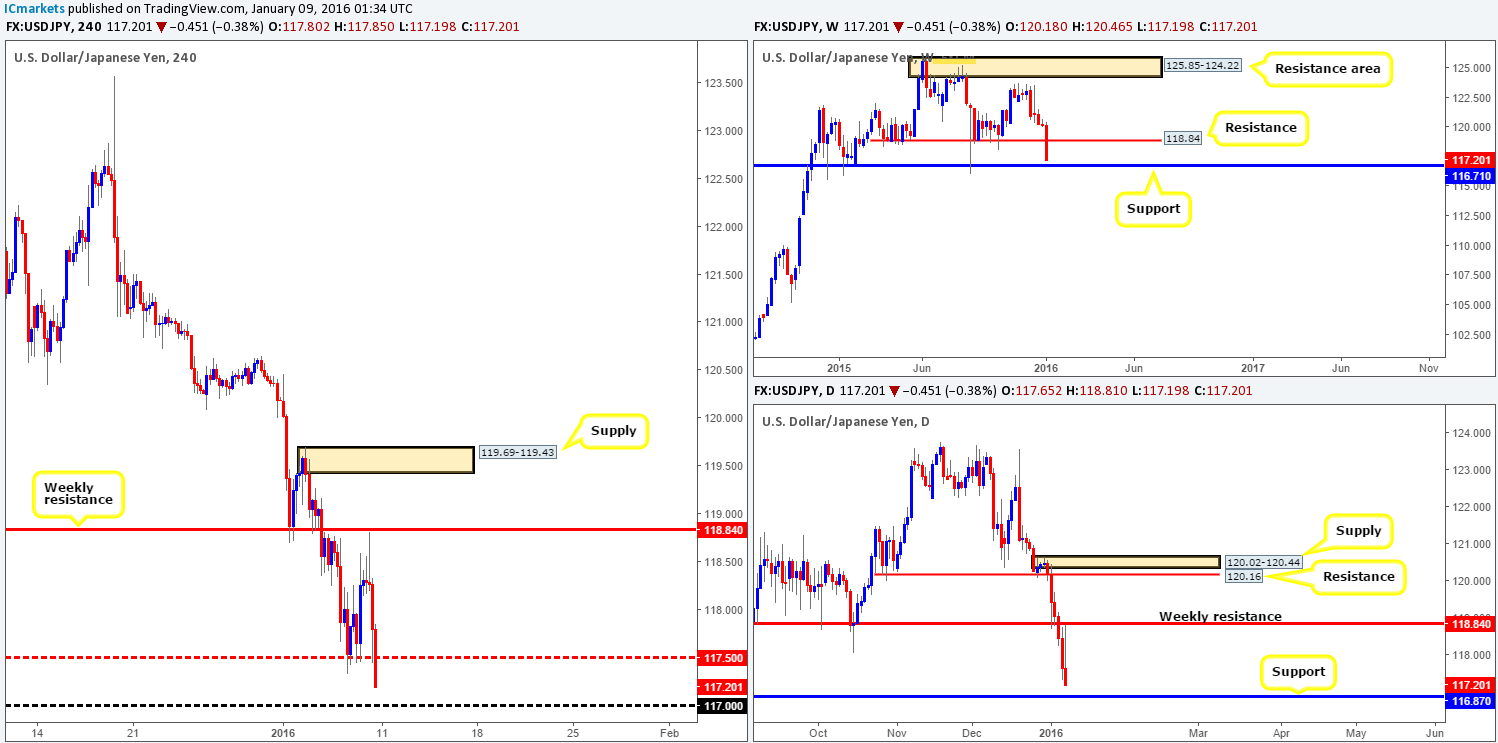
USD/JPY:
Like the AUD/USD, the USD/JPY also had a miserable start to 2016. A heavy round of safe-haven buying pushed this pair 300 pips lower by the close 117.20 last week. Support (now resistance) at 118.84 was well and truly engulfed as a result of this, and has likely cleared the path lower this week for price to connect with bids sitting around support painted at 116.71.
By zooming in and looking at the action on the daily chart, we can actually see that the break below the weekly support at 118.84 took place on Wednesday. Following this, price came very close to retesting this barrier as resistance on Friday, before closing the week on its lows. As per this timeframe, there’s little support seen stopping this market from driving lower this week and punching into bids around support at 116.87.
Although U.S employment data came in positive on Friday, gains were short-lived as price quickly turned lower from just below the weekly resistance level (see above in bold) and closed below mid-level support 117.50 by the week’s end (seen on H4).
Much like Friday’s report, our team will once again be focusing on the psychological support 117.00. This level – coupled with the higher timeframe supports at 116.71/116.87 form a potentially tight concentration of bids to keep an eye on for confirmed longs today/this week. The reason for requiring lower timeframe confirmation at this barrier is simply because current fundamentals may override this technical buy zone.
Levels to watch/live orders:
- Buys: 117.00/116.71 [Tentative – confirmation required] (Stop loss: Dependent on where one confirms this area).
- Sells: Flat (Stop loss: N/A).
USD/CAD:
2016 started off spectacularly for this commodity currency. Around 340 pips were gained into the close 1.4168. During this bullish attack, price sliced its way high into a major supply at 1.4190-1.3794, which, as you can see, ties in nicely with an upper channel resistance band extended from the high 1.1173. The bullish trend on this pair remains strong, and a break above the aforementioned weekly structures will, in our opinion, only exacerbate this.
On the other side of the field, we can see that Thursday’s daily candle closed above resistance at 1.4103 and retested it as support during Friday’s session (bolstered by a positive U.S employment reading). Providing that the buyers are able to maintain their presence above this level this week, further upside could be seen towards resistance penciled in at 1.4261, which is actually positioned ABOVE the current weekly supply!
A quick look at Friday’s H4 movement shows support at 1.4059 remained strong as did resistance on Oil coming in at 32.24. Price ended the day slightly piercing above Thursday’s high 1.4169, likely taking out a ton of buy stops.
With the close above daily resistance at 1.4103 and the strong bullish trend in place right now, we’re going to pass on looking to sell based on the weekly structures mentioned above. Instead, all eyes are going to be on the following setups today/this week:
- Since stops are likely consumed around Thursday’s high 1.4169, price could possibly attack psychological resistance 1.4200. A break above and confirmed retest of this number is what we’re watching for to join in this trend up to at least 1.4261 – the daily resistance.
- Should residual offers still reside around 1.4169, we may see price pullback and retest 1.4100 (and at the same time the recently broken daily level 1.4103). We would, dependent on how the lower timeframes behaved, look to buy here. Targets would obviously depend on how price approached 1.4100, but ultimately we’d be looking for a break of 1.4200.
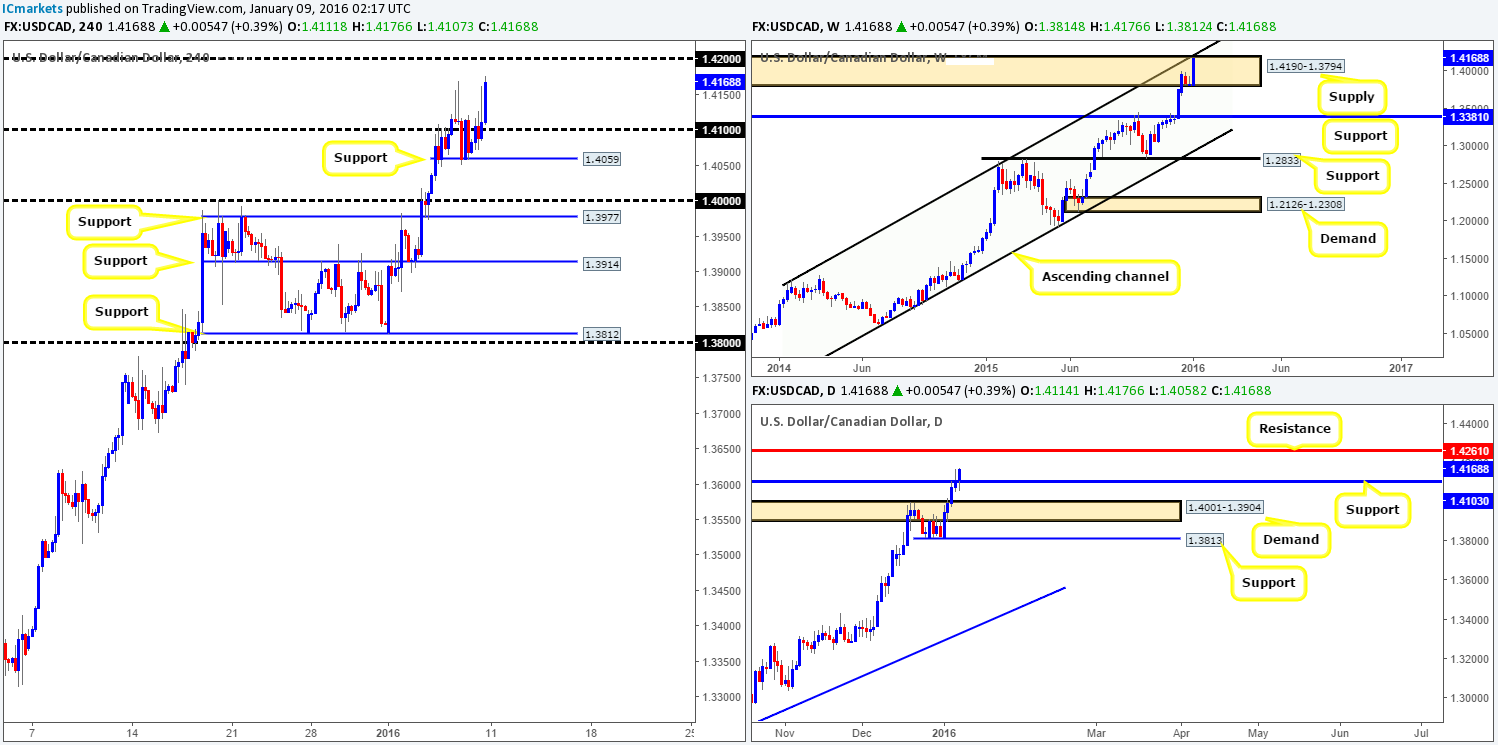
Levels to watch/live orders:
- Buys: Watch for offers to be consumed around 1.4200 and look to trade any retest seen thereafter (lower timeframe confirmation required). 1.4100 [Tentative – confirmation required] (Stop loss: Dependent on where one confirms this level).
- Sells: Flat (Stop loss: N/A).
USD/CHF:
Although the USD/CHF lost 53 pips at the close 0.9941, last week’s range stretched over 200 pips. Price came within seven pips of shaking hands with a recently faked supply at 1.0239-1.0131, before selling off down to just above a weekly support area at 0.9796-0.9902.
Branching lower to the daily chart, demand at 0.9851-0.9926 has so far done a pretty good job of holding this pair higher. Although we have not seen any significant gains from this zone yet, Friday’s candle printed an inverted pin-bar which in itself is a reversal signal.
Thanks to an NFP-induced spike higher on the H4 chart topping out at 1.0052, and no follow-through buying seen (despite U.S. employment figures coming in positive), we now have a potential Harmonic AB=CD bull pattern forming. Not only this, but this pattern’s completion point fuses together beautifully with both support at 0.9857 and a 78.6 Fibonacci level coming in at 0.9861. When coupled together with support being seen on both the weekly and daily timeframes right now (see above), we have ourselves one heck of a buy zone to watch this week.
As long as the AB=CD formation remains symmetrical we will enter with a market order at 0.9857, ideally placing our stop below the daily support at 0.9822 (we’d be looking at 0.9783). Our reason for why comes from this daily support level sitting just below current daily demand, making this hurdle a tempting barrier for well-funded traders to fake into past this demand.
Should the trade from 0.9857 come to fruition, TP 1 would be set at 0.9966 and the second at 1.0024 (based on the 38.2/61.8% Fib levels – Scott Carney trade management rules).
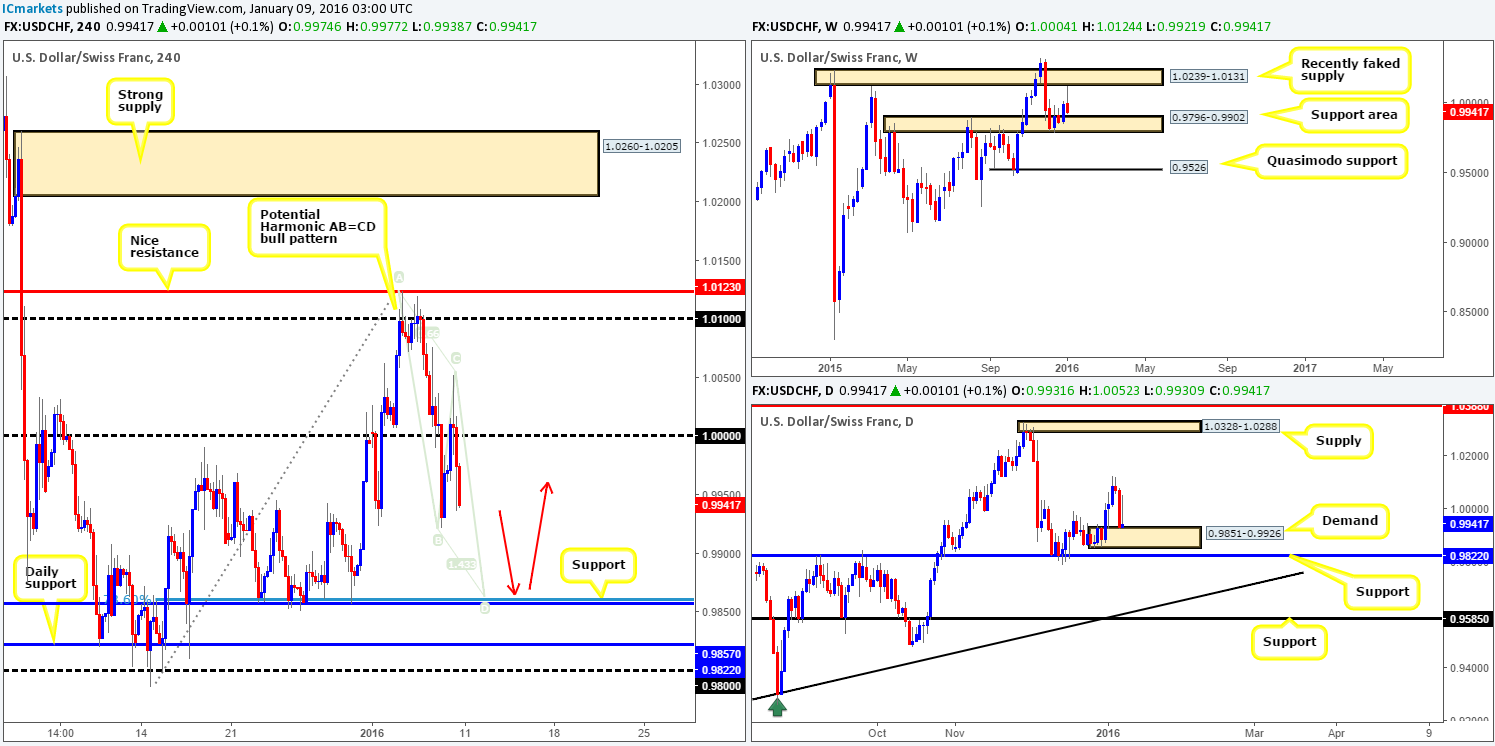
Levels to watch/live orders:
- Buys: 0.9857 [Market order] (Stop loss: 0.9783).
- Sells: Flat (Stop loss: N/A).
DOW 30:
U.S. stocks really took a beating last week, as fears surrounding China’s slowdown continued to dominate. Over 1200 points were erased from this index, with price action painting a full-bodied bearish candle that finished up at 16326. Supports at 17135 and 16935 were completely engulfed and, in our estimation, now shows room to continue driving lower to support penciled in at 15978.
On the other side of the coin, daily action shows that 16708 (a former support) was retested nicely as resistance during Friday’s session. Judging by the strong bearish reaction from this line, the next downside target to be aware of on this timeframe falls in around 15902-16083 – a clear area of support.
For those who read Friday’s report on the DOW (http://www.icmarkets.com/blog/friday-january-8th-fasten-your-seatbelts-traders-it-is-nfp-day-today/), you may recall us saying that In view of the clear bearish tone in this market right now, our team will not be looking to buy from H4 demand at 16426-16472. Instead, we were looking for a break below this zone and a retest of it as supply.
As you can see, there was no break lower until a few hours before the close. Therefore, today, and possibly even tomorrow, our team remains focused on shorting from the underside of this recently broken demand. Waiting for lower timeframe confirmation is preferred here, but if we see a bearish tail printed following the retest, and time of day is not a factor, we’d likely jump in short since further downside from here is high probability in our book. Regarding targets, we really only have one in mind at present and that is H4 support at 16036, which sits within the support base mentioned above.

Levels to watch/live orders:
- Buys: Flat (Stop loss: N/A).
- Sells: 16426-16472 [Tentative – confirmation preferred but not necessary] (Stop loss: Dependent on where one confirms this area).
XAU/USD: (Gold)
Gold sported a great start to 2016! Safe-haven buying saw the yellow metal surge over $41 in value during the course of last week. This, as you can see from the weekly chart, rallied price from demand at 1026.5-1054.8 into the mouth of supply drawn from 1098.6-1121.7 by the close 1103.9.
Shifting a gear lower to the daily chart, we can see that although price spiked above supply at 1098.6-1108.6, the market was unable to close higher. Stops above this supply have likely taken a hammering, which could force price to cross swords with a broken Quasimodo resistance at 1121.2 sometime this week. On the other hand, let’s not forget that weekly action is in supply right now, and could encourage sellers to come into the market before reaching 1121.2, potentially pushing price lower to retest support at 1084.5.
The after-effects of the employment release on the H4 was minimal. Granted a spike south was seen, reaching lows of 1091.9, but like most major pairs it was short-lived and buying resumed thereafter. By and large price is now seen capped between supply fixed at 1110.3-1108.0 and a broken Quasimodo line derived at 1095.6. Trading within this band is a possibility today, but not really something that interests us since we see only higher timeframe resistance structures surrounding this zone.
Why not look to short this capped zone? Good question! The reason why we’re shying away from this comes from the spike seen above daily supply at 1098.6-1108.6, which, as we mentioned above, suggests stops were consumed and the path north clear for further upside. We know this could just as well be a fakeout for lower prices, but when looking to trade we try to eliminate all possibilities but the level we’re interested in!
With that, what interests us at present is the daily Quasimodo line simply because it surrounds a picture-perfect H4 supply coming in at 1122.6-1120.3 that sits just above a 50.0% Fibonacci level at 1119.0 (taken from the high 1191.4/1046.2). Not only this, but this H4 supply fresh and is also lodged around the upper extremes of weekly supply (see above).
Therefore, should price breakout above the H4 supply this week, we’ll be looking for price to drive up this sell zone to likely short at market (dependent on the approach and time of day). Under normal circumstances, we would usually look to go long on the retest of the broken H4 supply and buy up to our sell zone, but with price loitering within weekly supply, we’ll pass and let the market come to us!
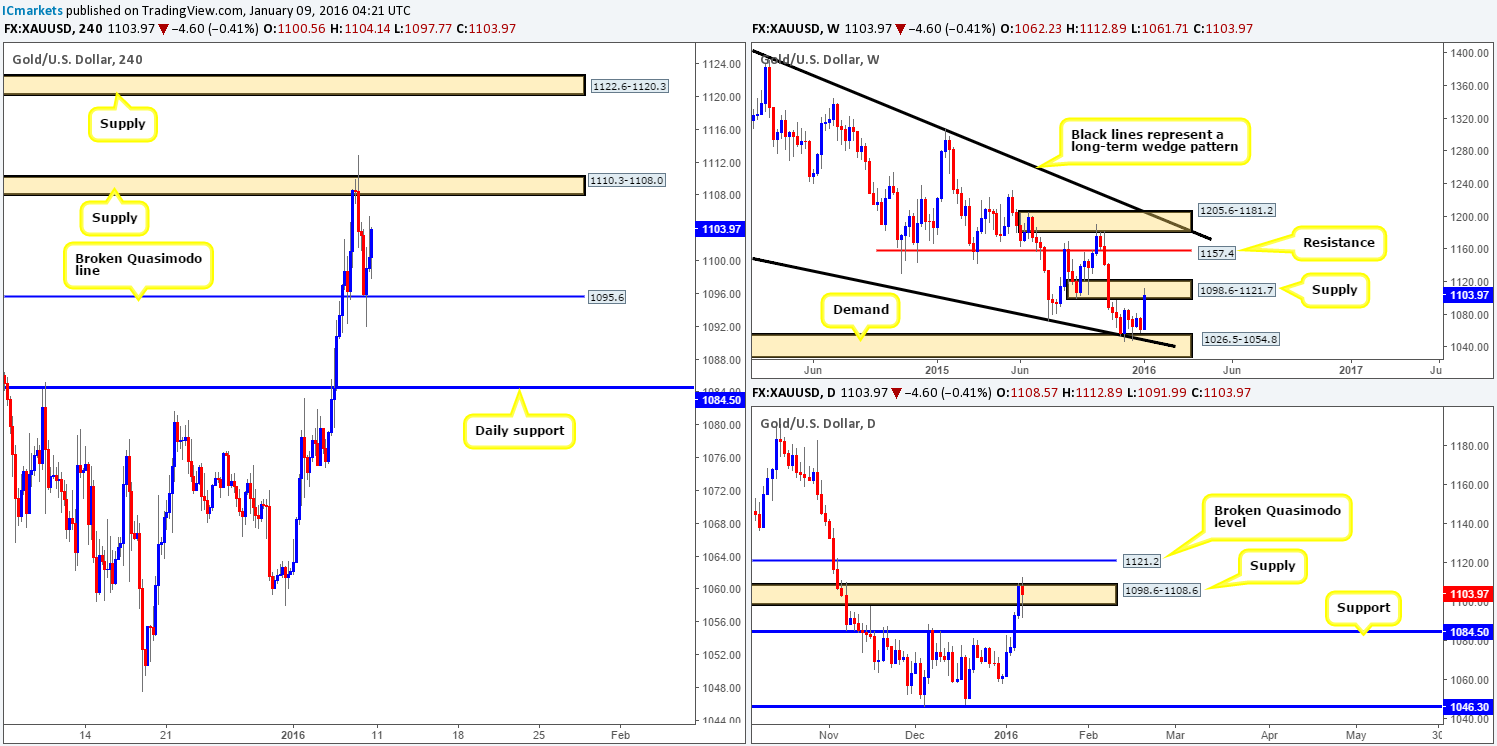
Levels to watch/live orders:
- Buys: Flat (Stop loss: N/A).
- Sells: 1122.6-1120.3 [Will likely short here at market] (Stop loss: 1123.1)