
EUR/USD:
Despite limited macroeconomic presence out of both Europe and the US, demand for the greenback intensified Monday. The US dollar index (calculated by factoring in the exchange rates of six major world currencies), bolstered by a strong advance in US Treasuries, climbed above its 97.00 mark and clocked a fresh 2019 high at 97.12.
With the buck exploring higher ground this weighed on its European counterpart, prompting the EUR/USD to chalk up its sixth consecutive losing day Monday.
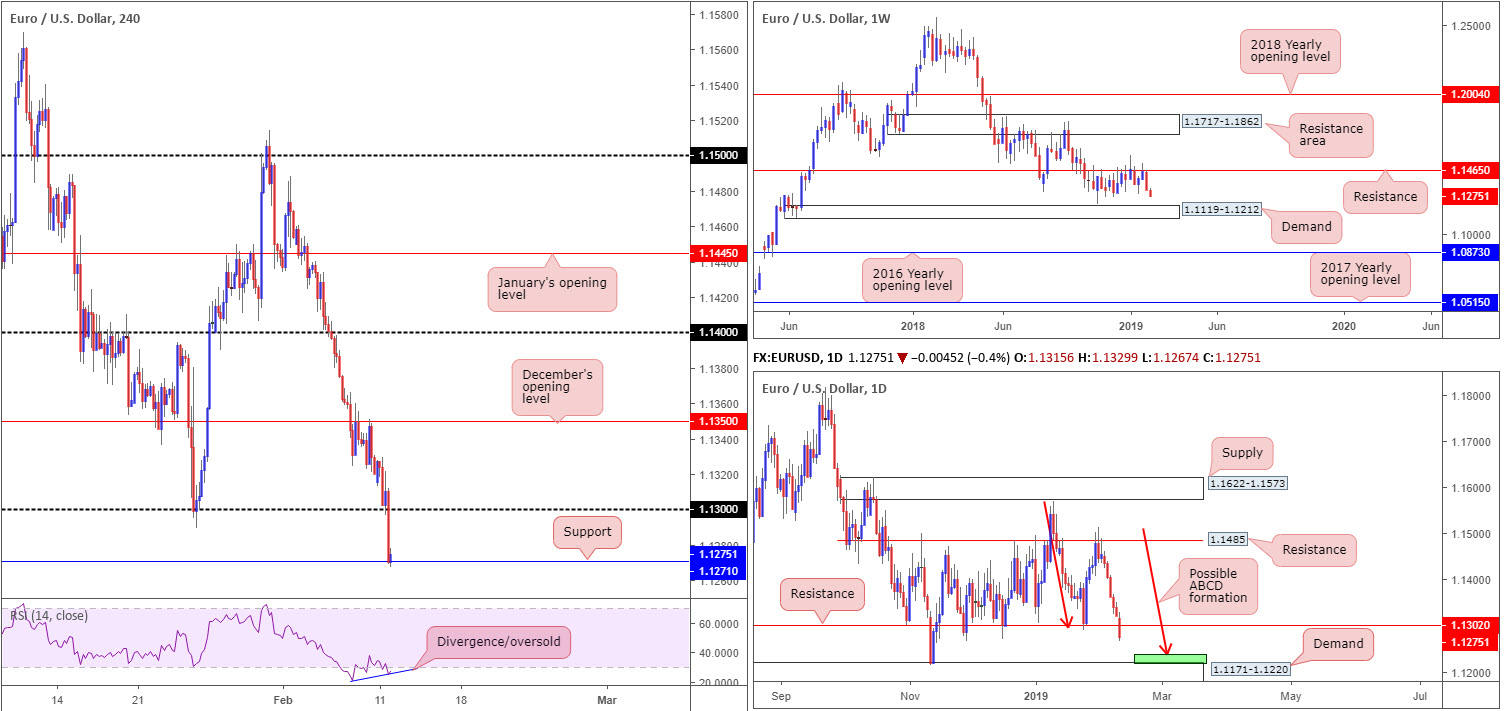
Boasting historical significance as far back as early February 2015 and capping upside action since late October 2018, long standing weekly support/resistance at 1.1465 remains firmly in the frame. The next downside target on the weekly scale has demand at 1.1119-1.1212 in sight this week.
By way of six consecutive bearish candles, recent trade concluded sub daily support at 1.1302 (now acting resistance). Should we continue pushing for lower ground, as the weekly timeframe suggests, daily demand at 1.1171-1.1220 is next in the firing range (glued to the top edge of the current weekly demand area). It might also be worth noting a possible daily ABCD bullish correction (red arrows) is in the process of forming that completes a few pips north of the aforementioned demand zone around 1.1240ish.
1.13 over on the H4 timeframe was absolutely obliterated in recent hours, in spite of an attempt to push higher beforehand. This, as you can see, pulled the H4 candles south to support at 1.1271, which, for now, is holding ground. It may interest traders to note beneath this level we have Quasimodo support in view at 1.1240 (not seen on the screen), and the RSI indicator seen displaying a divergence/oversold reading.
Areas of consideration:
Entering long from the current H4 support level at 1.1271, despite holding firm at the moment and supported by RSI confirmation, is a chancy move knowing the market’s overall position on the higher timeframes.
The better area for longs is between 1.1240/1.1220: the H4 Quasimodo support and the daily ABCD bullish completion, as well as the top edge of demand printed at 1.1220 (green zone daily). Remember, this daily demand is sited on top of weekly demand mentioned above at 1.1119-1.1212, therefore offering plenty of confluence. For conservative traders concerned regarding the size of the buy zone: 20 pips, waiting for a H4 bullish candlestick formation to take shape is an option. That way, not only do we have modest confirmation buyers are interested, we have entry and stop parameters to work with as well.
Today’s data points: German Buba President Weidmann Speaks; Fed Chair Powell Speaks.
GBP/USD:
Britain’s economy slowed sharply in late 2018, pushing full-year growth to its weakest in six years as Brexit worries hammered investment by companies and the global economic slowdown weighed on trade, official data showed Monday. The pace of economic growth fell to a quarterly rate of 0.2% between October and December from 0.6% in the previous quarter, in line with forecasts in a Reuters poll, while output in December alone dropped by the most since 2016 (Reuters). Alongside this, UK manufacturing also missed expectations (-0.7% vs. consensus 0.2%).
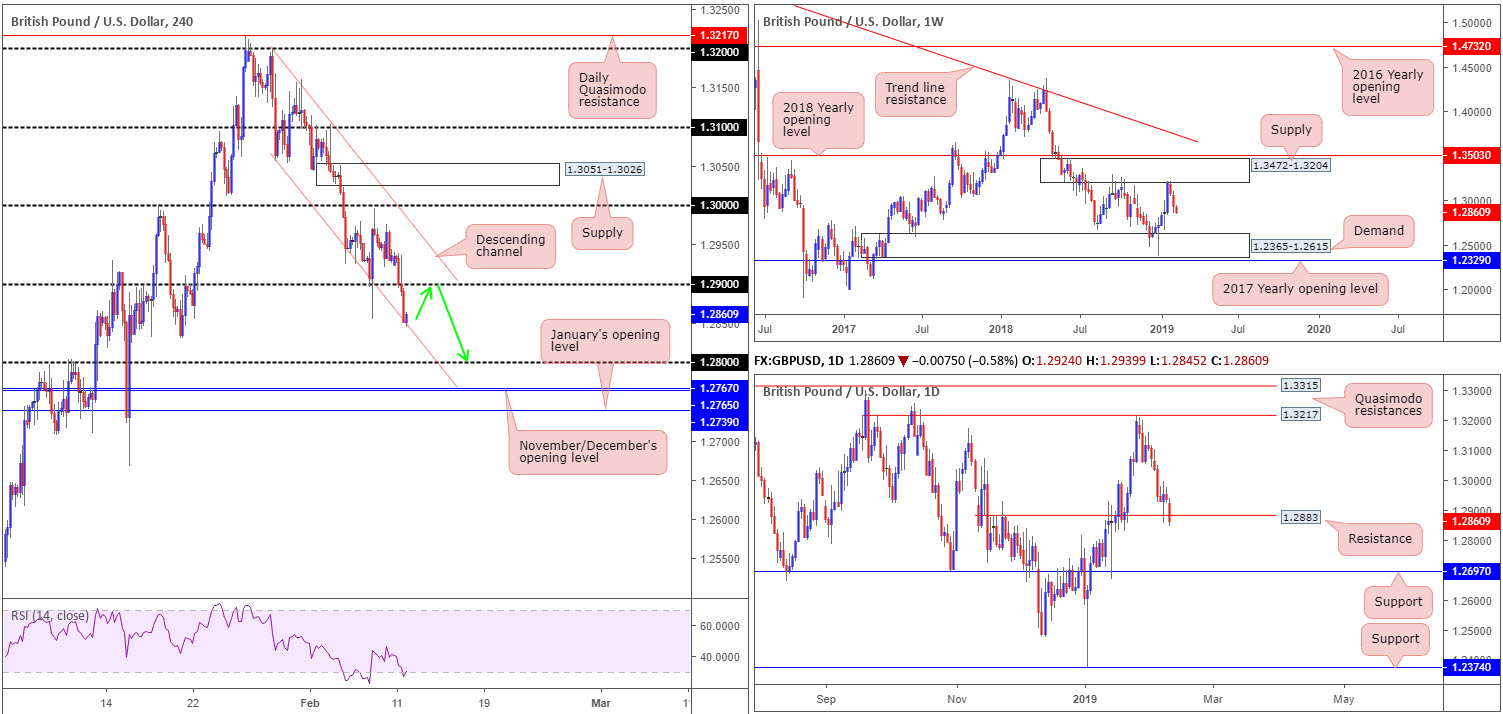
The above, coupled with the US dollar index clawing to fresh 2019 highs at 97.12, weighed on the GBP/USD. Technically speaking from the weekly timeframe, the recent decline should not come as a surprise having seen cable engage with the underside of weekly supply drawn from 1.3472-1.3204 two weeks ago. According to this timeframe, sellers remain in the driving seat. The next obvious downside target from this region can be seen at demand carved from 1.2365-1.2615. In conjunction with weekly flow, daily price overthrew its support level at 1.2883 (now acting as resistance), and potentially exposed support coming in at 1.2697.
The story on the H4 timeframe reveals 1.29 was consumed in recent trade, allowing the candles to test channel support (extended from the low 1.3056). Beyond here, the research team has eyes on the 1.28 handle, shadowed closely by November/December’s opening level at 1.2765/67.
Areas of consideration:
In similar fashion to the EUR/USD, entering long on the GBP/USD this morning is chancy, given the location of the higher-timeframe candles. In fact, the most expected from the current H4 channel support is the underside of 1.29. On that note, 1.29 is a potential sell zone to have eyes on today as a retest play, targeting 1.29 as the initial port of call. Remember, the nearest area of support on the higher timeframes is daily support at 1.2697.
As round numbers (1.29) are prone to attract stop runs (fakeouts), waiting for additional bearish candlestick confirmation is worth considering (entry/stop parameters can be defined according to this structure).
Today’s data points: BoE Gov Carney Speaks; Fed Chair Powell Speaks.
AUD/USD:
Having observed the US dollar index trade firmer vs. all G10 counterparts Monday – clocking fresh 2019 highs at 97.12 – the Australian dollar ceded further ground in recent sessions.
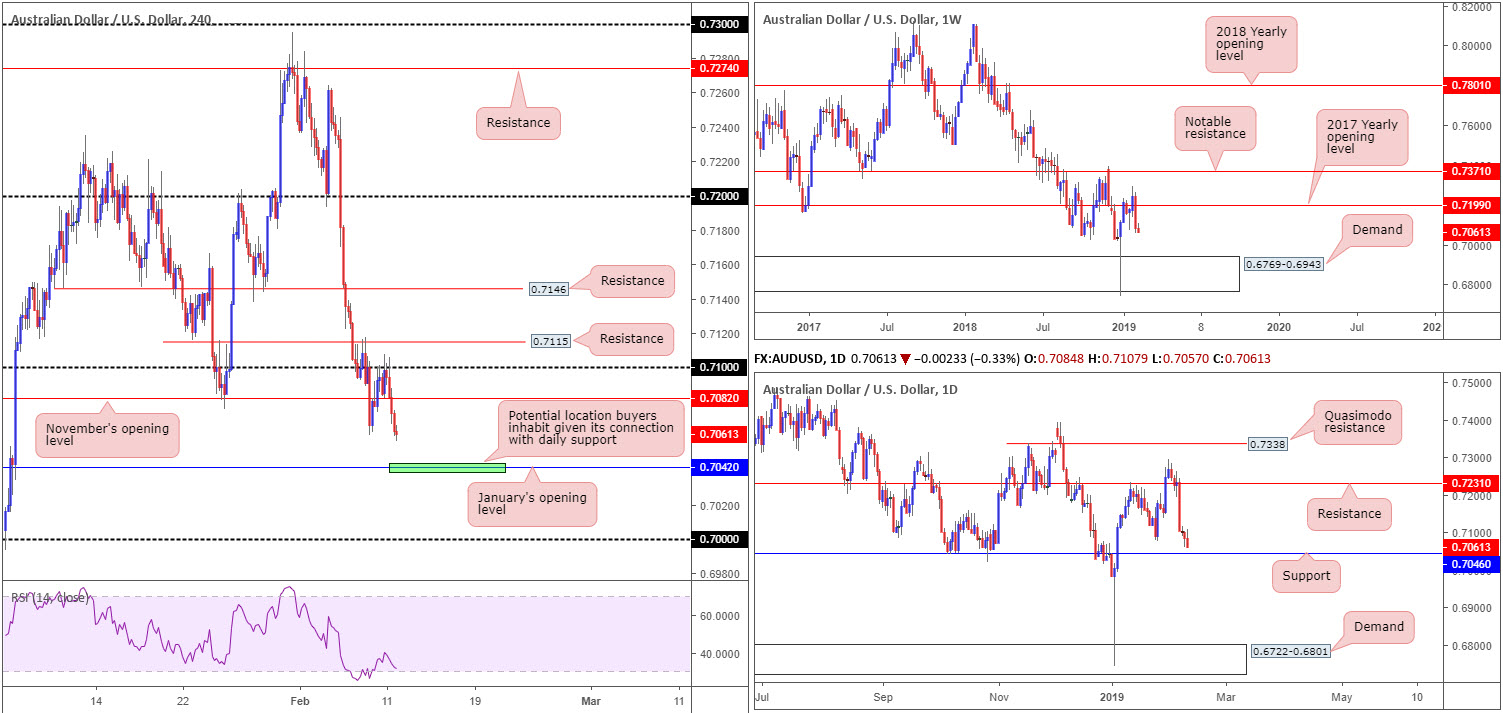
The 0.71 Handle on the H4 timeframe, as you can see, held as resistance, though did suffer a number of upside challenges. Mid-way through London, the pair conquered November’s opening level at 0.7082 to the downside and is now on course to test January’s opening level at 0.7042.
What’s interesting about January’s barrier is it coincides beautifully with daily support plotted at 0.7046, which happens to house reasonably attractive historical significance. While the combination of these two levels may appear high probability, weekly price displays room to press as far south as demand plotted at 0.6769-0.6943, after reclaiming the 2017 yearly opening level at 0.7199 last week.
Areas of consideration:
Although weekly price appears poised to discover lower levels this week, a bounce from January’s opening level mentioned above on the H4 timeframe at 0.7042, knowing it aligns closely with daily support at 0.7046, is possible.
On the whole, it is trader dependent on what entry method is used to confirm 0.7042 as support, if any. Some traders may prefer to drill down to the lower timeframes and search for a resistance-turned support setup to trade. Others may opt to wait for candlestick confirmation off the H4 timeframe. Both provide entry/stop parameters to work with and, by extension, confirm buyer intent.
Today’s data points: Fed Chair Powell Speaks.
USD/JPY:
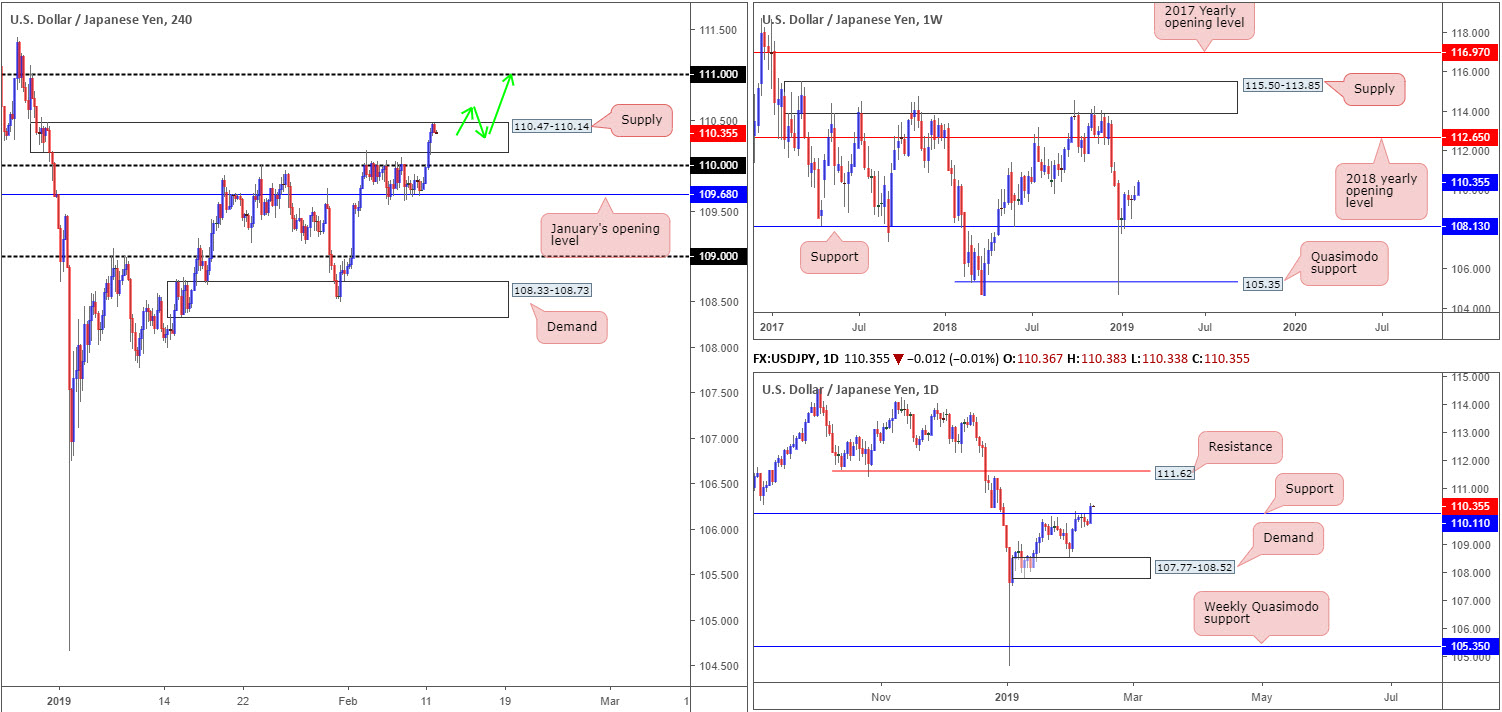
Despite upside attempts being limited by 110 over the course of last week, the USD/JPY comfortably overthrew this number Monday and struck fresh 2019 highs at 110.46. This move, although we remain trading within the upper boundary of H4 supply at 110.47-110.14, paves the way for further yen weakness this week according to the weekly and daily timeframes.
Despite last week’s bearish pin-bar formation on the weekly timeframe, strong buyers entered the fray. Should the market continue to spin north, the 2018 yearly opening level at 112.65 is next in line on this scale as an upside target. Supporting this we have daily price recently clawing its way above resistance at 110.11 (now acting support), with the next upside target resting around 111.62.
Areas of consideration:
On account of the above reading, the aforesaid H4 supply is unlikely to offer much in terms of downside movement today. The unit might strike its 110 handle, though getting much beyond this number is questionable. Instead, attention turns north beyond 110.47-110.14 towards the 111 handle.
A H4 close above the current H4 supply zone that’s followed up with a retest as support (green arrows), preferably in the shape of a H4 bullish candlestick configuration, is likely enough evidence to support a long in this market, targeting 111. Beyond 111, the next port of call in terms of resistance is seen around 111.62 (daily timeframe) and then eventually, with a little bit of oomph from the buyers, 112.65 may enter the fold on the weekly timeframe.
Today’s data points: Fed Chair Powell Speaks.
USD/CAD:
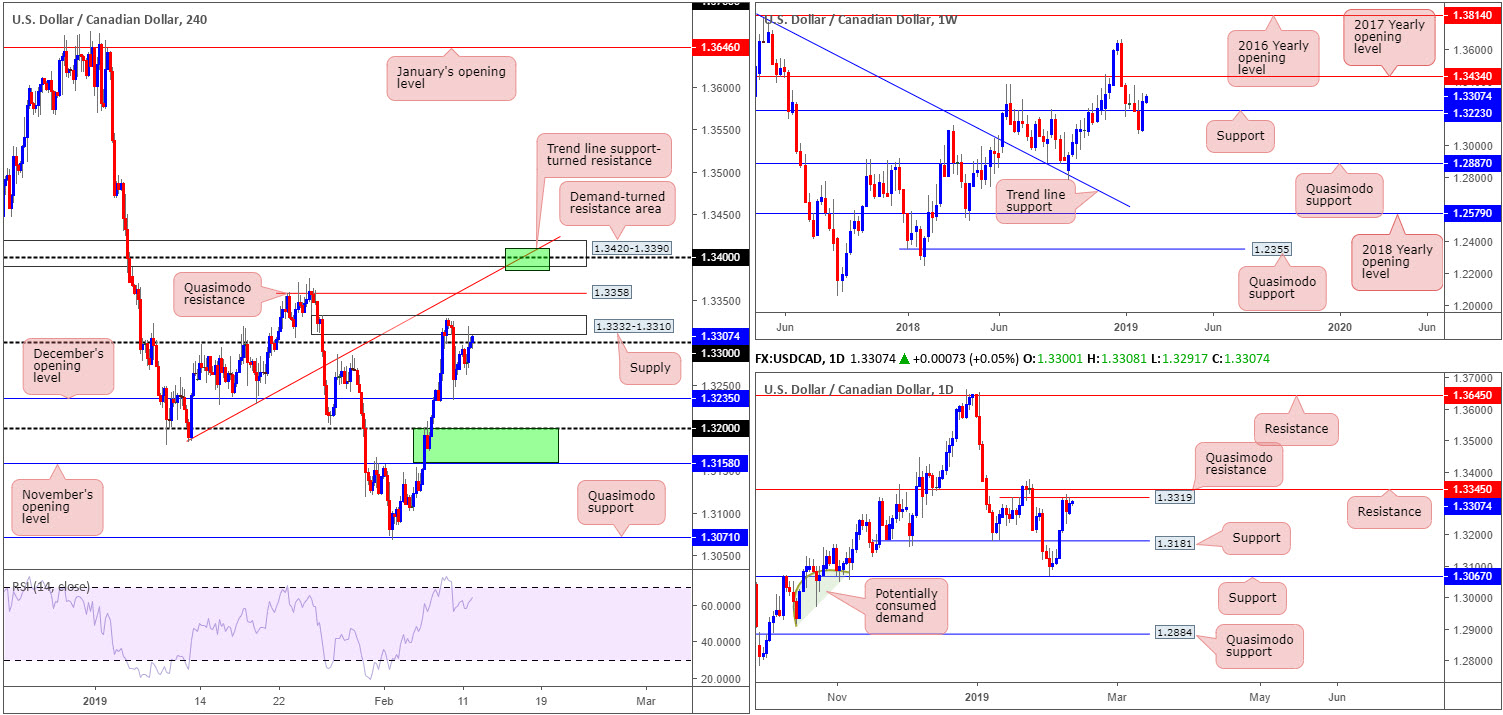
The US dollar advanced against its Canadian peer Monday, erasing a large portion of Friday’s selloff from 1.3329. Up 0.19% on the day, the H4 candles shook hands with its 1.33 handle and supply seen a few pips north of the level at 1.3332-1.3310. Beyond the supply, the research team notes Quasimodo resistance at 1.3358, tailed closely by a demand-turned resistance area at 1.3420-1.3390. Another important line of resistance falls in at a trend line support-turned resistance (etched from the low 1.3183).
With respect to the higher timeframes, Quasimodo resistance at 1.3319 remains intact on the daily timeframe, which could eventually call for a pullback towards nearby support at 1.3181. A violation of 1.3319 almost immediately exposes resistance at 1.3345. The flip side to this, however, is weekly movement recently recapturing resistance at 1.3223 and possibly clearing the river north towards the 2017 yearly opening level at 1.3434. Still, before reaching this base of resistance, a possible retest of the recently broken resistance as support may be seen this week.
Areas of consideration:
Where the market is positioned on the daily timeframe is interesting: the daily Quasimodo resistance at 1.3319, followed closely by resistance at 1.3345. This, alongside current H4 supply at 1.3332-1.3310, which happens to hold the aforesaid daily Quasimodo resistance within, could hold the market lower today.
A move higher, on the other hand, has H4 Quasimodo resistance at 1.3358 in sight. This level is closely positioned to daily resistance at 1.3345, and is therefore another area sellers might make an appearance.
Another range worth keeping on the watch list is the H4 demand-turned resistance area at 1.3420-1.3390 (green). The base holds little higher-timeframe confluence, though does house the 1.34 handle and a merging H4 trend line support-turned resistance (see above).
One final zone to keep eyes on (highlighted in Monday’s report) is between the 1.32 handle and November’s opening level at 1.3158 on the H4 timeframe (lower green). This is an attractive zone due to its connection with daily support mentioned above at 1.3181.
Today’s data points: Fed Chair Powell Speaks.
USD/CHF:
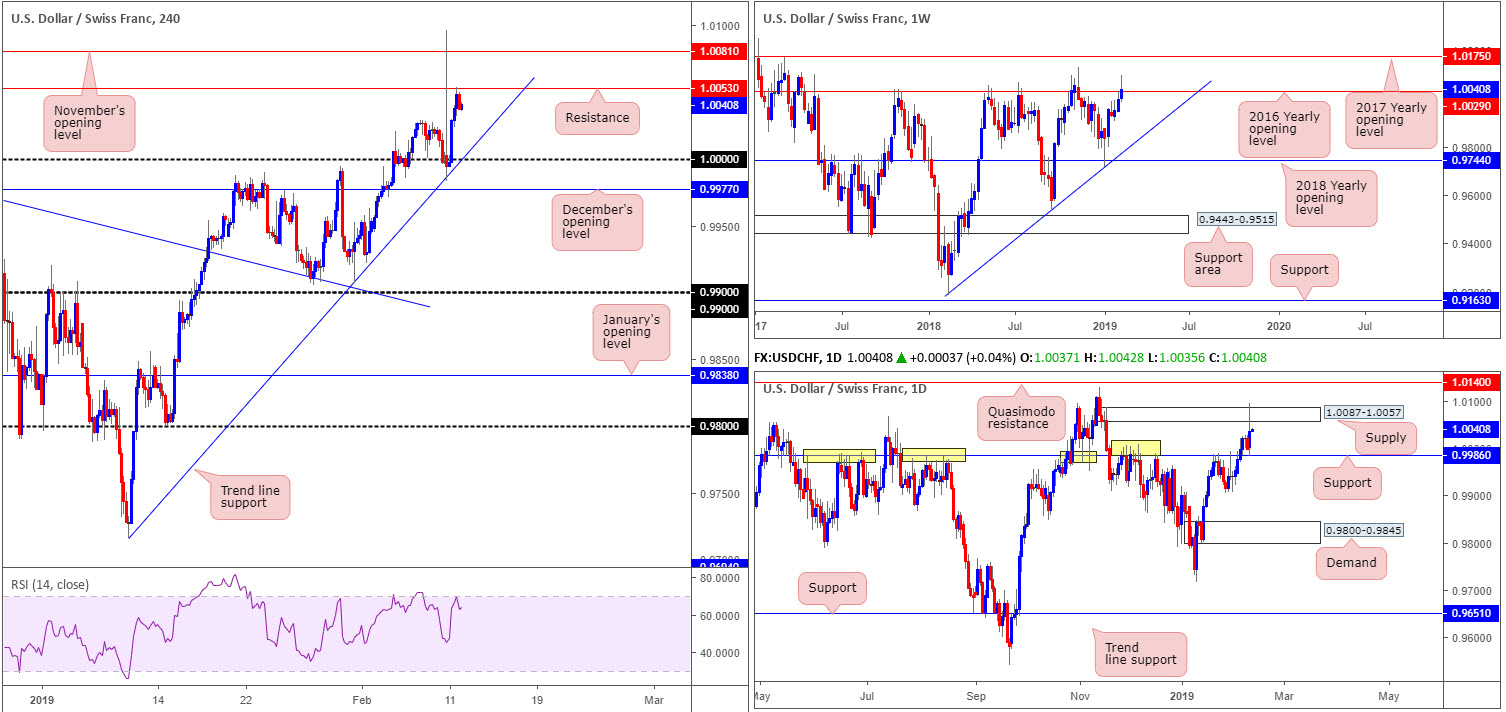
After a somewhat hasty opening on USD/CHF (which many are referring to as a ‘flash spike’), the pair advanced north. Broad-based USD bidding, bolstered by rising US Treasury yields, lifted the USD/CHF off 1.0000 (parity) Monday (fusing H4 trend line support [extended from lows of 0.9716]), concluding the session mildly paring gains off H4 resistance at 1.0053.
Directly above the current H4 resistance level, the underside of daily supply at 1.0087-1.0057 is present. Note within this daily area we also have November’s opening level at 1.0081 in view. Another point worth highlighting is yesterday’s ‘flash spike’ engulfed the daily supply zone, likely running a number of stop-loss orders.
Weekly price, on the other hand, is seen tackling the 2016 yearly opening level at 1.0029. Although the unit is trading marginally above this level, as we write, let’s not forget this is an incredibly strong barrier which should not be overlooked, with history dating as far back as early 2015. In the event the US dollar continues to reign supreme, however, keep tabs on the 2017 yearly opening level at 1.0175 as the next potential upside target.
Areas of consideration:
In essence, we have weekly price dancing with a critical level of resistance at 1.0029. As highlighted above, this barrier holds considerable history. Daily price is visibly defending support at 0.9986 and recently took out a chunk of sellers from supply at 1.0087-1.0057. H4 action is fading resistance at 1.0053 after advancing from 1.0000.
According to our technical studies, neither a long nor short is attractive in this market. Buying based on daily action tripping sellers’ stop loss orders faces potential opposition from weekly resistance and also H4 resistance as well. Selling, however, has weekly and H4 structure in favour, though does trade firmly in the face of daily flow.
Today’s data points: Fed Chair Powell Speaks.
Dow Jones Industrial Average:
US equities largely traded unchanged Monday. In light of this, much of the following report will offer a similar view to Monday’s briefing.
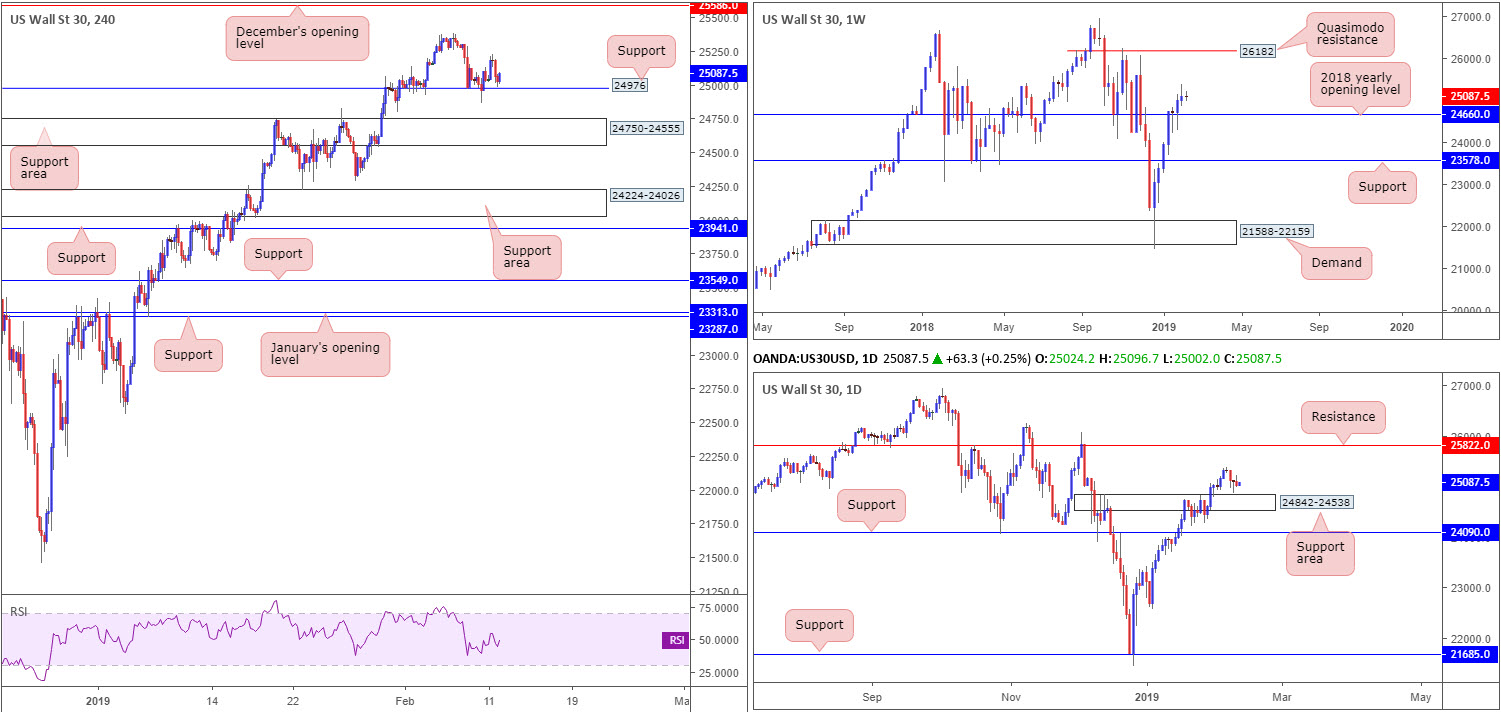
Starting from the weekly timeframe, the research team notes room to advance higher after establishing support above the 2018 yearly opening level at 24660, at least until the index crosses swords with a Quasimodo resistance at 26182.
A closer reading of this market shows price action trades a few points north of a support area at 24842-24538, which has an upside target set around resistance at 25822.
A brief look at recent dealings on the H4 timeframe shows consolidated movement off support at 24976. Note this level held price beautifully at the beginning of last week. Buying from this level has last week’s highs at 25385 to target, followed closely by December’s opening level at 25586.
Areas of consideration:
A long from the H4 support mentioned above at 24976 is an option today. However, given the time spent circulating around the current H4 support, the research team recommends waiting for additional confirming candlestick action to form before pulling the trigger (entry/stop parameters can be defined based on the selected candle structure).
Today’s data points: Fed Chair Powell Speaks.
XAU/USD (GOLD):
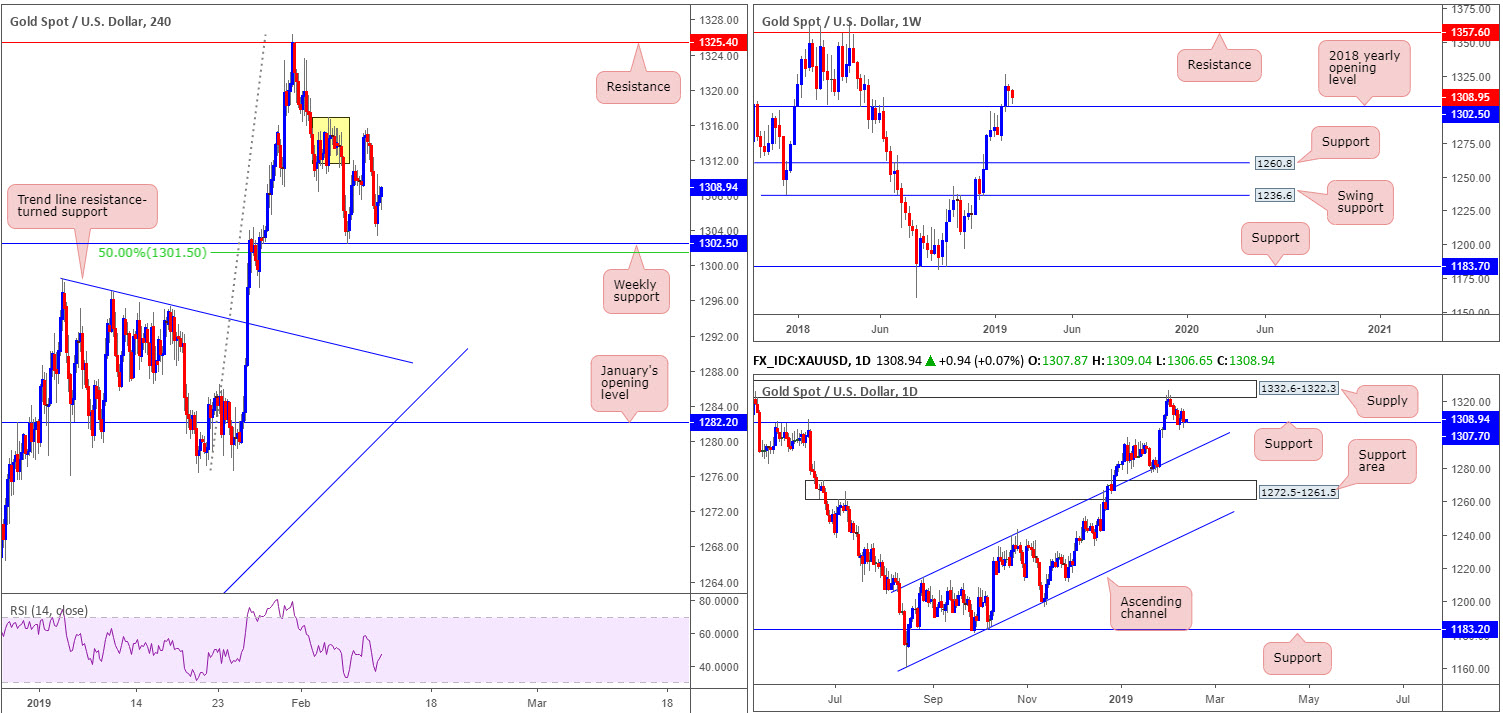
Since bullion engulfed the 2018 yearly opening level at 1302.5 to the upside, the yellow metal has struggled to generate much follow-through movement. This is despite last week’s bullish pin-bar formation. In the event the piece observes a rotation higher, nevertheless, buyers could potentially stretch this market as far north as resistance plotted at 1357.6.
Daily support at 1307.7, as you can see, re-entered the fray yesterday and is, at the time of writing, looking somewhat fragile. The next port of call to the upside from here falls in around supply drawn from 1332.6-1322.3.
From a H4 perspective, we can see supply around 1316.7/1311.5 (yellow) eventually capped upside on this scale, consequently pulling the candles to lows just north of weekly support mentioned above at 1302.5 (sited just north of a 50.0% support value on the H4 timeframe at 1301.5).
Areas of consideration:
With a large portion of sellers likely drawn into the market from the aforementioned H4 supply, this has perhaps cleared a path north for those wishing to buy the 2018 yearly opening level on the weekly scale at 1302.5. With this being the case, a notable H4 bullish candlestick pattern formed off the weekly level today may serve as a signal to enter long (entry/stop parameters can be defined based on the selected candle structure), targeting the noted H4 supply as the initial trouble area. Above here, eyes are on the underside of daily supply at 1332.6-1322.3, followed closely by H4 resistance at 1325.4.
The use of the site is agreement that the site is for informational and educational purposes only and does not constitute advice in any form in the furtherance of any trade or trading decisions.
The accuracy, completeness and timeliness of the information contained on this site cannot be guaranteed. IC Markets does not warranty, guarantee or make any representations, or assume any liability with regard to financial results based on the use of the information in the site.
News, views, opinions, recommendations and other information obtained from sources outside of www.icmarkets.com.au, used in this site are believed to be reliable, but we cannot guarantee their accuracy or completeness. All such information is subject to change at any time without notice. IC Markets assumes no responsibility for the content of any linked site. The fact that such links may exist does not indicate approval or endorsement of any material contained on any linked site.
IC Markets is not liable for any harm caused by the transmission, through accessing the services or information on this site, of a computer virus, or other computer code or programming device that might be used to access, delete, damage, disable, disrupt or otherwise impede in any manner, the operation of the site or of any user’s software, hardware, data or property.


