
DXY:
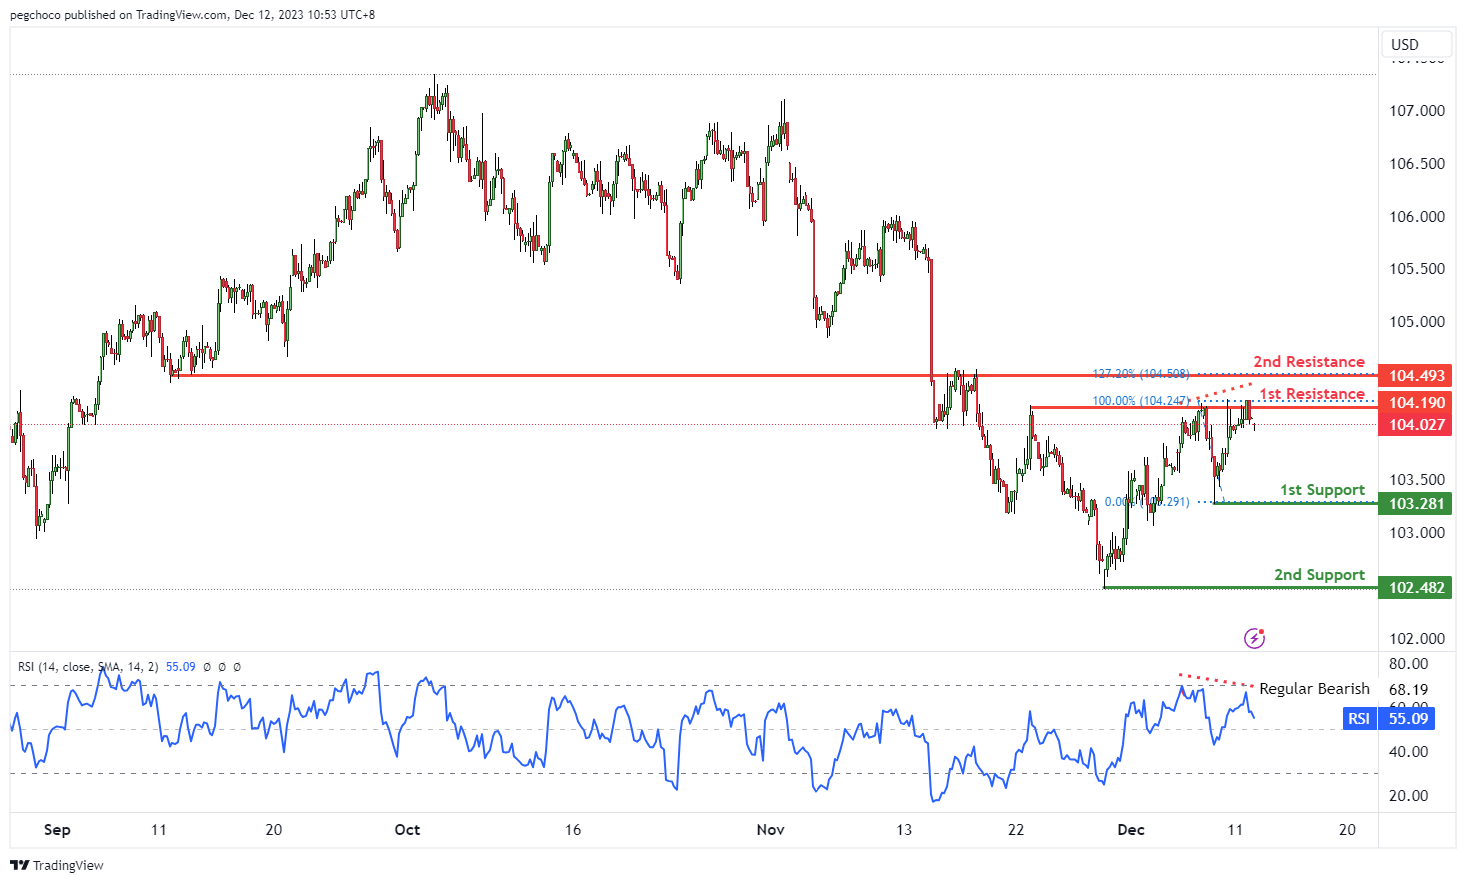
The DXY (US Dollar Index) chart currently has a bearish overall momentum, and there’s a potential scenario where price could make a bearish reaction off the 1st resistance level and drop towards the 1st support.
The 1st support at 103.28 is categorized as a swing low support. This level is significant as it suggests a potential area where buying interest may emerge, providing temporary support for the DXY.
The 2nd support at 102.48 is another swing low support level, further reinforcing its importance as a potential area where buyers might become active.
On the resistance side, the 1st resistance at 104.19 is noted as a multi-swing high resistance. This level is likely to act as a substantial barrier where selling interest may intensify, potentially triggering a bearish reversal.
The 2nd resistance at 104.49 is categorized as an overlap resistance and coincides with the 127.20% Fibonacci Extension level, indicating potential Fibonacci confluence. This level is also expected to be a strong resistance level.
Additionally, the RSI (Relative Strength Index) is displaying bearish divergence versus price, suggesting that a reversal might occur soon. This divergence can be a bearish signal, aligning with the overall bearish momentum.
EUR/USD:
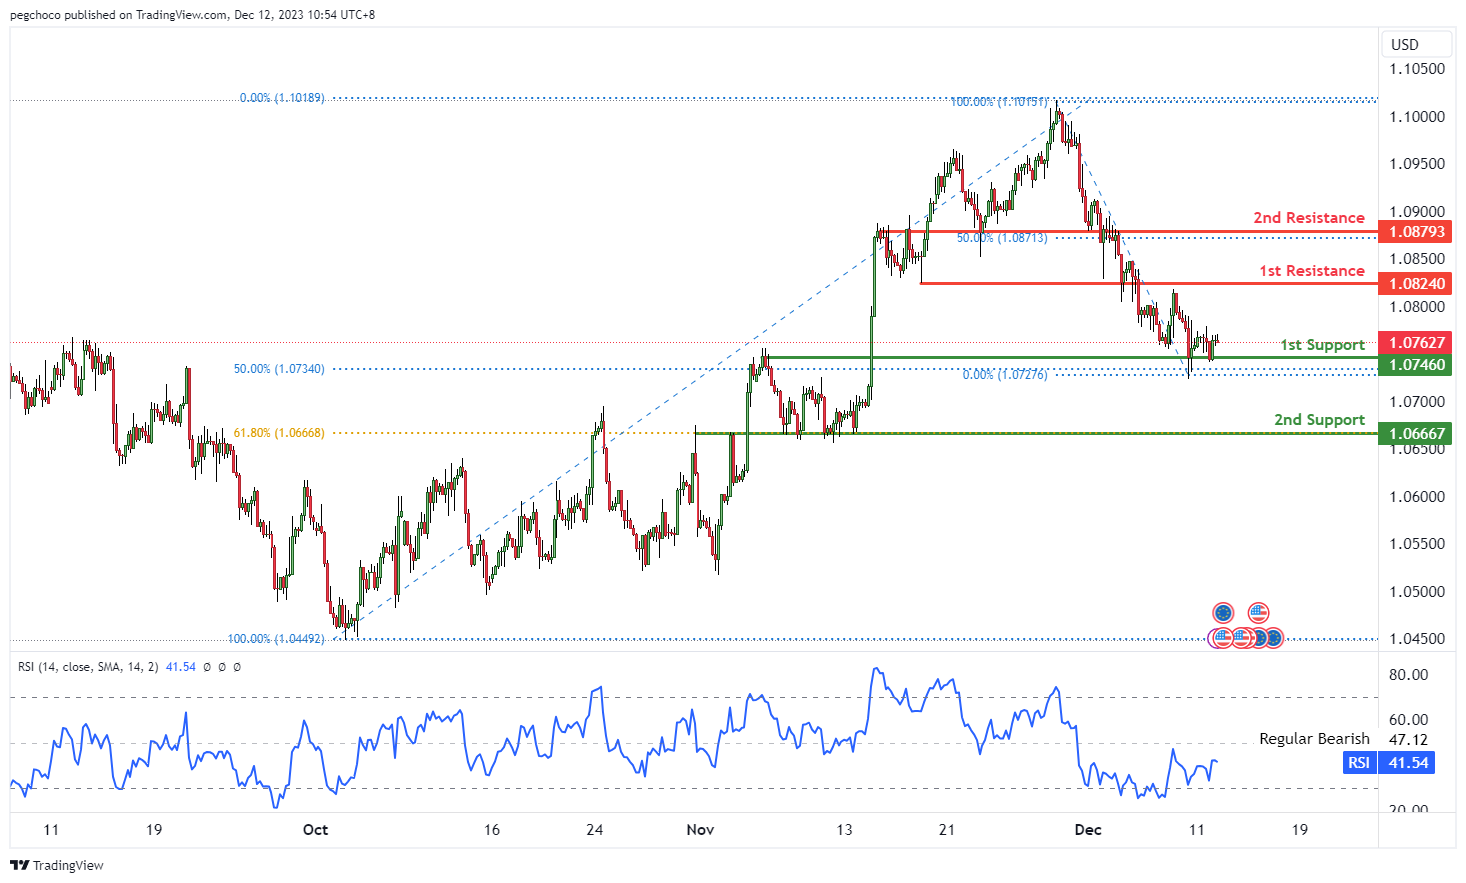
The EUR/USD chart currently has a bullish overall momentum, and there’s a potential scenario where price could make a bullish bounce off the 1st support level and head towards the 1st resistance.
The 1st support at 1.0746 is categorized as an overlap support and coincides with the 50% Fibonacci Retracement level. This level is significant as it suggests a potential area where buying interest may emerge, providing support for the EUR/USD pair.
The 2nd support at 1.0666 is also identified as an overlap support and coincides with the 61.80% Fibonacci Retracement level, further reinforcing its importance as a potential level where buyers might become active.
On the resistance side, the 1st resistance at 1.0824 is categorized as an overlap resistance, suggesting it as a substantial barrier where selling interest could intensify, potentially limiting upward movements.
The 2nd resistance at 1.0879 is noted as a pullback resistance and coincides with the 50% Fibonacci Retracement level, indicating potential Fibonacci confluence. This level is also expected to be a strong resistance level.
EUR/JPY:
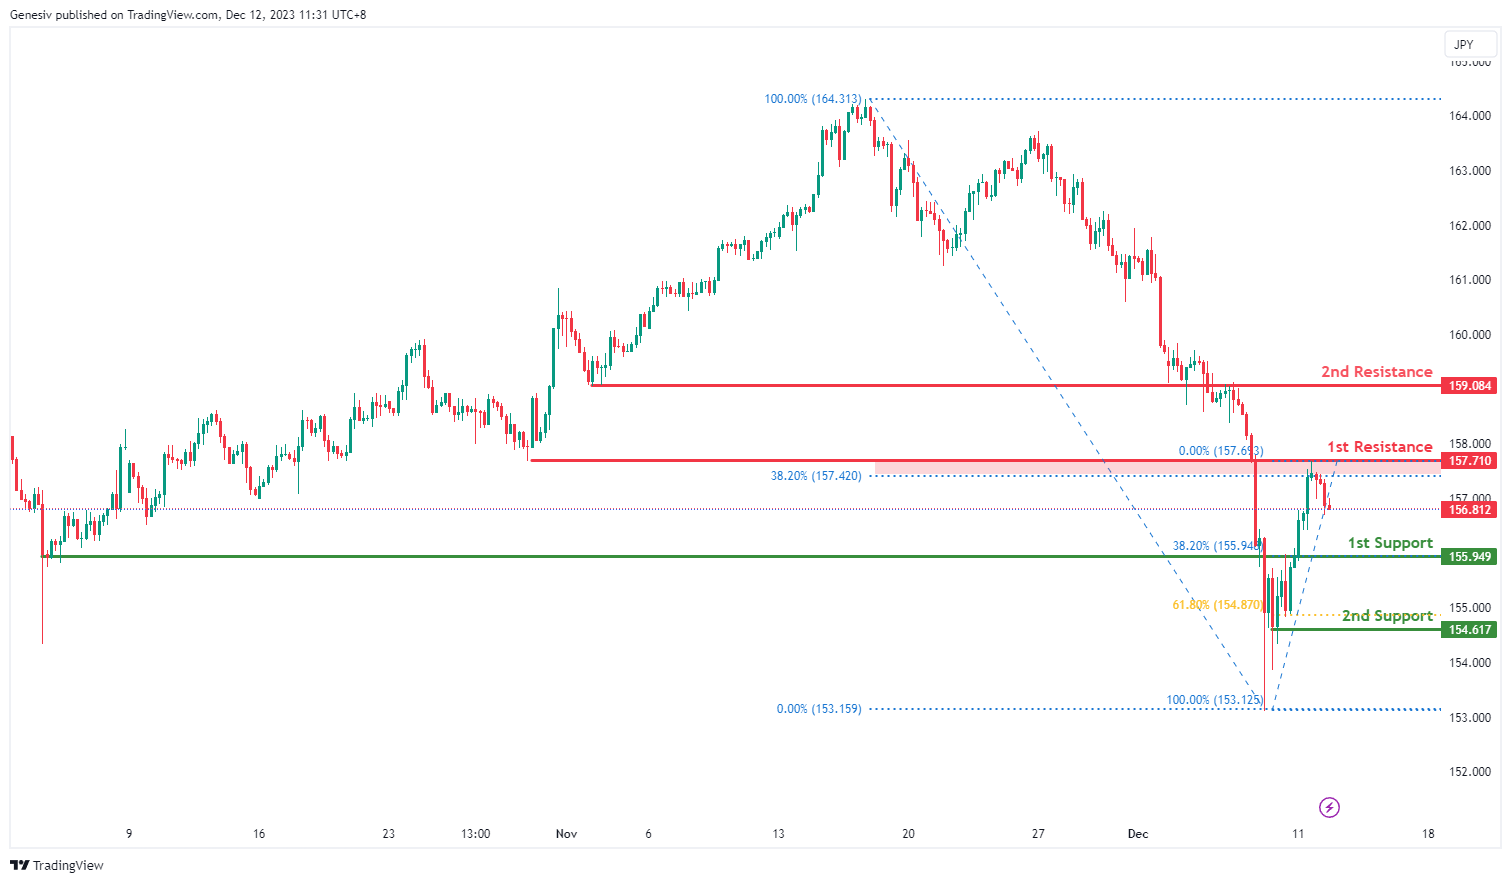
The EUR/JPY chart currently has a bearish overall momentum, suggesting a downward trend. In this scenario, there’s potential for a bearish continuation towards the 1st support level.
The 1st support at 155.94 is categorized as a pullback support and coincides with the 38.20% Fibonacci Retracement level, making it a significant level to watch for potential buying interest and temporary support for EUR/JPY.
Further down, the 2nd support at 154.61 is noteworthy as it’s a multi-swing low support and coincides with the 61.80% Fibonacci Retracement level. This level adds to the importance of the potential support area.
On the resistance side, the 1st resistance at 157.71 is identified as an overlap resistance and coincides with the 38.20% Fibonacci Retracement level. This level could act as a substantial barrier where selling interest may intensify, potentially limiting further upward movements.
Additionally, there’s a 2nd resistance at 159.08, which is also categorized as an overlap resistance.
EUR/GBP:
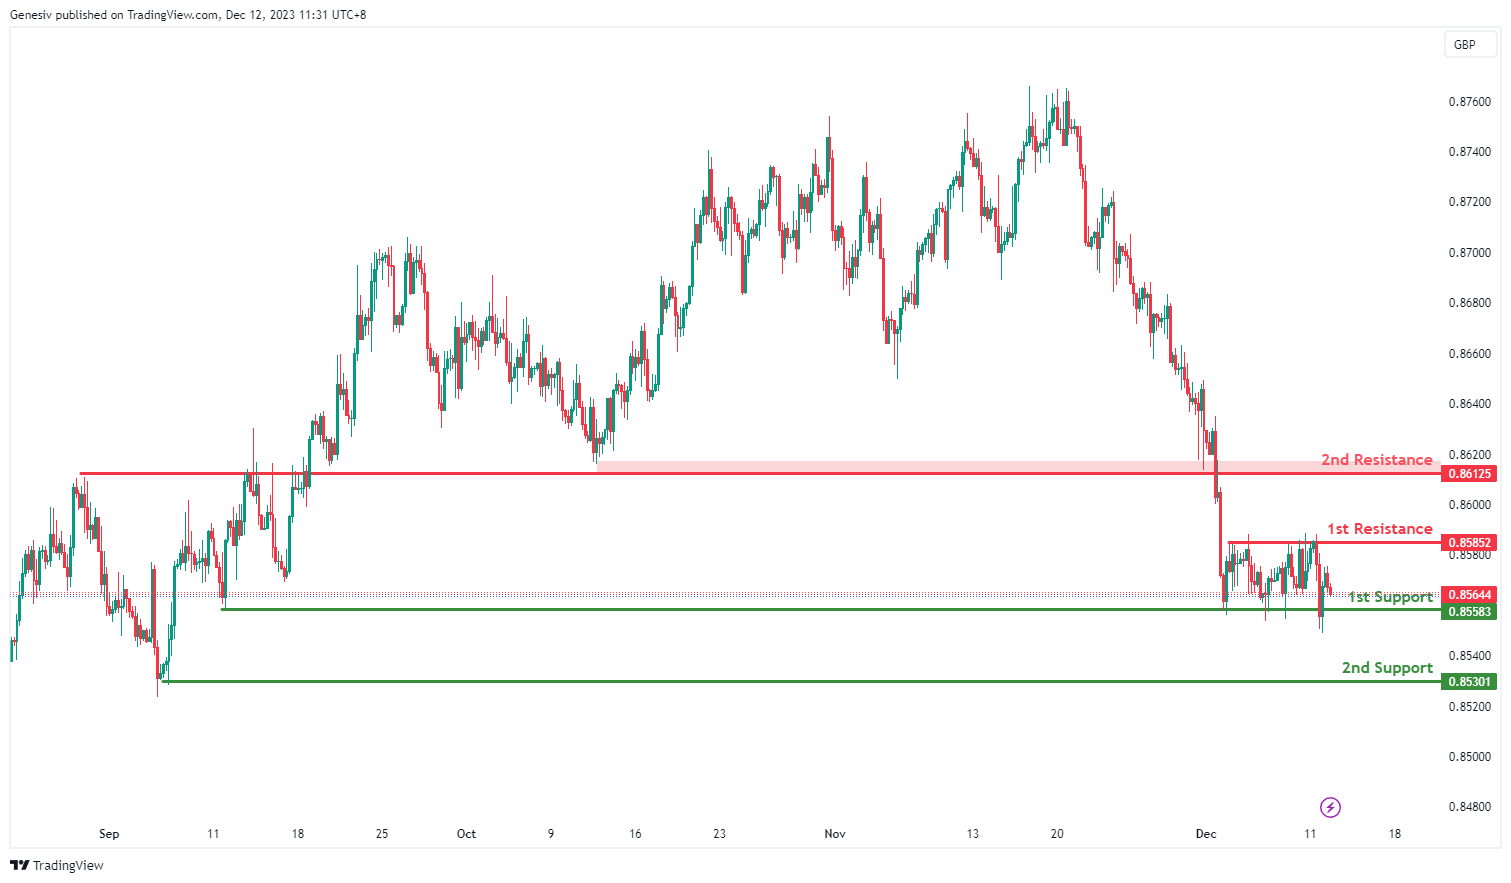
The EUR/GBP chart currently has a neutral overall momentum, suggesting that there is no clear directional bias at the moment. In such a scenario, price could potentially fluctuate between the 1st resistance and 1st support levels.
The 1st support at 0.8558 is considered a multi-swing low support, indicating that it has previously acted as a level where buying interest emerged. Traders may look for potential buying opportunities or temporary support around this level.
Similarly, the 2nd support at 0.8530 is another multi-swing low support level, further reinforcing the potential for price to find support in this area.
On the resistance side, the 1st resistance at 0.8585 is categorized as a multi-swing high resistance, suggesting that it has historically acted as a barrier to further upside movements. Traders may consider this level as a potential area where selling interest could intensify.
Further up, the 2nd resistance at 0.8612 is identified as a pullback resistance, indicating that it could also pose a challenge to upward movements.
GBP/USD:
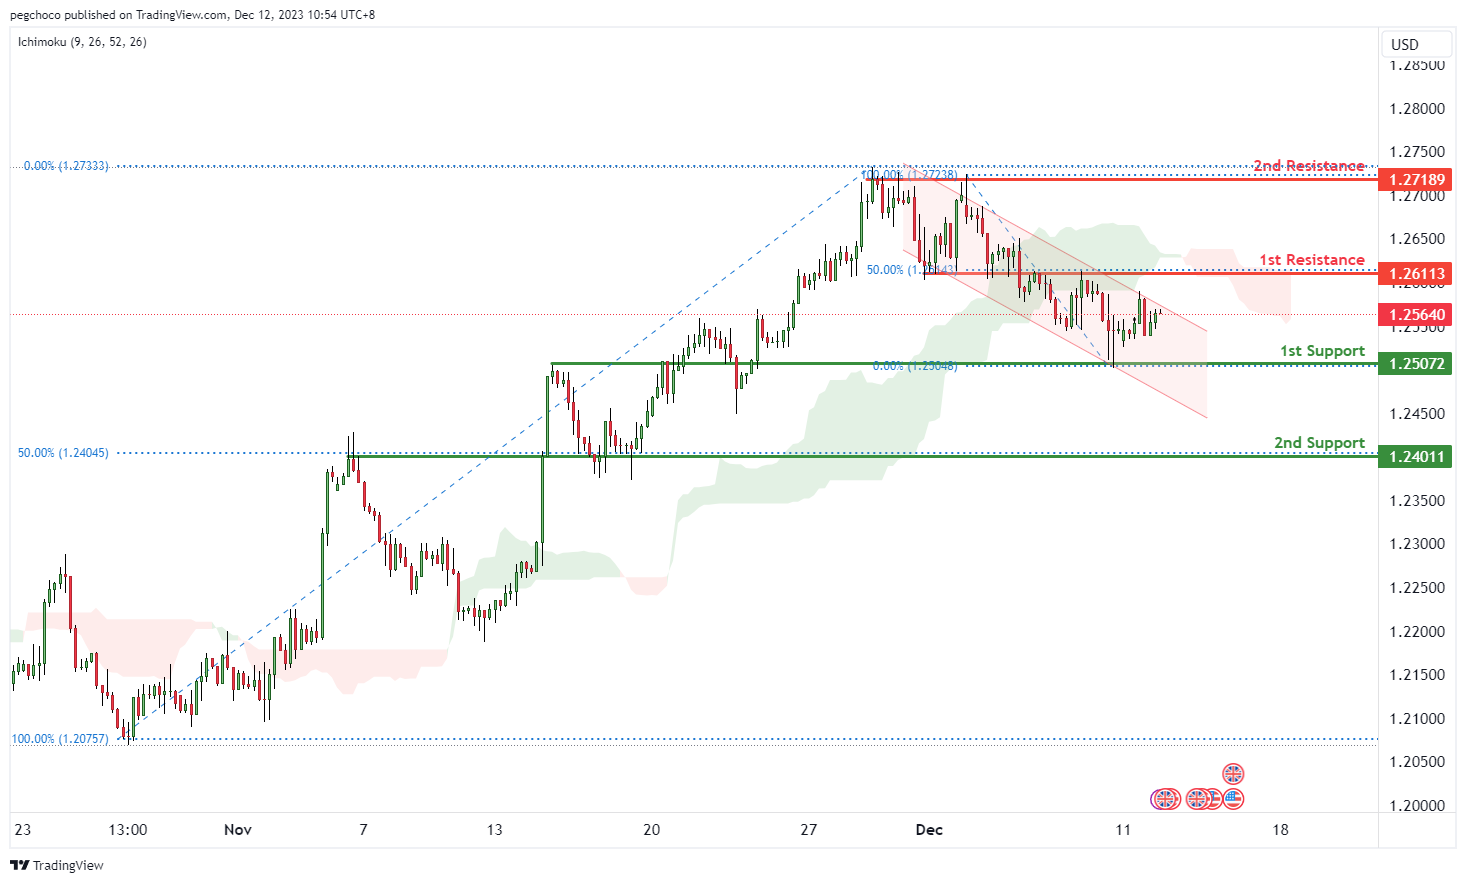
The GBP/USD chart currently exhibits a bearish overall momentum, and there are factors contributing to this bearish sentiment, including the price being below the bearish Ichimoku cloud and within a bearish channel. These indications suggest that the price might continue to move lower due to its bearish momentum.
In this scenario, there’s a potential for a bearish continuation towards the 1st support level.
The 1st support at 1.2507 is categorized as an overlap support. This level is significant as it suggests a potential area where buying interest may emerge, providing temporary support for the GBP/USD pair.
The 2nd support at 1.2401 is identified as an overlap support and coincides with the 50% Fibonacci Retracement level, further reinforcing its importance as a potential level where buyers might become active.
On the resistance side, the 1st resistance at 1.2611 is categorized as an overlap resistance and coincides with the 50% Fibonacci Retracement level. This level is likely to act as a substantial barrier where selling interest could intensify, potentially limiting upward movements.
The 2nd resistance at 1.2718 is noted as a multi-swing high resistance, indicating it as another significant level where selling pressure may increase.
GBP/JPY:
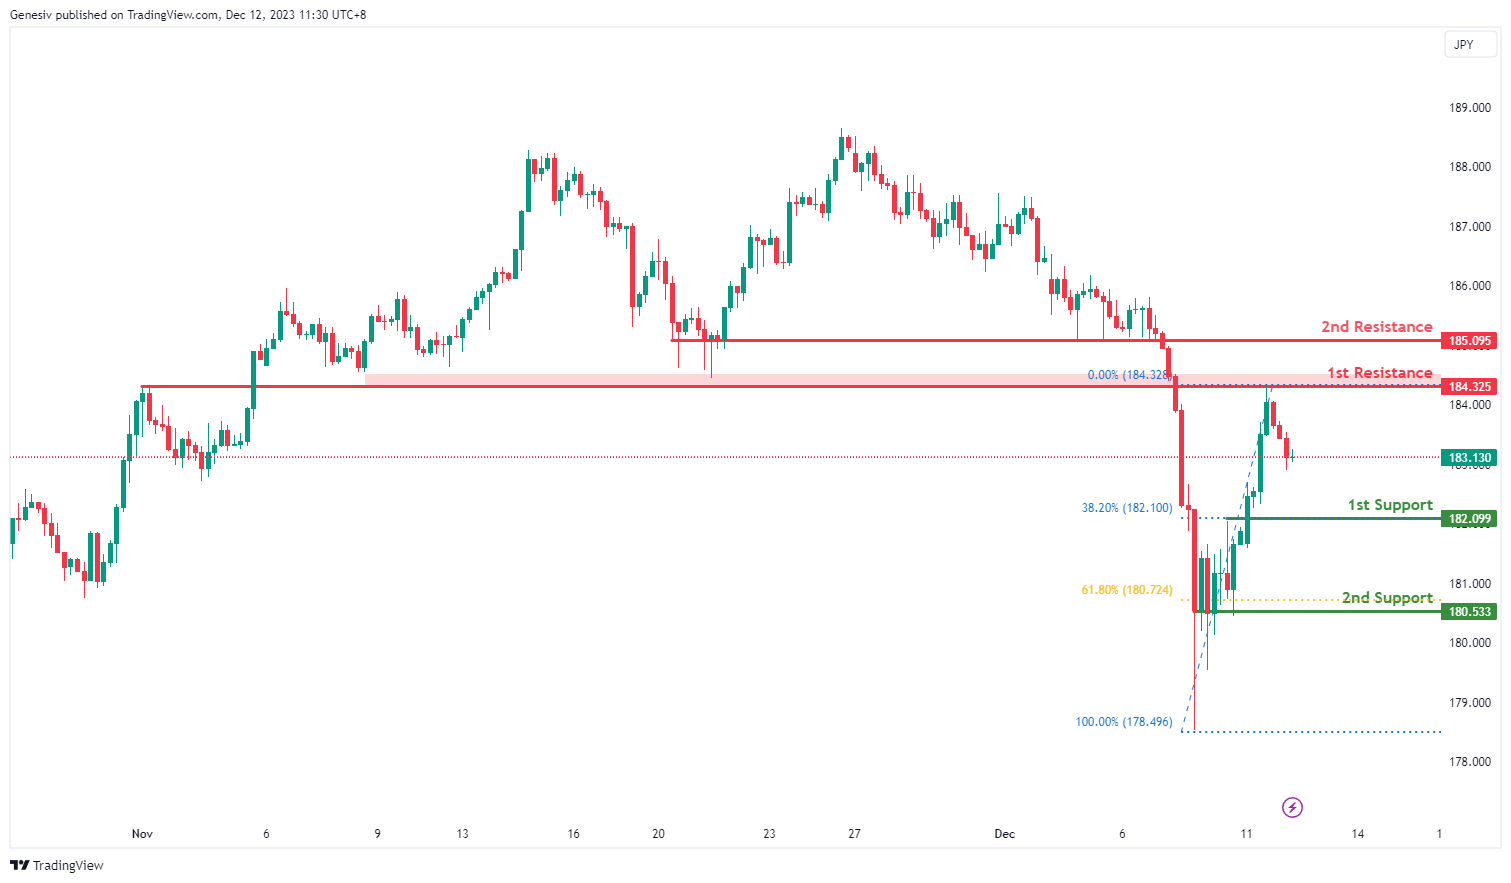
The GBP/JPY chart currently has a bearish overall momentum, indicating a downward trend. In this context, there’s potential for a bearish continuation towards the 1st support level.
The 1st support at 182.09 is identified as a pullback support and coincides with the 38.20% Fibonacci Retracement level. This level is significant as it suggests a potential area where buying interest may emerge, providing temporary support for GBP/JPY.
Further down, the 2nd support at 180.53 is categorized as a multi-swing low support and coincides with the 61.80% Fibonacci Retracement level, making it another important level to watch for potential support.
On the resistance side, the 1st resistance at 184.32 is identified as an overlap resistance, indicating it as a substantial barrier where selling interest could intensify, potentially limiting further upward movements. Additionally, there’s a 2nd resistance at 185.09, which is categorized as a pullback resistance.
USD/CHF:
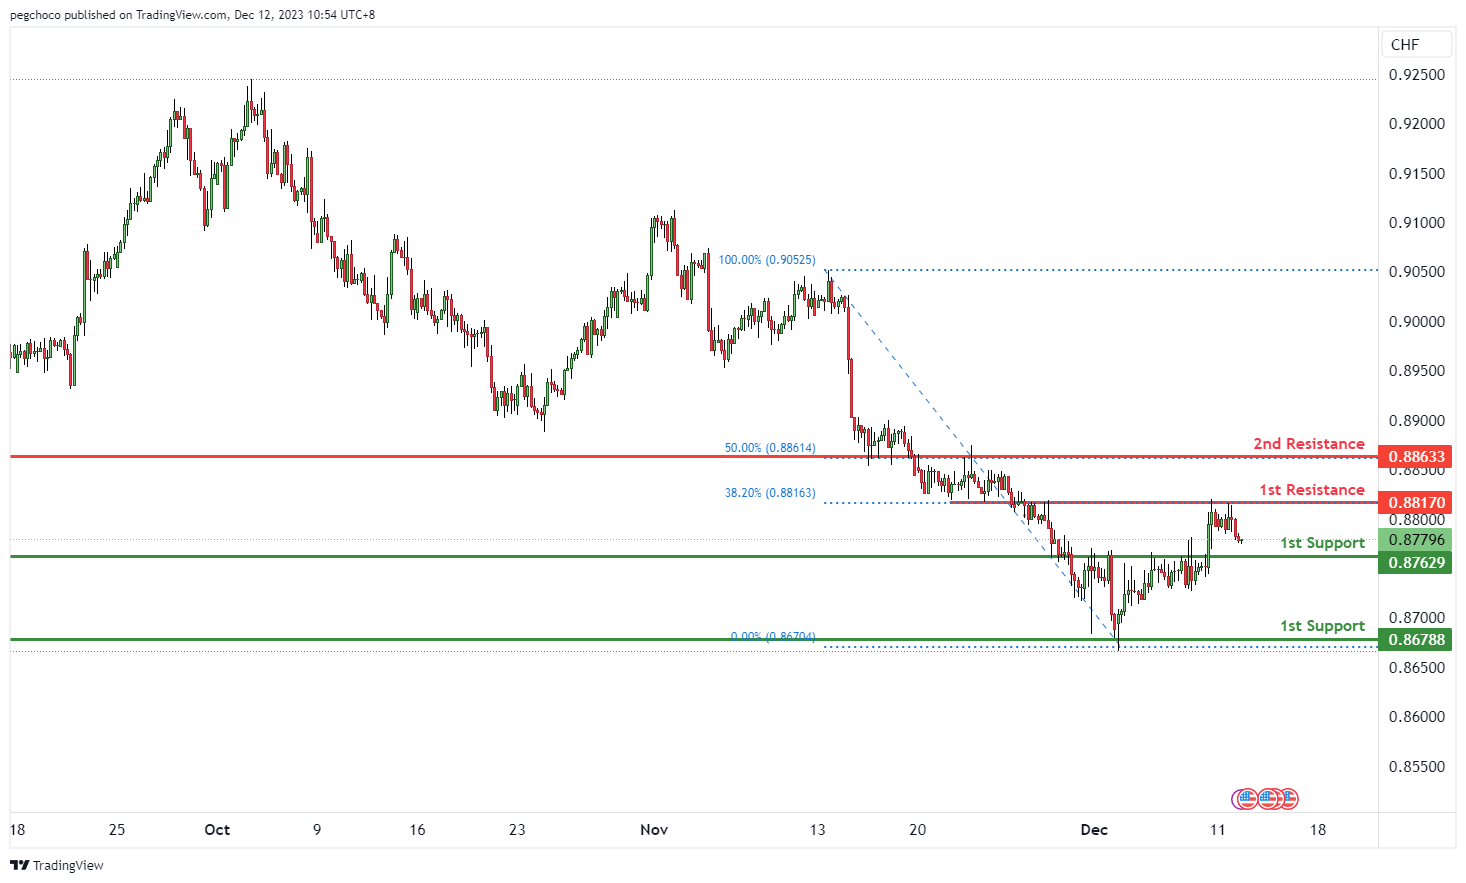
The USD/CHF chart currently demonstrates a bearish overall momentum, indicating a prevailing downward trend. In this context, there’s potential for a bearish continuation towards the 1st support level.
The 1st support at 0.8762 is categorized as a pullback support. This level is significant as it suggests a potential area where buying interest may emerge, providing temporary support for the USD/CHF pair.
The 2nd support at 0.8678 is identified as a multi-swing low support, further reinforcing its importance as a potential level where buyers might become active.
On the resistance side, the 1st resistance at 0.8817 is categorized as an overlap resistance and coincides with the 38.20% Fibonacci Retracement level. This level is likely to act as a substantial barrier where selling interest could intensify, potentially limiting upward movements.
The 2nd resistance at 0.8863 is also categorized as an overlap resistance and coincides with the 50% Fibonacci Retracement level, further indicating its significance as a level where selling pressure may increase.
USD/JPY:
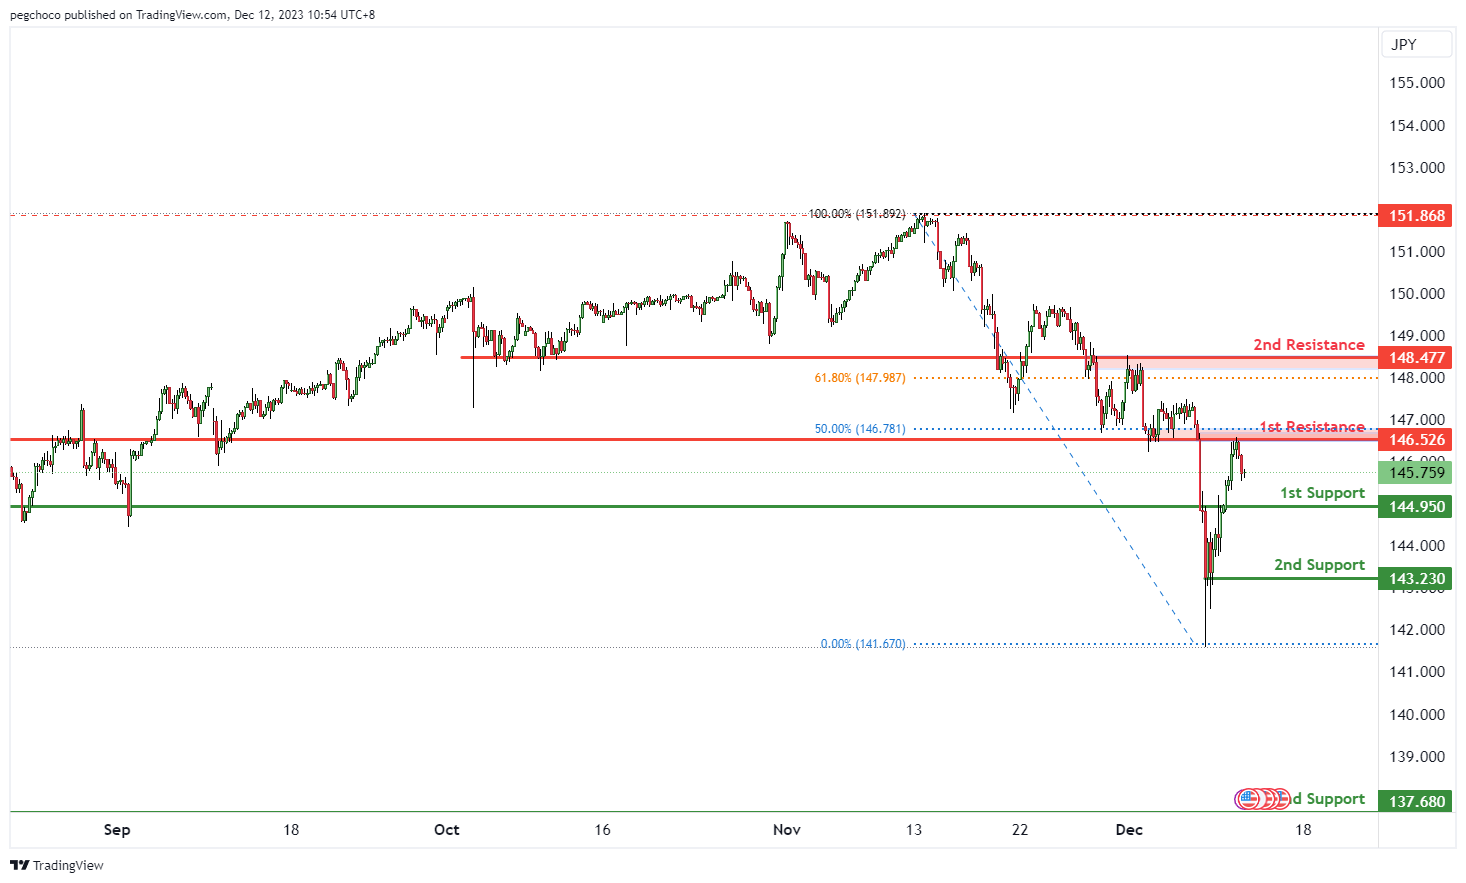
The USD/JPY chart currently exhibits a bearish overall momentum, indicating a prevailing downward trend. In this context, there’s potential for a bearish continuation towards the 1st support level.
The 1st support at 144.95 is categorized as a pullback support. This level is significant as it suggests a potential area where buying interest may emerge, providing temporary support for the USD/JPY pair.
The 2nd support at 143.23 is identified as a multi-swing low support, further reinforcing its importance as a potential level where buyers might become active.
On the resistance side, the 1st resistance at 146.52 is categorized as an overlap resistance and coincides with the 50% Fibonacci Retracement level. This level is likely to act as a substantial barrier where selling interest could intensify, potentially limiting upward movements.
The 2nd resistance at 148.47 is also categorized as an overlap resistance and coincides with the 61.80% Fibonacci Retracement level, further indicating its significance as a level where selling pressure may increase.
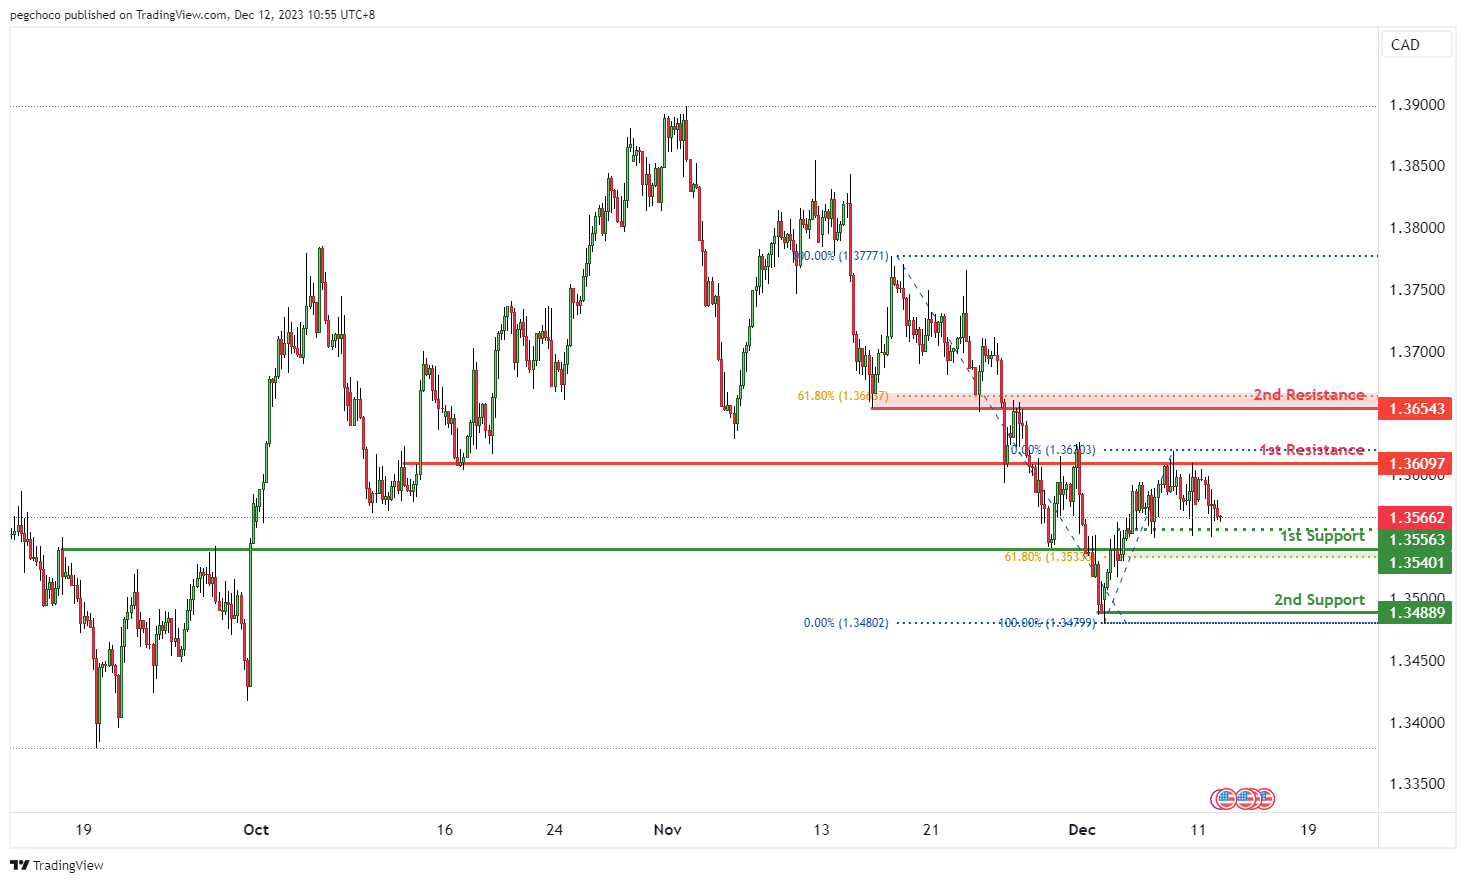
USD/CAD:
The USD/CAD chart currently exhibits a bullish overall momentum, indicating a prevailing upward trend. In this context, there’s potential for a bullish bounce off the 1st support level, leading to a movement towards the 1st resistance.
The 1st support at 1.3540 is categorized as a swing low support and coincides with the 61.80% Fibonacci Retracement level. This level is significant as it suggests a potential area where buying interest may emerge, providing support for USD/CAD prices.
The 2nd support at 1.2488 is identified as a multi-swing low support, further reinforcing its importance as a level where buyers might become active.
On the resistance side, the 1st resistance at 1.3609 is labeled as an overlap resistance. This level is likely to act as a significant barrier where selling interest could intensify, potentially leading to a temporary halt in the bullish movement.
The 2nd resistance at 1.3654 is categorized as an overlap resistance and coincides with the 61.80% Fibonacci Retracement level, suggesting its potential significance as a level where selling pressure may increase.
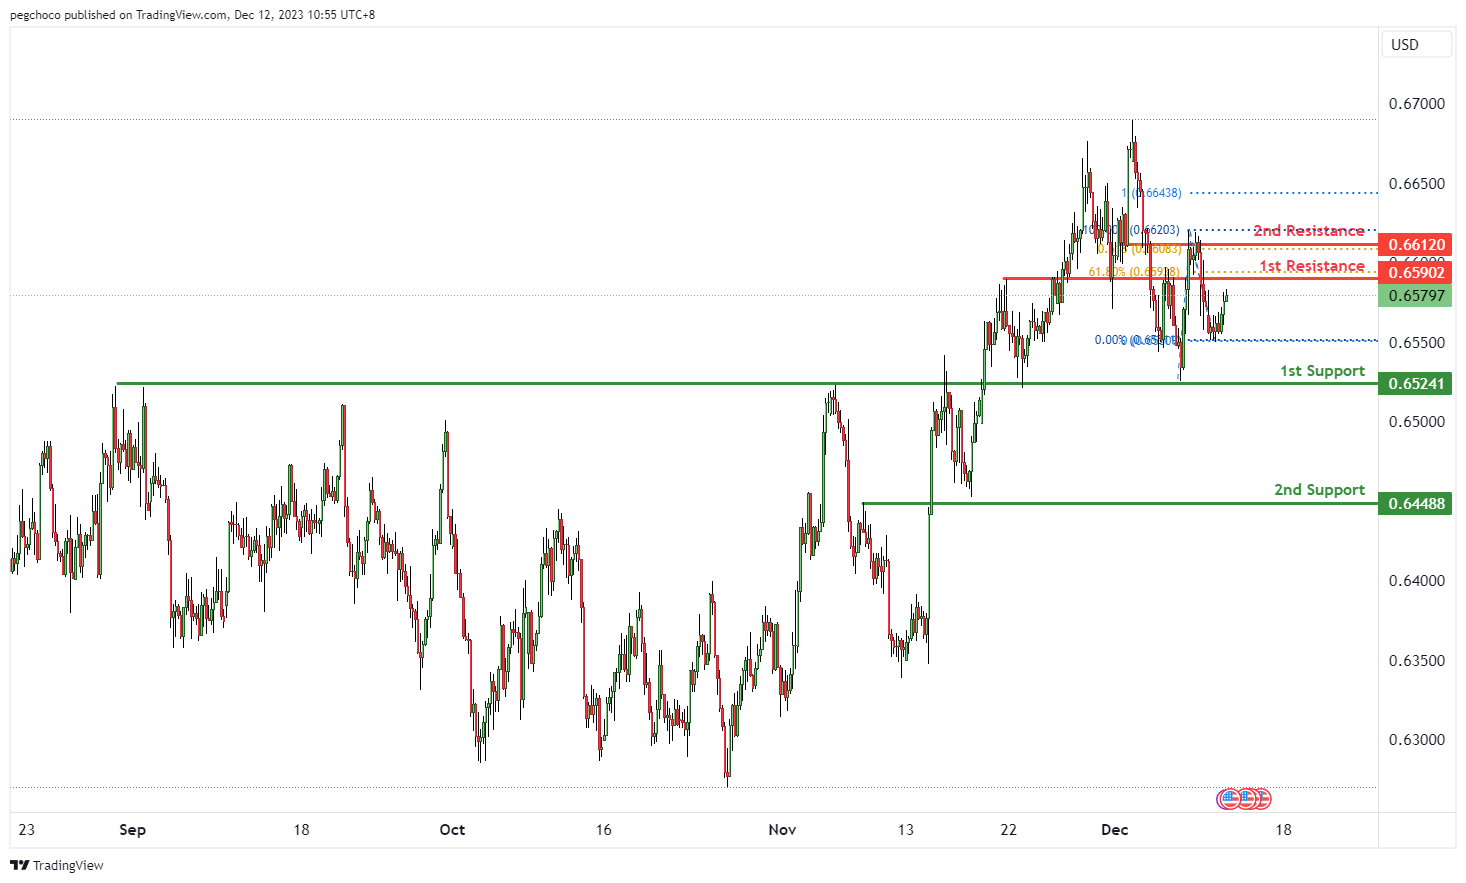
AUD/USD:
The AUD/USD chart currently exhibits a bearish overall momentum, indicating a prevailing downward trend. In this context, there’s potential for a bearish reaction off the 1st resistance level, leading to a drop towards the 1st support.
The 1st support at 0.6524 is categorized as an overlap support, suggesting its significance as a potential level where buying interest may emerge, providing support for AUD/USD prices.
The 2nd support at 0.6448 is also identified as an overlap support, reinforcing its importance as a level where buyers might become active.
On the resistance side, the 1st resistance at 0.6590 is labeled as a pullback resistance. This level is likely to act as a substantial barrier where selling interest could intensify, potentially leading to a bearish reaction.
The 2nd resistance at 0.6612 is categorized as an overlap resistance, and it coincides with the 61.80% Fibonacci Projection, indicating its potential significance as a level where selling pressure may increase.
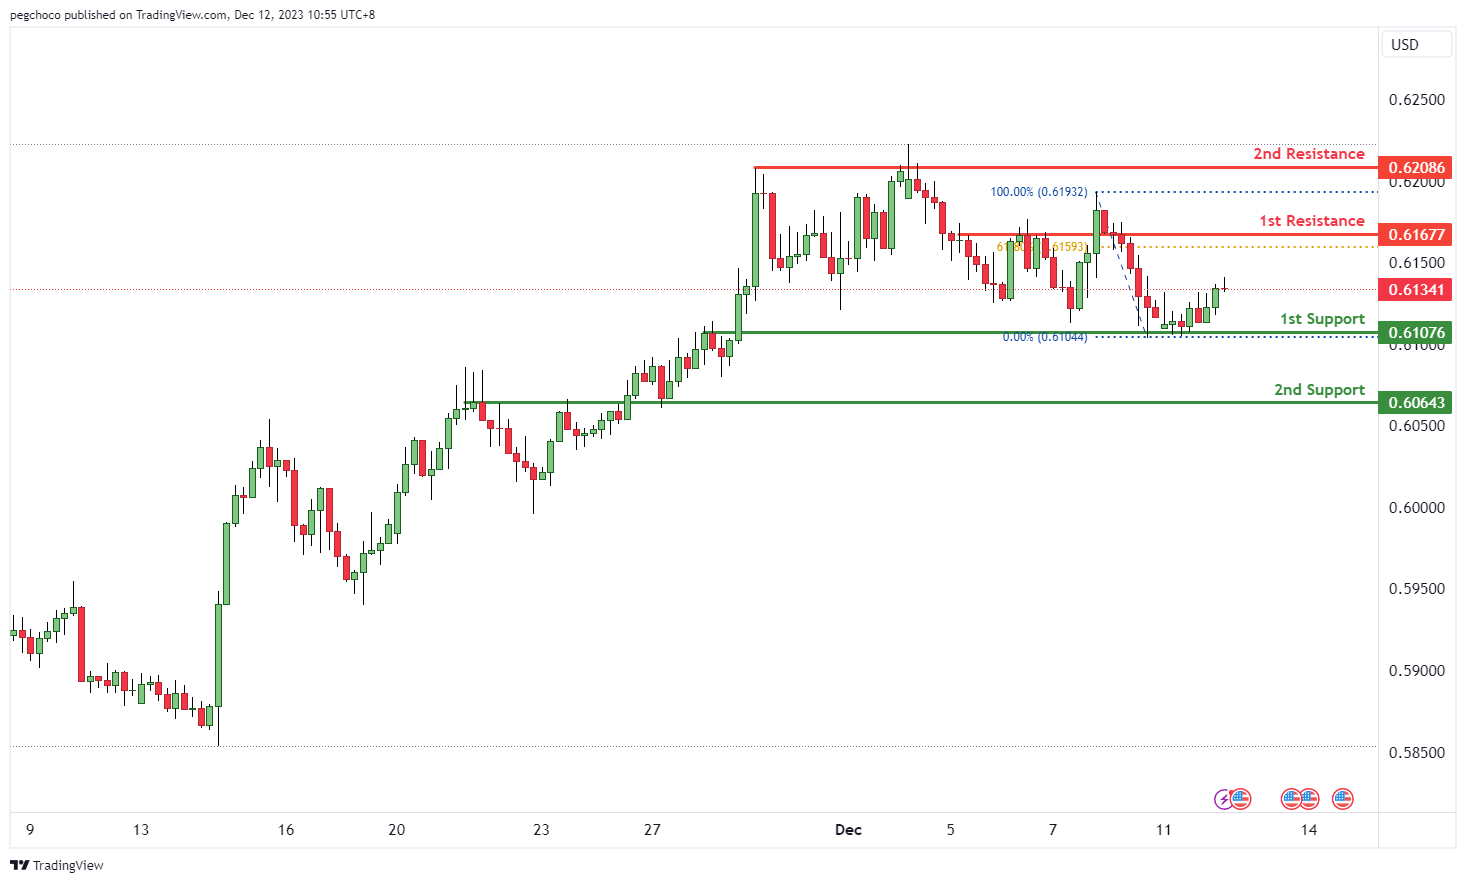
NZD/USD
The NZD/USD chart currently has a bullish overall momentum, indicating a prevailing upward trend. Within this context, there’s potential for a bullish continuation towards the 1st resistance level.
The 1st support at 0.6107 is categorized as an overlap support, suggesting its significance as a potential level where buying interest may emerge, providing support for NZD/USD prices.
The 2nd support at 0.6006 is also identified as an overlap support, further reinforcing its importance as a level where buyers might become active.
On the resistance side, the 1st resistance at 0.6167 is labeled as a pullback resistance. This level is likely to act as a substantial barrier where selling interest could intensify, potentially limiting upward movements.
The 2nd resistance at 0.6208 is categorized as a multi-swing high resistance, indicating its potential significance as a level where selling pressure may increase.
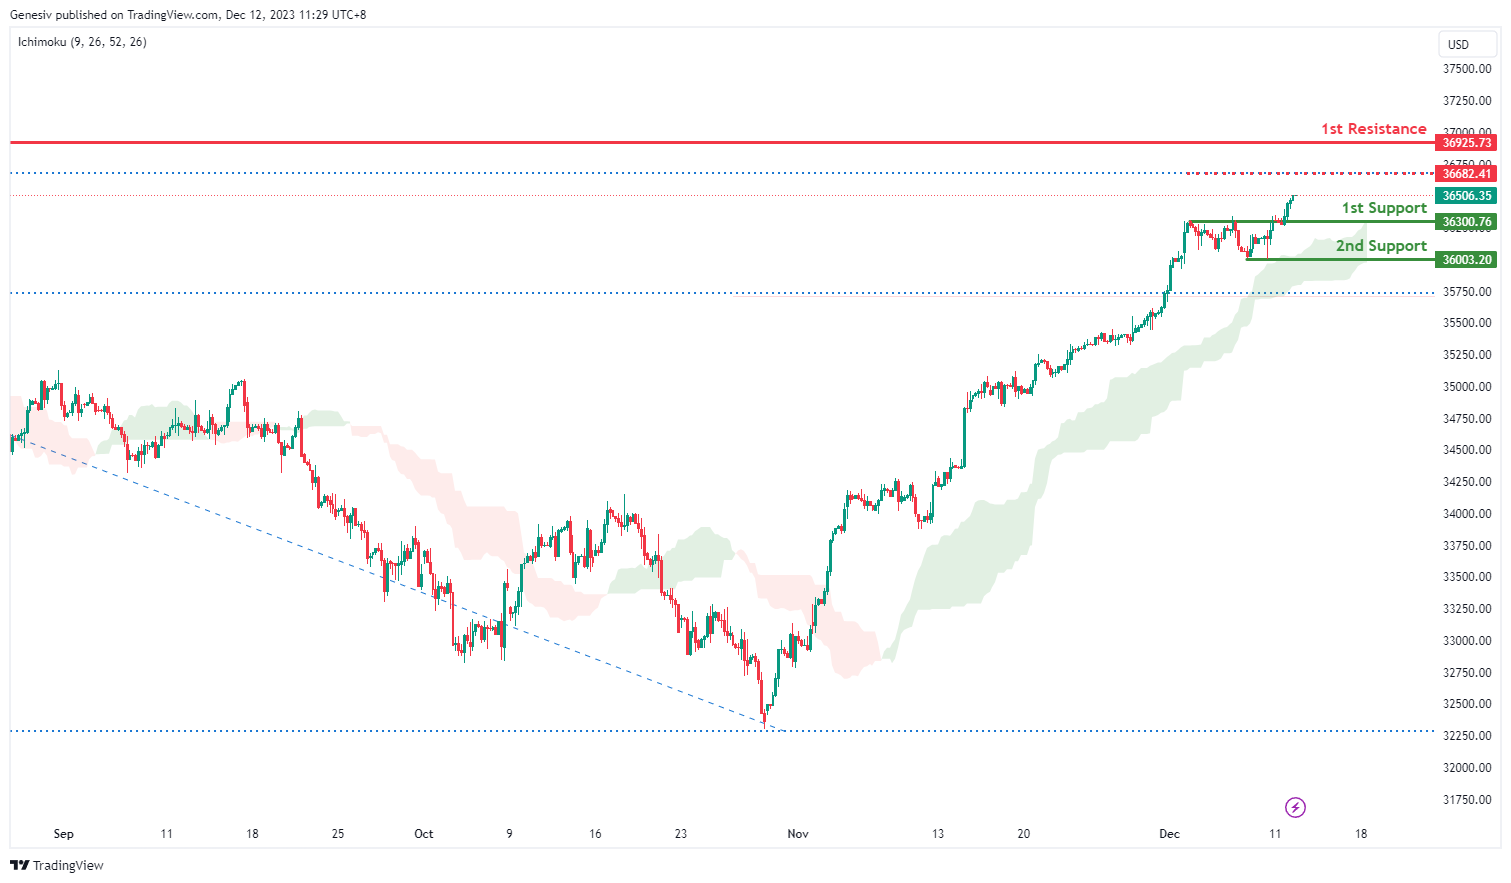
DJ30:
The DJ30 (Dow Jones Industrial Average) chart currently has a bullish overall momentum, with price trading above the bullish Ichimoku cloud, indicating a strong upward trend. In this context, there’s potential for a bullish continuation towards the 1st resistance level.
The 1st support at 36300.76 is identified as an overlap support, suggesting it could be a significant level where buying interest may emerge, providing potential support for the DJ30 index.
On the resistance side, the 1st resistance at 36925.73 is categorized as a swing high resistance, indicating it as a substantial barrier where selling interest could intensify, potentially limiting further upward movements.
Additionally, there’s an intermediate resistance at 36682.41, which coincides with the 127.20% Fibonacci Extension, indicating potential Fibonacci confluence.
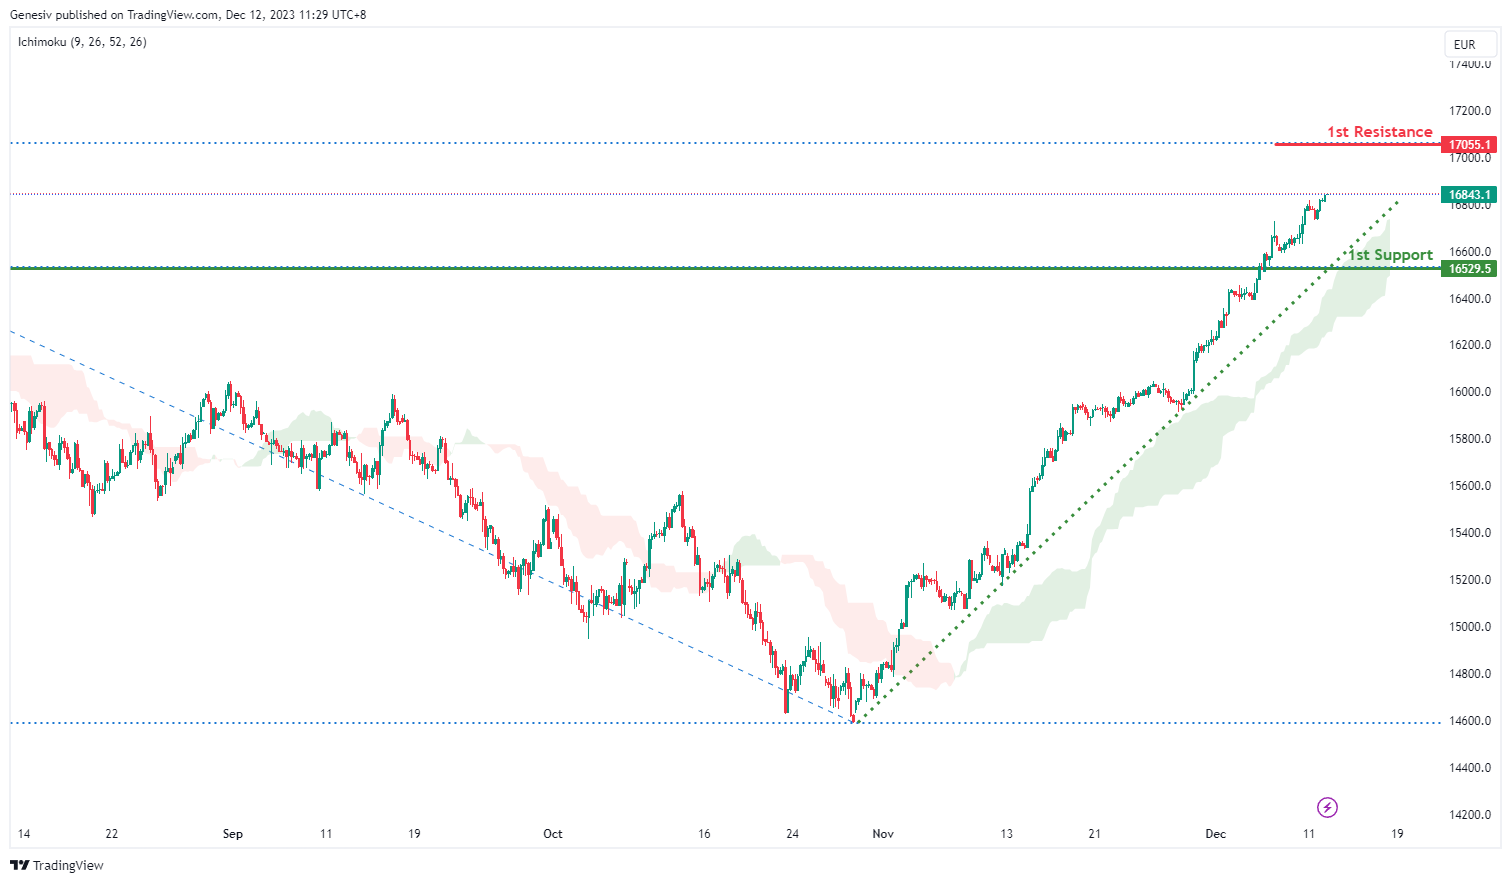
GER40:
The GER40 (DAX) chart currently exhibits a bullish overall momentum, with price trading above a major ascending trend line, indicating a strong upward trend. Within this context, there’s potential for a bullish continuation towards the 1st resistance level.
The 1st support at 16529.5 is categorized as a pullback support, suggesting it could be a significant level where buying interest may emerge, providing temporary support for the GER40 index.
On the resistance side, the 1st resistance at 17055.10 is identified as a level that coincides with the 127.20% Fibonacci Extension, indicating potential Fibonacci confluence.
This level is likely to act as a substantial barrier where selling interest could intensify, potentially limiting further upward movements.
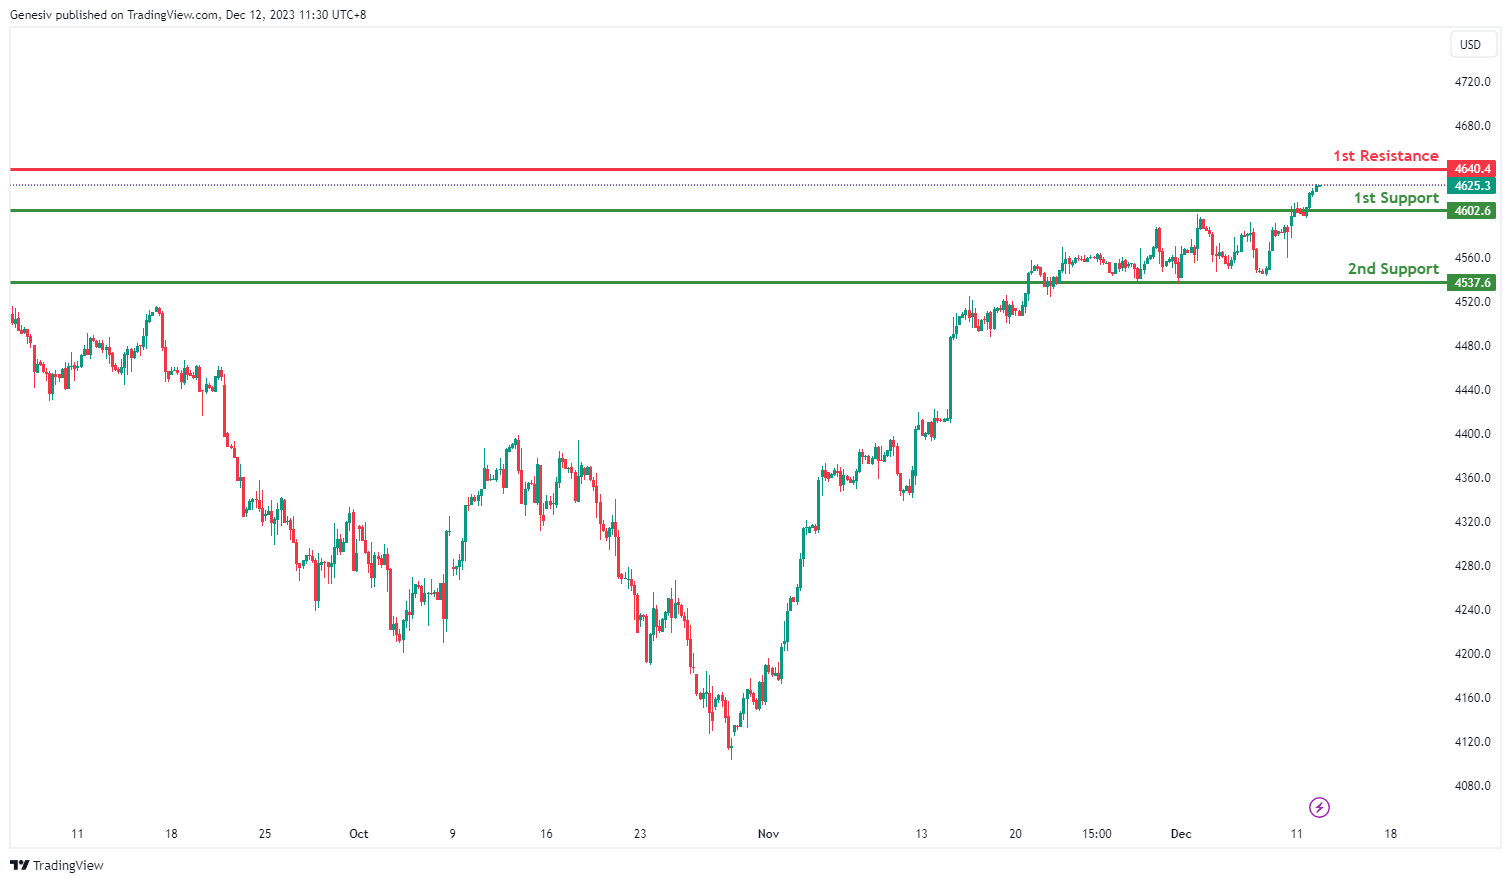
`US500:
The US500 chart currently has a bullish overall momentum, indicating a prevailing upward trend. Within this context, there’s potential for a bullish bounce off the 1st support level, which could lead to a move towards the 1st resistance.
The 1st support at 4602.6 is categorized as a pullback support, indicating that it’s a significant level where buying interest may emerge, potentially providing support for the US500 index.
The 2nd support at 4537.6 is identified as an overlap support, further reinforcing its importance as a potential level where buyers might become active.
On the resistance side, the 1st resistance at 4640.4 is noted as a swing high resistance. This level is likely to act as a substantial barrier where selling interest could intensify, potentially limiting further upward movements.
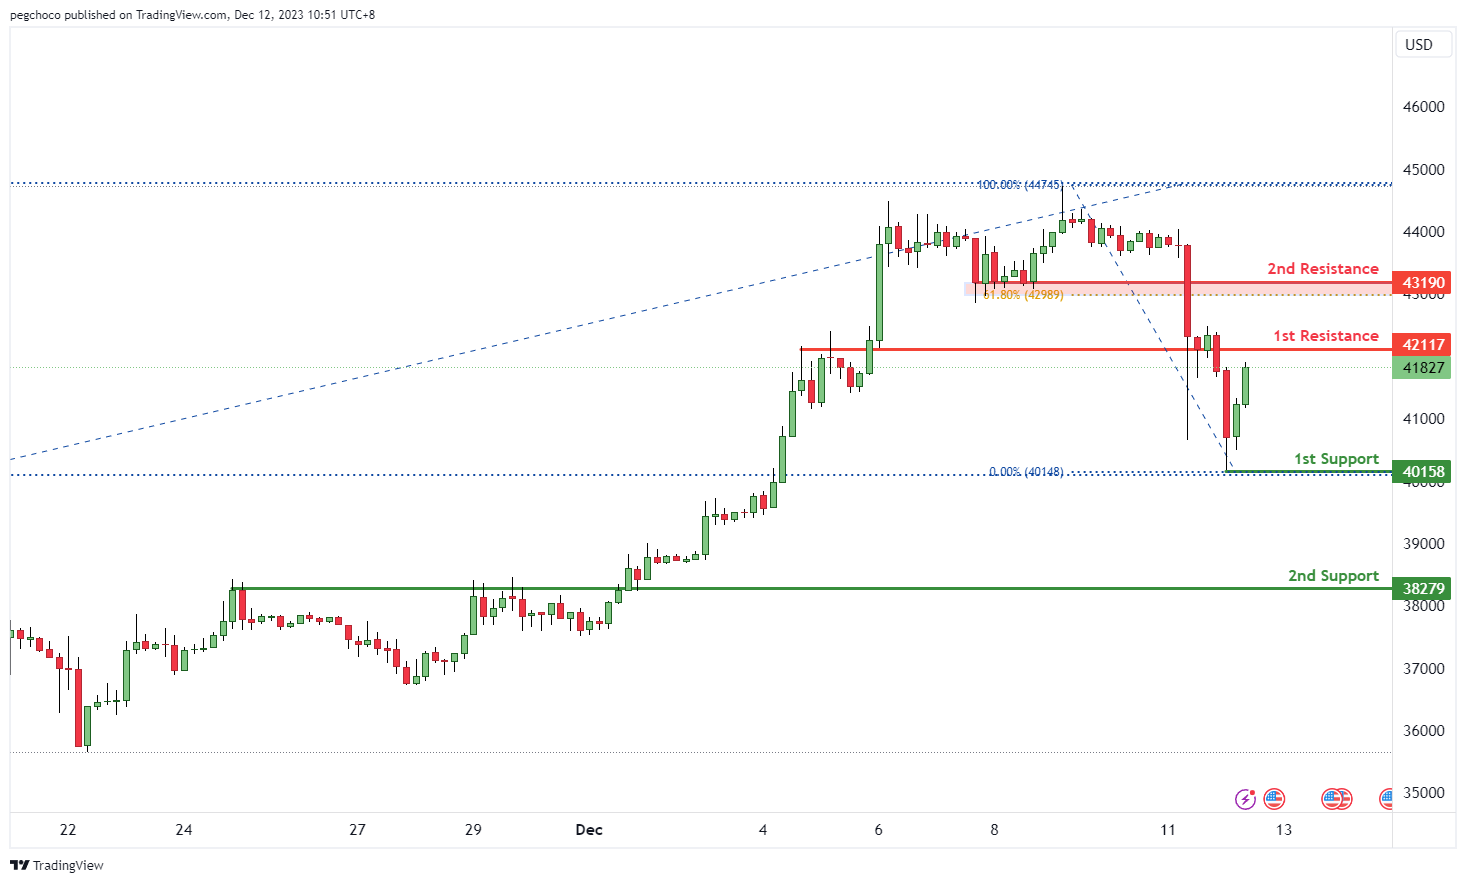
BTC/USD:
he BTC/USD chart currently exhibits a bearish overall momentum, indicating a prevailing downward trend. In this context, there’s potential for a bearish reaction off the 1st resistance level, leading to a drop towards the 1st support.
The 1st support at 40158 is identified as a swing low support, signifying its significance as a potential level where buying interest may emerge, potentially providing support for Bitcoin’s price.
The 2nd support at 38279 is categorized as a pullback support, further reinforcing its importance as a potential area where buyers might become active.
On the resistance side, the 1st resistance at 42117 is noted as a pullback resistance. This level is likely to act as a substantial barrier where selling interest could intensify, potentially triggering a bearish reversal.
Further up, the 2nd resistance at 43190 is characterized as a pullback resistance and coincides with the 61.80% Fibonacci Retracement level, indicating a potential confluence of technical factors that could strengthen it as a level where selling pressure may increase.
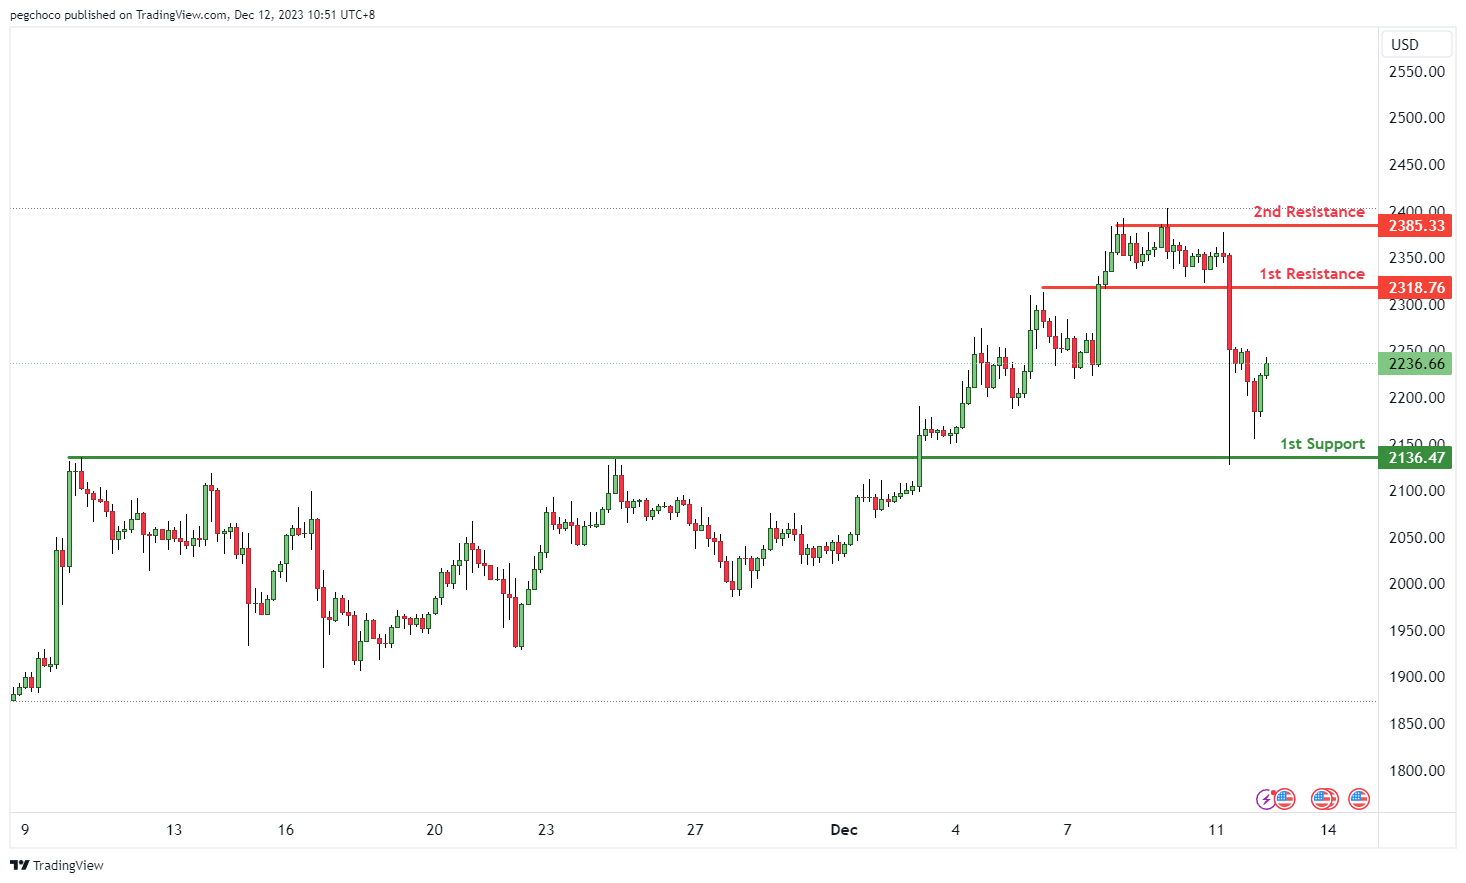
ETH/USD:
The ETH/USD chart currently has a bullish overall momentum, indicating a prevailing upward trend. In this context, there’s potential for a bullish continuation towards the 1st resistance level.
The 1st support at 2136.47 is identified as an overlap support. This level may act as a significant area where buying interest could emerge, providing support for Ethereum’s price.
On the resistance side, the 1st resistance at 2318.76 is categorized as a pullback resistance. This level is likely to serve as a substantial barrier where selling interest could intensify, potentially slowing down or reversing the bullish momentum.
Further up, the 2nd resistance at 2385.33 is labeled as a multi-swing high resistance, reinforcing its significance as a potential level where selling pressure may increase.
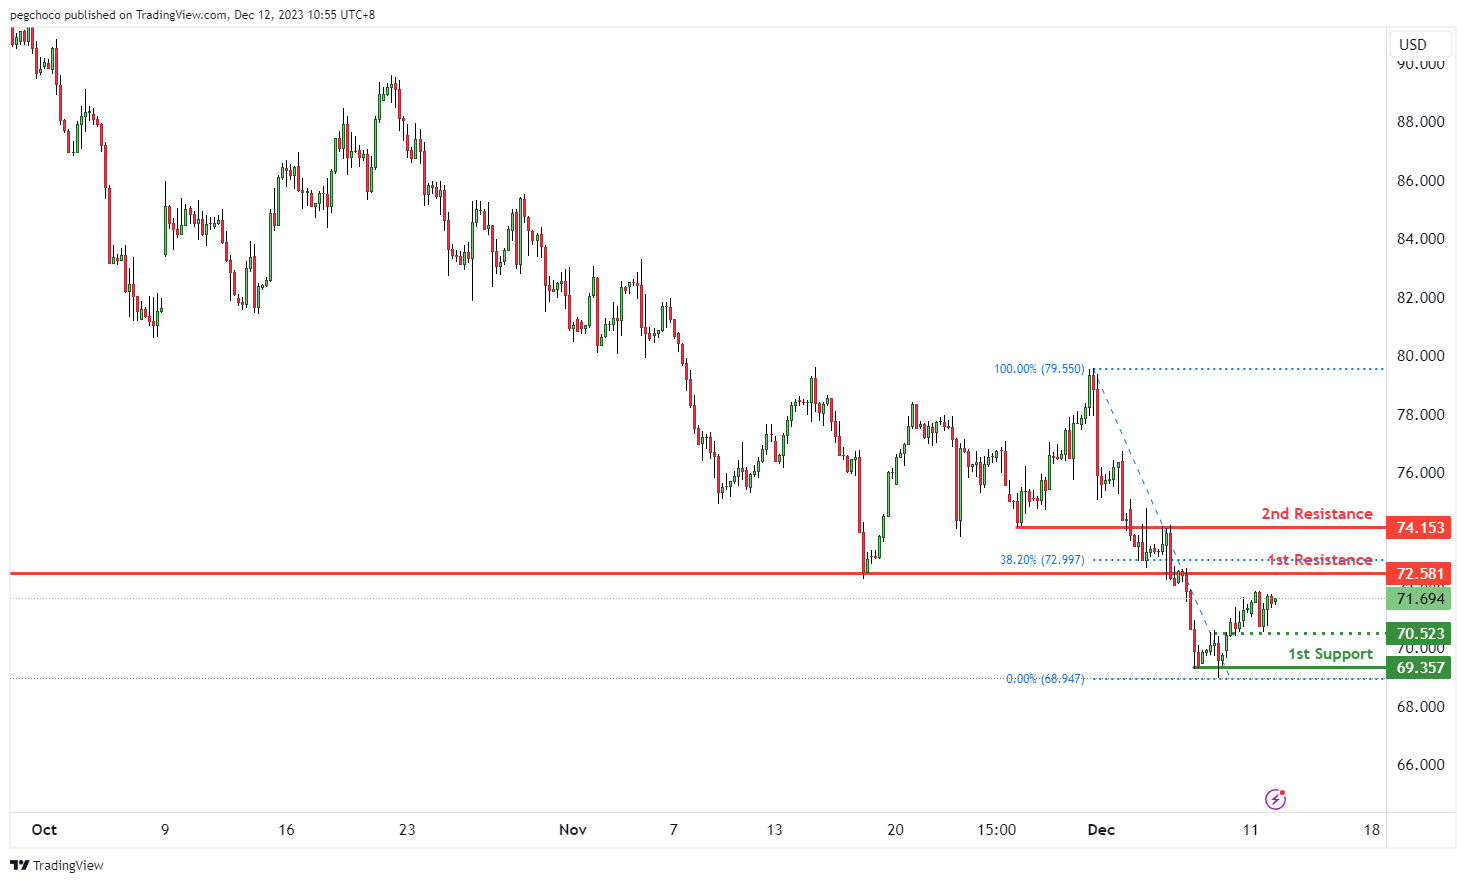
WTI/USD:
The WTI chart currently exhibits a bearish overall momentum, suggesting a prevailing downward trend. Within this context, there’s potential for a bearish reaction off the 1st resistance level, followed by a drop towards the 1st support.
The 1st support at 69.35 is identified as a multi-swing low support, indicating its potential significance as a level where buying interest may emerge, providing temporary support for WTI prices.
The intermediate support at 70.52 is categorized as an overlap support, reinforcing its importance as a potential level where buyers might become active.
On the resistance side, the 1st resistance at 72.58 is labeled as a pullback resistance. This level is likely to act as a substantial barrier where selling interest could intensify, potentially triggering a bearish reversal.
The 2nd resistance at 74.15 is categorized as an overlap resistance, further indicating its potential significance as a level where selling pressure may increase.
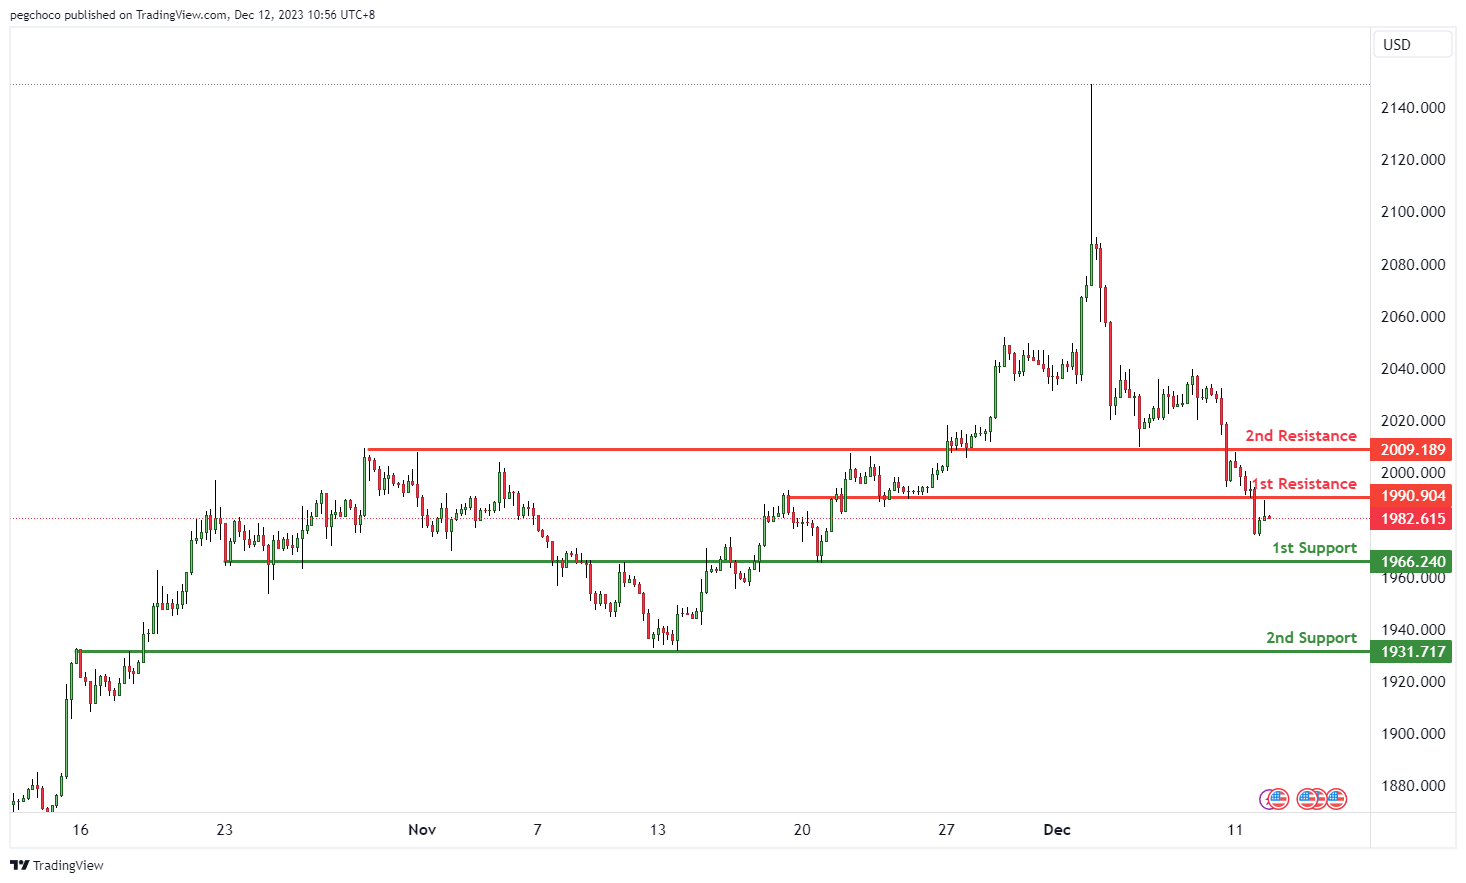
XAU/USD (GOLD):
The XAU/USD chart currently has a bearish overall momentum, suggesting a prevailing downward trend. In this context, there’s potential for a bearish reaction off the 1st resistance level, followed by a drop towards the 1st support.
The 1st support at 1966.24 is identified as an overlap support, indicating its potential significance as a level where buying interest may emerge, providing temporary support for the XAU/USD pair.
The 2nd support at 1931.71 is also categorized as an overlap support, reinforcing its importance as a potential level where buyers might become active.
On the resistance side, the 1st resistance at 1990.90 is labeled as a pullback resistance. This level is likely to act as a substantial barrier where selling interest could intensify, potentially triggering a bearish reversal.
The 2nd resistance at 2009.18 is categorized as an overlap resistance, further indicating its potential significance as a level where selling pressure may increase.
The accuracy, completeness and timeliness of the information contained on this site cannot be guaranteed. IC Markets does not warranty, guarantee or make any representations, or assume any liability regarding financial results based on the use of the information in the site.
News, views, opinions, recommendations and other information obtained from sources outside of www.icmarkets.com, used in this site are believed to be reliable, but we cannot guarantee their accuracy or completeness. All such information is subject to change at any time without notice. IC Markets assumes no responsibility for the content of any linked site.
The fact that such links may exist does not indicate approval or endorsement of any material contained on any linked site. IC Markets is not liable for any harm caused by the transmission, through accessing the services or information on this site, of a computer virus, or other computer code or programming device that might be used to access, delete, damage, disable, disrupt or otherwise impede in any manner, the operation of the site or of any user’s software, hardware, data or property.


