
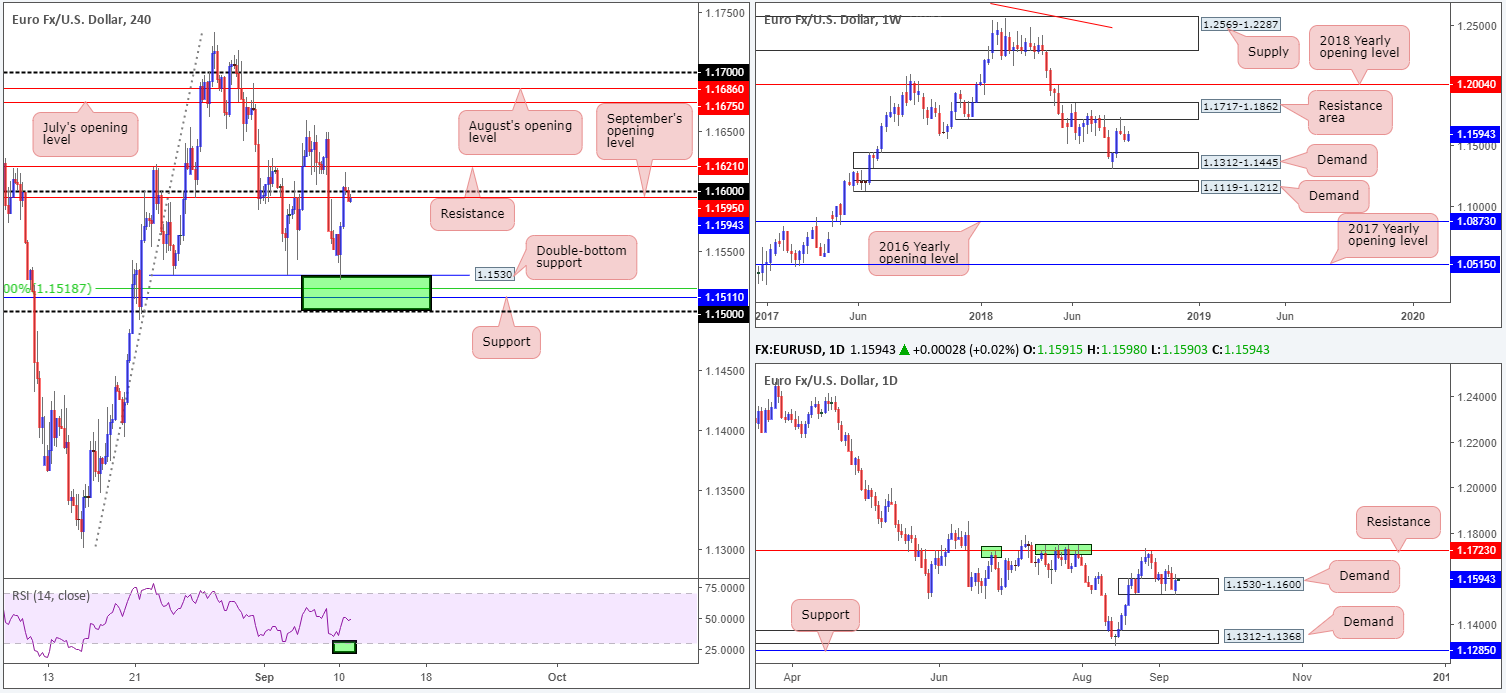
EUR/USD:
For those who read Monday’s report you may recall the team underlined a possible H4 buy zone marked in green at 1.15/1.1530 (comprised of a round number at 1.15, a support barrier with reasonably strong history at 1.1511, a 50.0% support value at 1.1518 and a double-bottom support at 1.1530). As you can see, the H4 candles responded to the top edge of this base yesterday and catapulted north towards the 1.16 handle. Headlines reporting the EU is preparing to give Brexit negotiator Barnier instructions to close a deal with the UK was, as far as we can see, the main catalyst behind the recent move higher.
Daily demand at 1.1530-1.1600 remains in the fold, though price did pierce the lower edge of its base yesterday by a couple of pips. To the upside, daily resistance at 1.1723 is likely the next base on the hit list, whereas a break to the downside has the daily demand area penciled in at 1.1312-1.1368 to target. For those who follow the weekly timeframe, technicals show a resistance area in play at 1.1717-1.1862 (the current daily resistance is seen within the lower limits of this base) and a demand zone coming in at 1.1312-1.1445 (also holds the current daily demand area within its lower boundaries).
Areas of consideration:
Having seen yesterday’s action end the day closing back beneath the 1.16 handle on the H4 timeframe after testing highs of 1.1616, we could witness the sellers re-enter the fray sometime soon. Would this be a high-probability short, though? Technically speaking, with the exception of September’s opening level at 1.1595 and a resistance seen at 1.1621, there is not much to hold price lower on the H4 scale. Both weekly and daily movement show room to stretch as far north as the 1.17s. Therefore, enter short with caution, traders!
In the event price follows the higher-timeframe lead and prints a H4 close above H4 resistance at 1.1621, longs on any retest of this level as support (preferably in the shape of a bullish candlestick formation), targeting July’s opening level at 1.1675 as an initial target, could be an option.
Today’s data points: German ZEW economic sentiment.
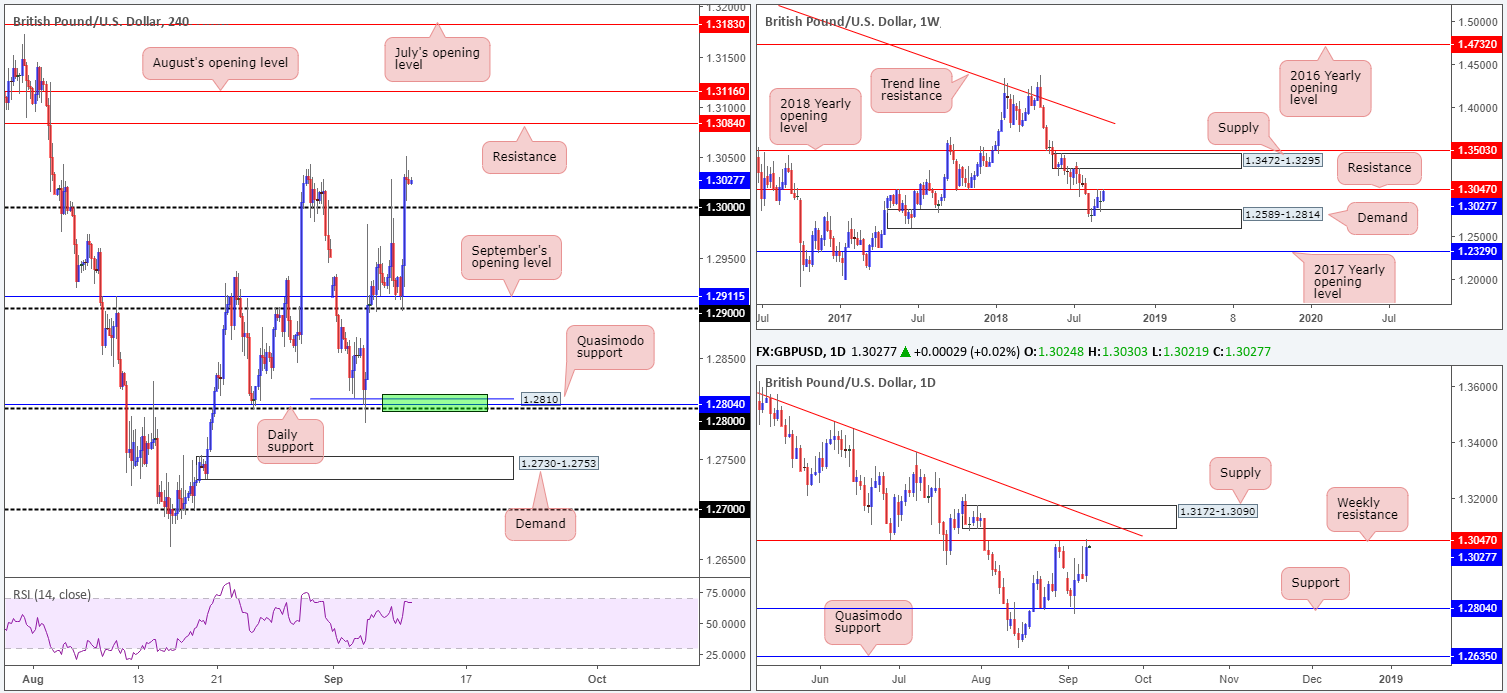
GBP/USD:
Amid the early hours of London’s session on Monday a slew of UK macroeconomic data hit the wire, though failed to generate much of a direction. Shortly after, however, headlines reporting the EU is preparing to give Brexit negotiator Barnier instructions to close a deal with the UK firmly boosted demand for the pound against its US rival, consequently pulling the GBP/USD above the key figure 1.30.
While the majority of the market likely have eyes on a retest of 1.30 today, targeting H4 resistance plotted at 1.3048, it’s always a good idea to have the bigger picture in mind, too! Weekly price, thanks to yesterday’s advance, brought resistance at 1.3047 into view. Another point worth considering on the higher timeframes is the daily picture. Directly above the aforementioned weekly resistance level, a daily supply zone at 1.3172-1.3090 that intersects with a descending trend line resistance (taken from the high 1.3472) is observed.
Areas of consideration:
Even though a retest off of 1.30 could still work out, a long in this market, as you can probably imagine, would effectively place you against potential higher-timeframe sellers! With that being the case, we’ve labelled a buy off of 1.30 with a red flag, which simply indicates a cautionary approach is recommended.
Should our analysis be correct and H4 price reclaims the 1.30 band, shorts beneath this number on a retest would certainly be something to consider, targeting September’s opening level at 1.2911, followed by the 1.29 handle.
Today’s data points: UK employment figures.
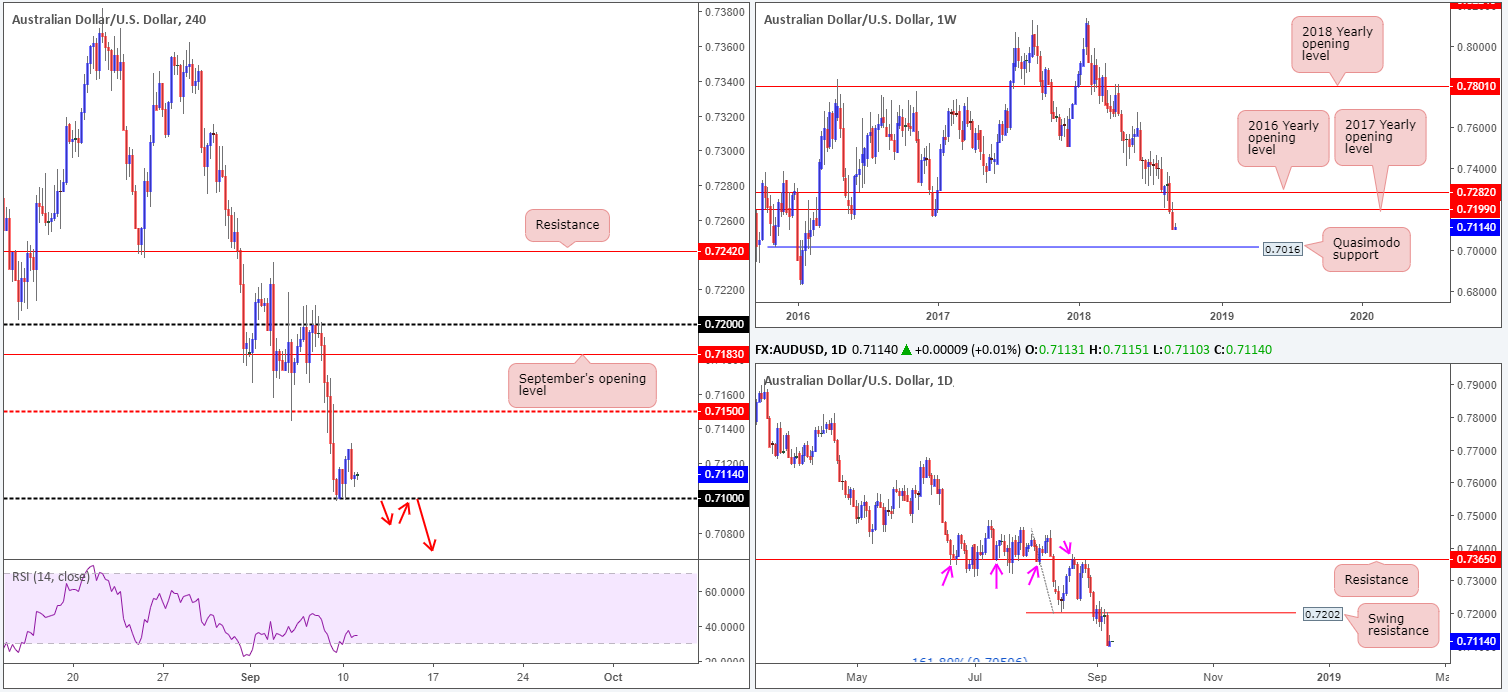
AUD/USD:
As can be seen on the H4 timeframe this morning, the commodity currency remains buoyed above the 0.71 handle as the unit grinded its way to highs of 0.7131 on Monday, before mildly paring gains. Chinese inflation figures reported a hotter-than-expected reading, though it was unable to spark much of a reaction.
The AUD/USD, which has been entrenched within an established downtrend for some time now, could be in for further selling according to the higher-timeframe picture:
- The Australian dollar sustained additional losses last week, ending the session producing a near-full-bodied weekly bearish candle. The selloff seen from the underside of the 2017 yearly opening level at 0.7199 has yet to reach notable support, with the next obvious barrier not coming into view until around 0.7016: a weekly Quasimodo support.
- Daily swing resistance at 0.7202 did a superb job in capping upside last week. To the left of current price, active demand is also limited (it appears the areas were consumed as price rallied higher in February 2016) until we reach possible daily support at 0.7050: a 161.8% Fib ext. point (taken from the high 0.7453), followed closely by the weekly Quasimodo support mentioned above at 0.7016.
Areas of consideration:
Having seen limited support visible on the higher timeframes until reaching the 0.7050 point, entering long from 0.71 is still not considered a high-probability play.
In light of this, traders are likely watching for a H4 close to form beneath 0.71. This, along with a retest to the underside of this number as resistance molded in the shape of a bearish candlestick formation (stop-loss placement governed by the pattern for those looking to sell) would, technically speaking, likely draw in additional sellers to push towards 0.7050: the daily 161.8% Fib ext. support.
Today’s data points: AUD NAB business confidence.
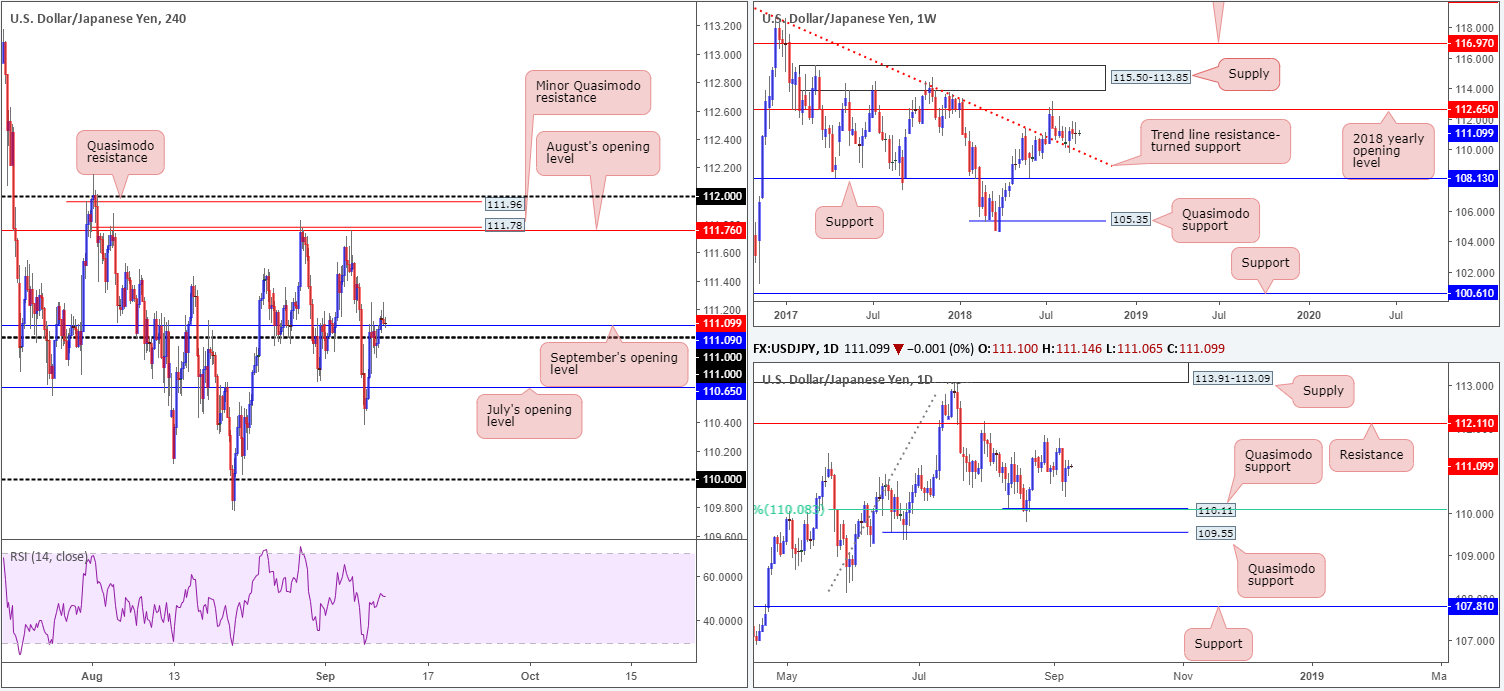
USD/JPY:
The aftermath of Friday’s optimistic US job’s report sent the US dollar higher against its Japanese counterpart, consequently reclaiming the 111 handle on the H4 timeframe. USD/JPY bulls continued to defend 111 during trade on Monday, marginally breaking/retesting September’s opening level seen nearby at 111.09. From this point, traders’ crosshairs are likely fixed on August’s opening level at 111.76, as it fuses with a minor Quasimodo resistance at 111.78. What’s also attractive is the Quasimodo resistance seen at 111.96. Aside from this level merging closely with the 112 handle, the apex (112.15) of the Quasimodo formation is strengthened by a daily resistance level seen at 112.11.
The story on the weekly timeframe shows the pair strongly retested a trend line resistance-turned support (taken from the high 123.57) a few weeks back, though has so far failed to generate much upside presence. Having seen this line hold firm as resistance on a number of occasions in the past, however, it’s likely to remain a defensive barrier going forward. Further buying from current price has the 2018 yearly opening level at 112.65 to target.
Areas of consideration:
Assuming buyers remain defensive above 111/111.09, a stretch up to at least August’s opening level seen on the H4 timeframe at 111.76 could be on the cards. For those interested in buying the retest off 111.09 currently in motion, waiting and seeing if H4 price can form a bullish candlestick formation could be something to consider, since not only will this inform traders that buyer intent exists here, it also provides an entry and a location to position stop-loss orders.
The H4 Quasimodo resistance level mentioned above at 111.96 also remains a worthy contender for possible shorts. Having seen daily resistance at 112.11 reinforcing the top edge of this Quasimodo formation, placing stop-loss orders above the Quasimodo apex at around 112.17ish is an option.
Today’s data points: Limited.
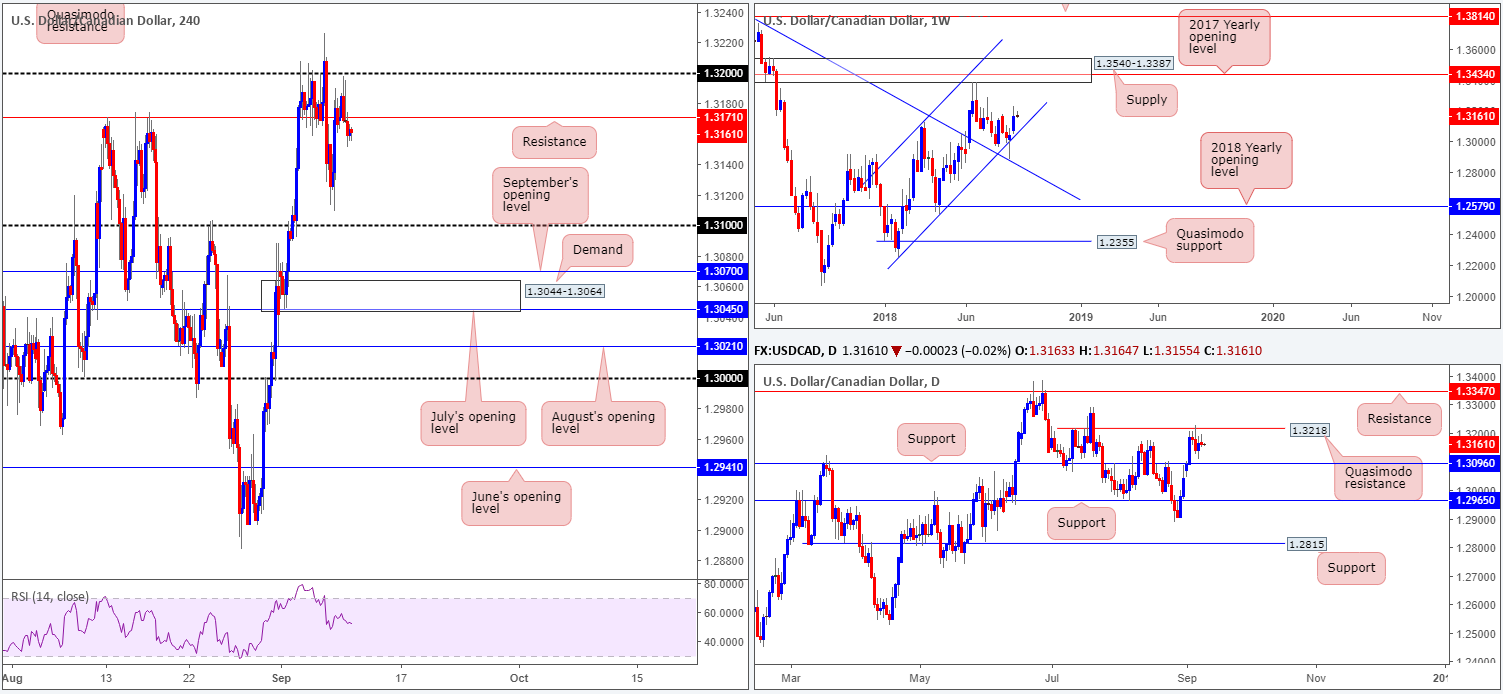
USD/CAD:
The USD/CAD began the week emphasizing a slightly subdued tone. The US dollar index remains motionless above its 95 mark, while the H4 candles on the USD/CAD failed to conquer the 1.32 handle, consequently concluding the day back beneath resistance penciled in at 1.3171. Beneath here, the 1.31 handle, September’s opening level at 1.3070 and the H4 demand base at 1.3044-1.3064 are the next downside targets observed on this scale.
The higher-timeframe picture, on the other hand, shows the weekly candles have been compressing within an ascending channel formation (1.2247/1.3098) since the beginning of the year. Of late, the market responded to the lower edge of this channel (almost crossing paths with a nearby trend line resistance-turned support [etched from the high 1.4689]), and thus far has maintained a strong bullish tone. Continued buying on this scale has the supply zone at 1.3540-1.3387 in view.
A closer look at price action on the daily timeframe shows us the pair recently elbowed into a Quasimodo resistance level drawn from 1.3218, forcing candle action to close just north of a support level marked at 1.3096. Beyond the current Quasimodo resistance, apart from the July 20 high at 1.3289, traders may want to pencil in resistance at 1.3347 should the market decide to punch higher this week. A break of 1.3096 to the downside, nonetheless, has the support level at 1.2965 to target.
Areas of consideration:
In a nutshell, the structure of this market can be boiled down to the following:
- Weekly price suggests additional upside could be seen as we’re coming from the lower edge of its long-term channel.
- Daily price is encased between a Quasimodo resistance level and a nearby support band, and is, therefore, labelled ‘directionless’ at the moment.
- H4 price closed beneath resistance, indicating further selling is possibly in the offing today/early this week.
With this in mind, we feel the best course of action is to pencil in a few notable areas on the H4 scale and watch how H4 price action responds before making a trading decision:
- A retest to the underside of the current H4 resistance in the shape of a bearish candlestick formation is likely enough to draw in sellers towards 1.31 (stop-loss orders should be positioned in accordance with the candlestick formation).
- The 1.32 handle is also attractive for shorts, though traders need to prepare for the possibility of a fakeout above this level to the daily Quasimodo resistance mentioned above at 1.3218.
- The 1.31 handle is worthy of note for possible longs, seeing as daily support at 1.3096 is positioned just beneath it.
- Demand at 1.3044-1.3064 is also likely of interest to buyers. Note this area houses July’s opening level at 1.3045 and is located just beneath September’s opening level mentioned above at 1.3070.
Today’s data points: Limited.
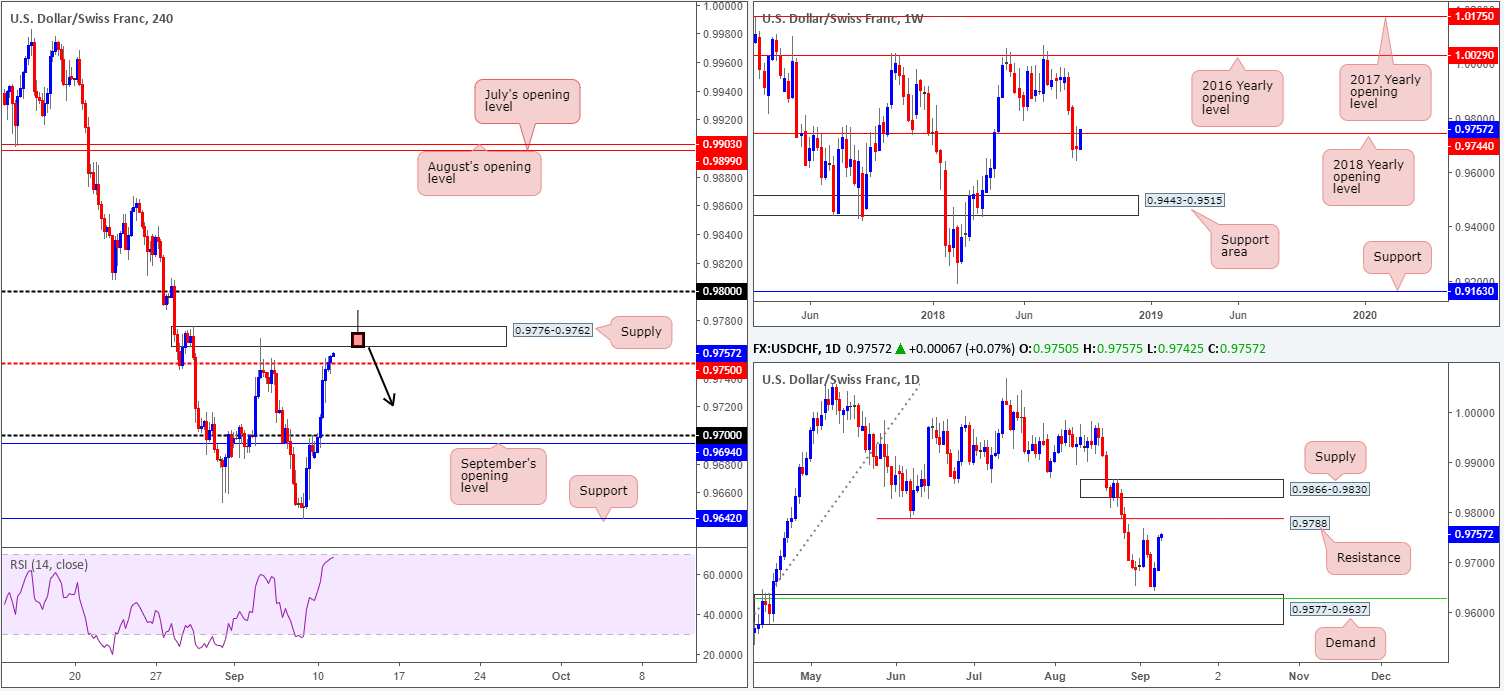
USD/CHF:
USD/CHF bulls were in fine form on Monday, as traders abandoned the safe-haven Swiss Franc in favor of the US dollar amid improved market sentiment. Conquering the 0.97 handle in early London hours, the H4 candles concluded the session shaking hands with a mid-level resistance at 0.9750. The other key thing to note here is the nearby supply zone seen at 0.9776-0.9762, which is likely watched by a number of traders this morning as a candidate for potential shorts.
Thanks to yesterday’s advance, weekly price retested the underside of the 2018 yearly opening level at 0.9744. From a technical standpoint, we do not imagine the pair trading too far beyond this structure, as daily price is seen nearing the September 4 high at 0.9767, shadowed closely by a swing resistance at 0.9788.
Areas of consideration:
The current H4 supply at 0.9776-0.9762, although a solid area, could suffer a break to the upside. We say this simply because daily resistance at 0.9788 is positioned just above the zone! For that reason, traders who are considering shorts from this base may want to contemplate waiting for additional candle confirmation to form before pulling the trigger here.
An ideal setup to keep eyes on this morning is a H4 bearish pin-bar formation that pierces through the top edge of the current H4 supply and taps the daily swing resistance level at 0.9788 (see the chart for a visual representation), targeting 0.97 as the initial take-profit level. Not only will this move take out stop-loss orders above supply (providing bigger players liquidity to sell), it’ll also bring daily sellers into the equation.
Today’s data points: Limited.
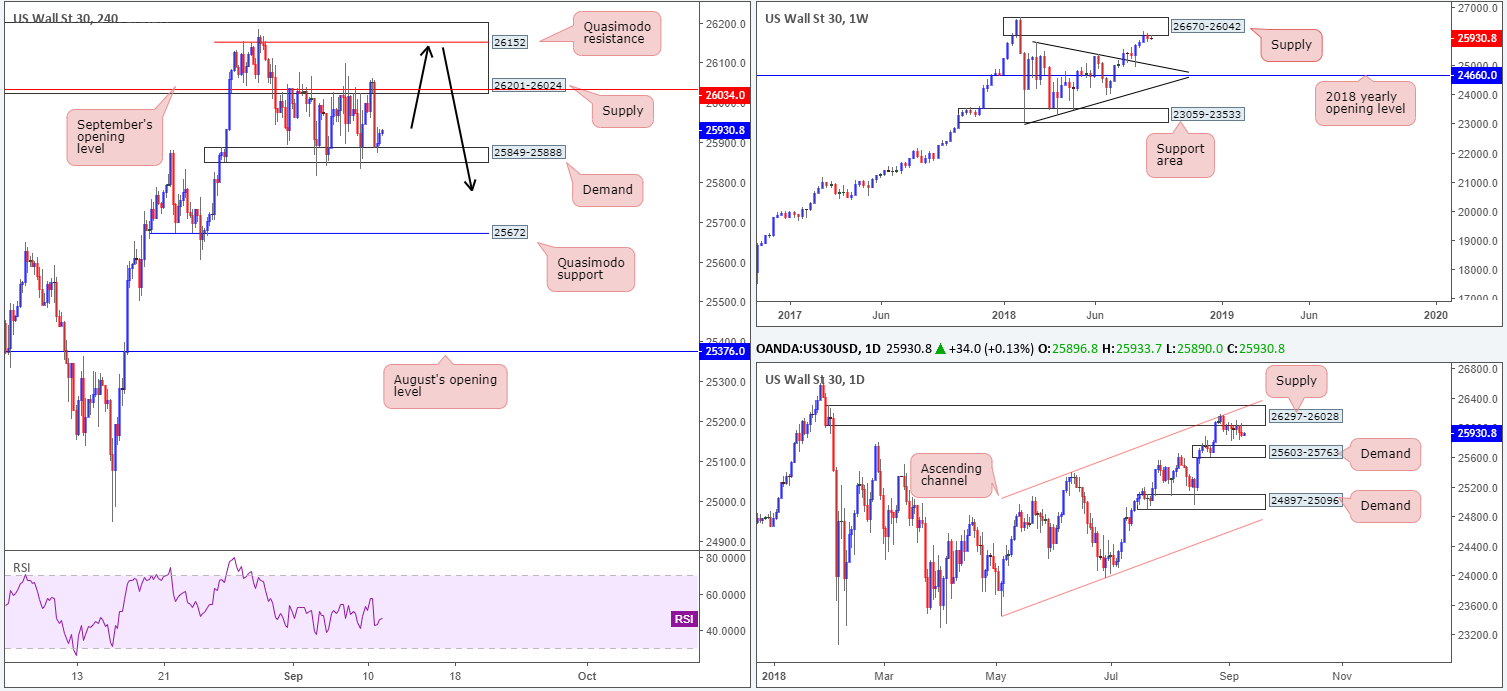
Dow Jones Industrial Average:
Over the past week US equities entered into a lull, confined between the lower edge of a H4 supply at 26201-26024 (and September’s opening level at 26034) and a H4 demand base coming in at 25849-25888. Also worth noting is the current demand is showing signs of weakness, given the number of times its lower edge has been penetrated, potentially clearing the path south towards the H4 Quasimodo support level at 25672.
In terms of the bigger picture, the index ended last week breaking a three-week bullish phase after price engaged with the lower edge of a weekly supply at 26670-26042, following a strong retest off a trend line resistance-turned support (etched from the high 25807) a few weeks back. On the daily timeframe, strong supply at 26297-26028 remains in the fold. What gives this area credibility comes down to the following:
- Downside momentum drawn from the base is incredibly strong.
- The zone intersects with a nearby daily channel resistance (taken from the high 25399).
- Glued to the underside of the aforesaid weekly supply area.
Areas of consideration:
As the current H4 supply at 26201-26024 is enormous, entering short from the H4 Quasimodo resistance level seen within the upper limits of the area at 26152 could be something to consider this week (see black arrows), as this level offers the more favorable risk/reward conditions. This also gives traders the option of positioning stops above the H4 supply, targeting the H4 demand area mentioned above at 25849-25888 as the initial take-profit zone, followed then by the top edge of daily demand at 25603-25763 (next downside target on the daily scale) and then the H4 Quasimodo support level at 25672.
Today’s data points: Limited.
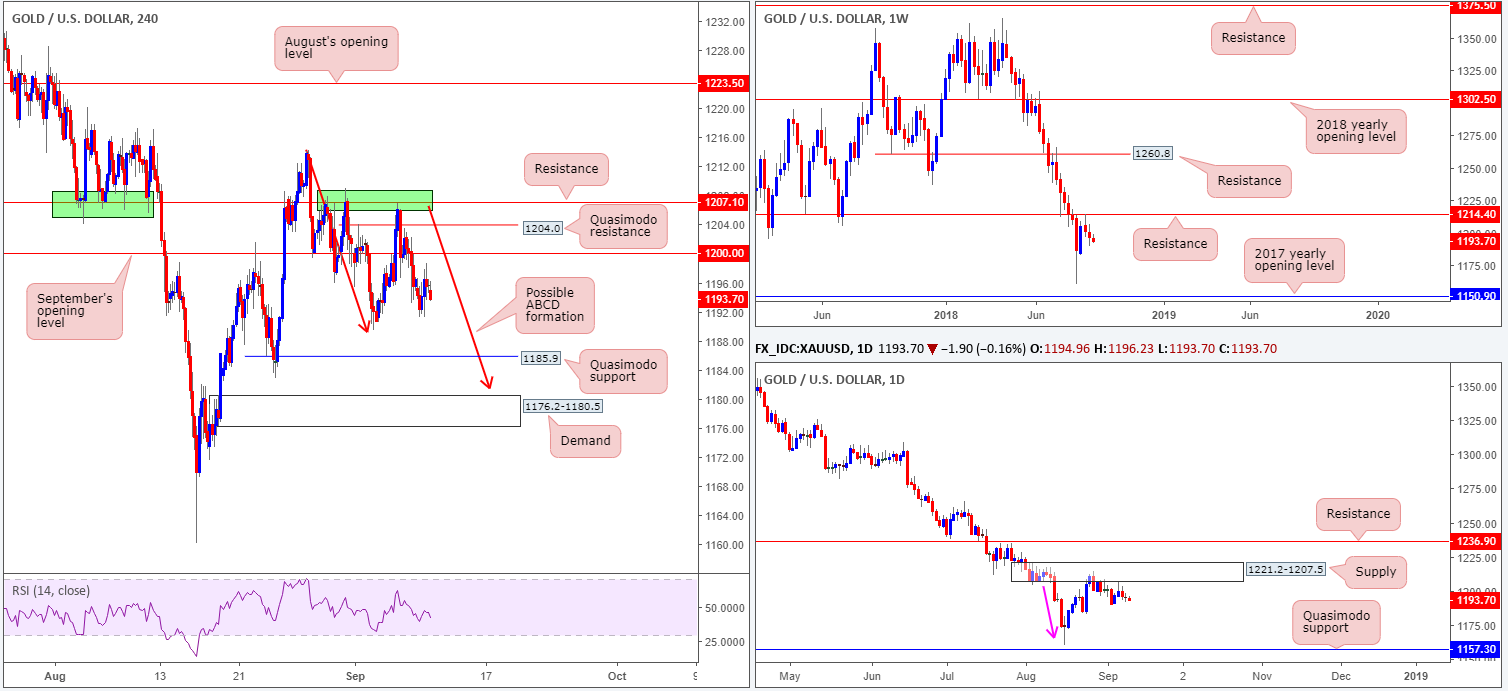
XAU/USD (Gold)
Gold prices are effectively unchanged this morning, ranging no more than $7 on Monday. In light of this lackluster performance, much of the following report will echo similar thoughts put forward in Monday’s briefing…
Kicking off with the weekly timeframe, the unit registered its second consecutive weekly loss last week as the yellow metal remains in negative territory beneath resistance marked at 1214.4. Further downside from this point could eventually stretch as far south as the 2017 yearly opening level at 1150.9.
In conjunction with weekly flow, daily movement is seen checking in with a nice-looking supply zone at 1221.2-1207.5. Aside from this zone displaying attractive downside momentum from its base (see pink arrow), it could also be considered the ‘decision point’ to print 2018 yearly lows of 1160.3. Couple this with the fact we are also coming off weekly resistance, we potentially have ourselves some strong sellers in the mix.
The after-effects of Friday’s better-than-expected US non-farm payrolls report for August drove bullion to lows of 1193.2 as the USD received a strong bid which helped the DXY conquer 95.00. In the event the H4 candles search for lower levels today, the September 4 low at 1189.4 is the next base of support to keep an eye on, followed closely by a Quasimodo support at 1185.9. Another notable point on the H4 scale is the possible completion of an ABCD formation (see red arrows) at 1181.3, sited just north of a demand area penciled in at 1176.2-1180.5.
Areas of consideration:
According to the higher-timeframe picture, we feel this market is eyeing lower prices. Longer term, the daily Quasimodo support at 1157.3 is a logical target, followed closely by the 2017 yearly opening level at 1150.9 on the weekly timeframe.
Intraday, a retest to the underside of either September’s opening level at 1200.0, the H4 Quasimodo resistance level at 1204.0 or the resistance level seen directly above this base at 1207.2 (in line with the underside of daily supply mentioned above at 1221.2-1207.5) is possible today. A H4 bearish candlestick formation printed off of either one of these levels can be considered a high-probability shorting opportunity (stop-loss orders should be positioned in line with the candle pattern seen), when taking into account the overall technical picture. As for intraday take-profit targets, the H4 supports mentioned above in bold are an option.
The use of the site is agreement that the site is for informational and educational purposes only and does not constitute advice in any form in the furtherance of any trade or trading decisions.
The accuracy, completeness and timeliness of the information contained on this site cannot be guaranteed. IC Markets does not warranty, guarantee or make any representations, or assume any liability with regard to financial results based on the use of the information in the site.
News, views, opinions, recommendations and other information obtained from sources outside of www.icmarkets.com.au, used in this site are believed to be reliable, but we cannot guarantee their accuracy or completeness. All such information is subject to change at any time without notice. IC Markets assumes no responsibility for the content of any linked site. The fact that such links may exist does not indicate approval or endorsement of any material contained on any linked site.
IC Markets is not liable for any harm caused by the transmission, through accessing the services or information on this site, of a computer virus, or other computer code or programming device that might be used to access, delete, damage, disable, disrupt or otherwise impede in any manner, the operation of the site or of any user’s software, hardware, data or property.


