
A note on lower timeframe confirming price action…
Waiting for lower timeframe confirmation is our main tool to confirm strength within higher timeframe zones, and has really been the key to our trading success. It takes a little time to understand the subtle nuances, however, as each trade is never the same, but once you master the rhythm so to speak, you will be saved from countless unnecessary losing trades. The following is a list of what we look for:
- A break/retest of supply or demand dependent on which way you’re trading.
- A trendline break/retest.
- Buying/selling tails/wicks – essentially we look for a cluster of very obvious spikes off of lower timeframe support and resistance levels within the higher timeframe zone.
- Candlestick patterns. We tend to only stick with pin bars and engulfing bars as these have proven to be the most effective.
We search for lower timeframe confirmation between the M15 and H1 timeframes, since most of our higher-timeframe areas begin with the H4. Stops are usually placed 5-10 pips beyond confirming structures.
EUR/USD:
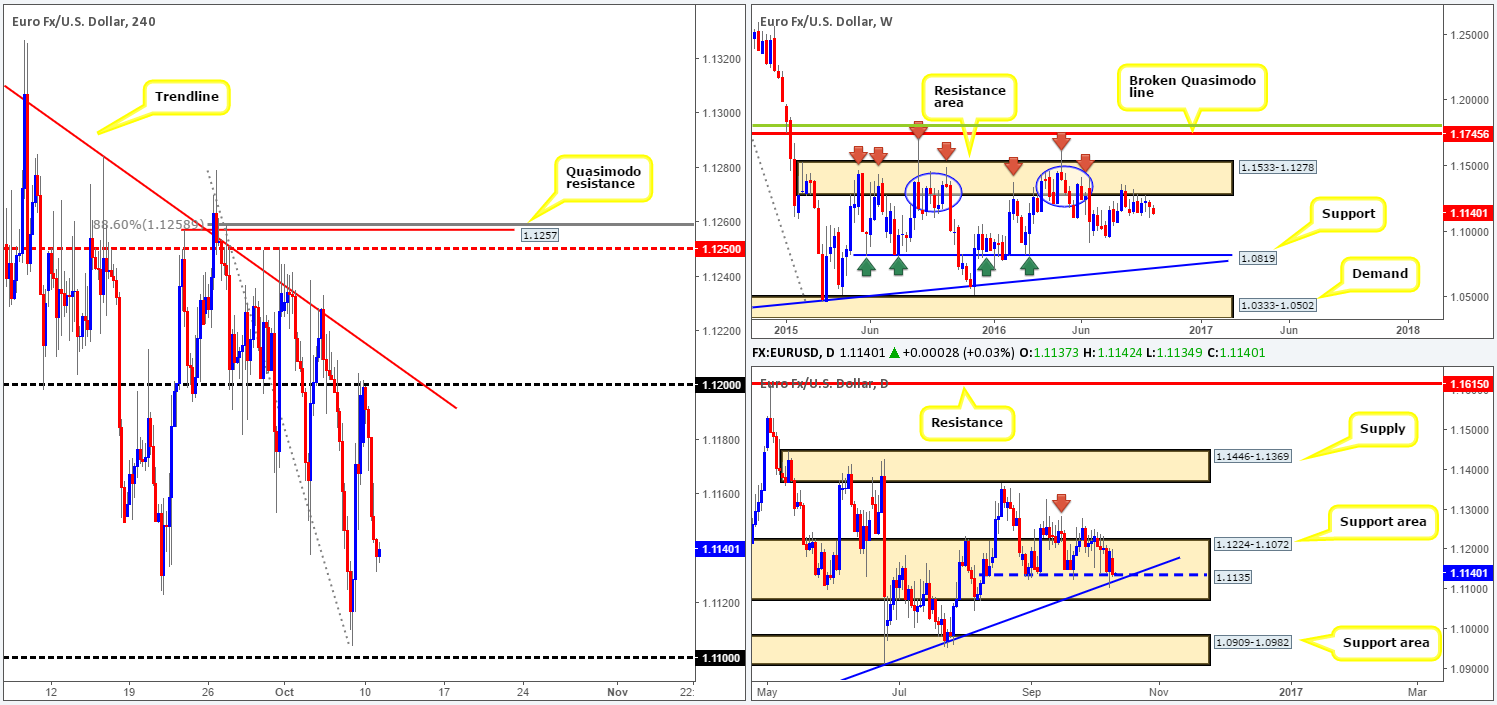
Despite US banks being closed in observance of Columbus Day, we saw the US dollar edge higher yesterday, consequently dragging the single currency lower from the 1.12 neighborhood. What you’ll likely also notice is that this move has positioned the daily candles back around support coming in at 1.1135. This support, as you can probably see, merges beautifully with a trendline support taken from the low 1.0516 and is housed within a support area seen at 1.1224-1.1072.
Nevertheless, with weekly action trading from the underside of a major resistance area seen at 1.1533-1.1278, the H4 may continue to push lower to test the 1.11 handle today, possibly providing support for a fakeout scenario below the current daily support.
Our suggestions: As far as selling goes, we see very little worth mentioning at this time. Longs from the 1.11 boundary, nonetheless, could be something to consider today given the support being seen from the daily timeframe (see above). However, we’d advise only entering into a position here should the H4 candles chalk up a bullish close off this number, since not only would you be trading against weekly resistance, but also due to the fact that psychological handles are generally prone to fakeouts.
Levels to watch/live orders:
- Buys: 1.11 region ([H4 bullish candle required prior to pulling the trigger] Stop loss: beyond the trigger candle).
- Sells: Flat (Stop loss: N/A).
GBP/USD:
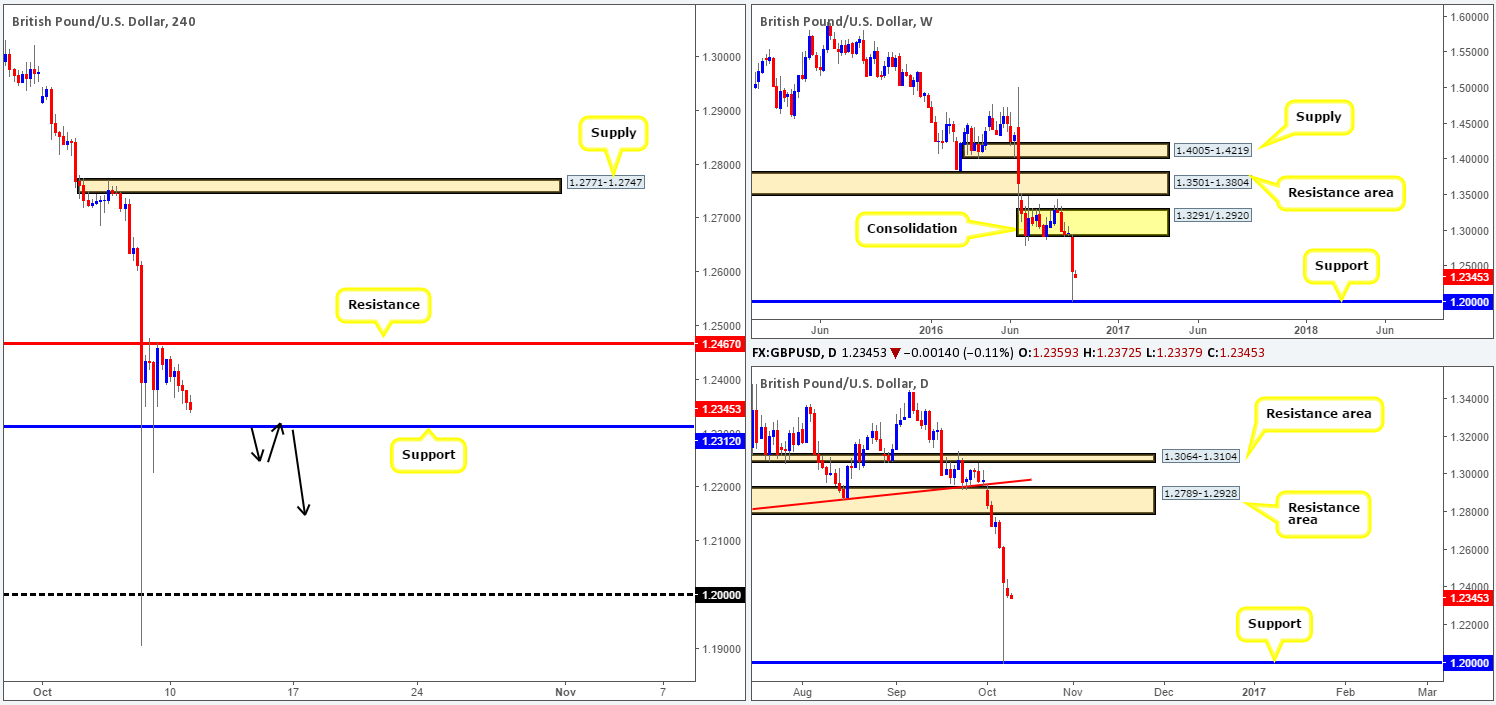
Concerns over the Brexit situation continued to weigh on the GBP/USD yesterday, as price dived below the 1.24 hurdle. From the H4 chart, the technical landscape shows that price action may, as mentioned in Monday’s report, be in the process of chiseling out a consolidation zone fixed between resistance penciled in at 1.2467 and support drawn from 1.2312 (seen much clearer on the M30 timeframe). Should the lower edge of the above said H4 range hold ground, we would be very cautious buying from here for the following reasons:
- The predominant downtrend in this market is steep.
- There is little support seen on both the weekly and daily timeframes until around the 1.20 region.
- Brexit-driven fears will likely deter the majority of the market from buying, hence further downside being the more probable direction.
In view of the three points above, we’ll pass on any longs for the time being. As for shorts, a decisive close below the current H4 support could provide one with a selling opportunity here. For us personally, however, we’d require the H4 candles to retest the underside of the broken support as resistance (see black candles) and print a reasonably sized H4 bear candle before our team would look to short.
Levels to watch/live orders:
- Buys: Flat (Stop loss: N/A).
- Sells: Watch for a close below the H4 support at 1.2312 and then look to trade any retest seen thereafter (H4 bearish candle is required prior to pulling the trigger).
AUD/USD:
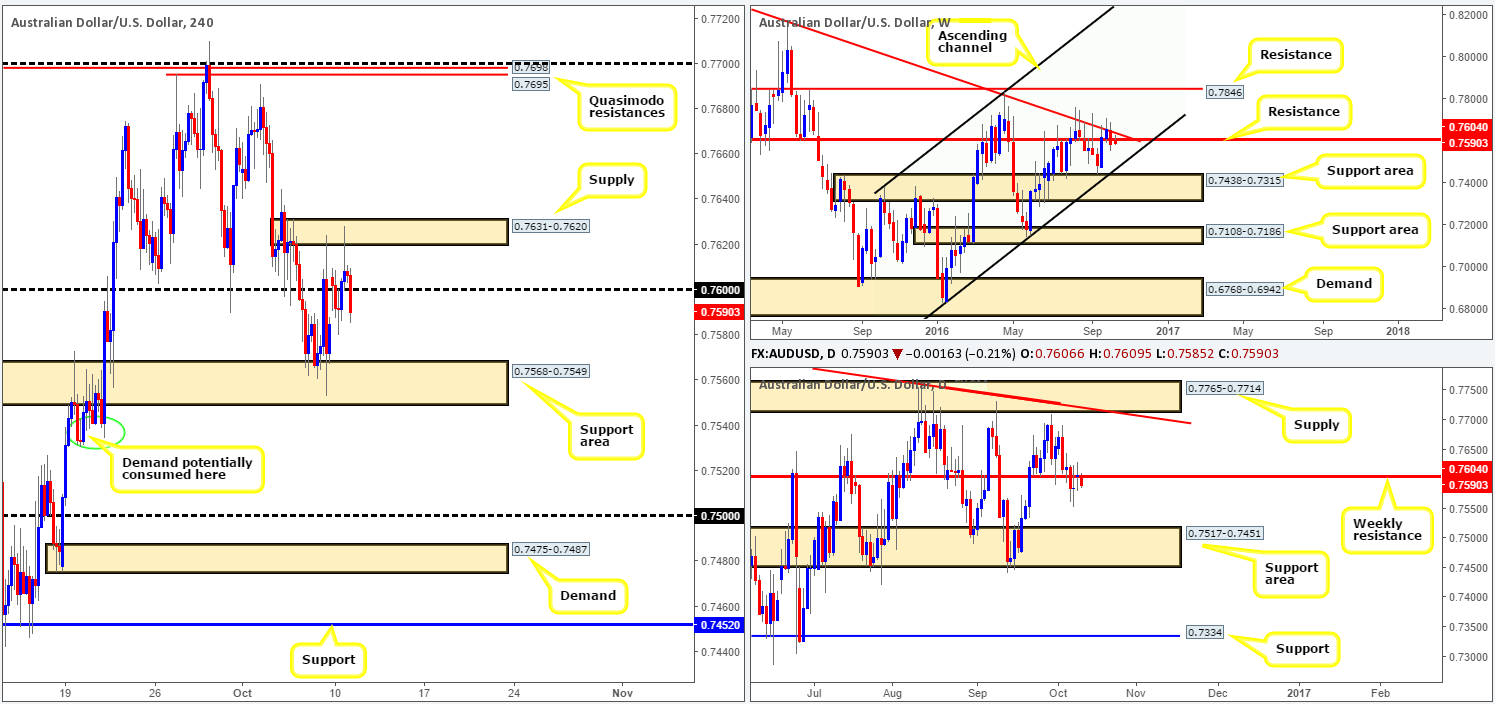
Following the week’s opening gap, the commodity currency eventually struck H4 supply seen at 0.7631-0.7620, which has, in recent hours, sent the pair back below the 0.76 psychological handle. Now, with higher-timeframe action seen currently selling off from weekly resistance chalked up at 0.7604, there’s a good chance further selling may be on the cards.
However, as we highlighted in Monday’s report, before we look to sell this market price will need to consume the H4 support area at 0.7568-0.7549. This support area is especially significant in that it was used to propel the currency beyond the weekly resistance 0.7604 back on the 21st September.
Our suggestions: For our team to become sellers in this market, we require a H4 close to take shape beyond the current H4 support area, followed up by a retest and a H4 bearish candle. In regard to targets, we’d be eyeing the 0.75 handle that is encapsulated within a daily support area coming in at 0.7517-0.7451: the next downside target on the daily timeframe.
Levels to watch/live orders:
- Buys: Flat (Stop loss: N/A).
- Sells: Watch for a close below the H4 support area at 0.7568-0.7549 and then look to trade any retest seen thereafter (H4 bearish candle is required before pulling the trigger).
USD/JPY:
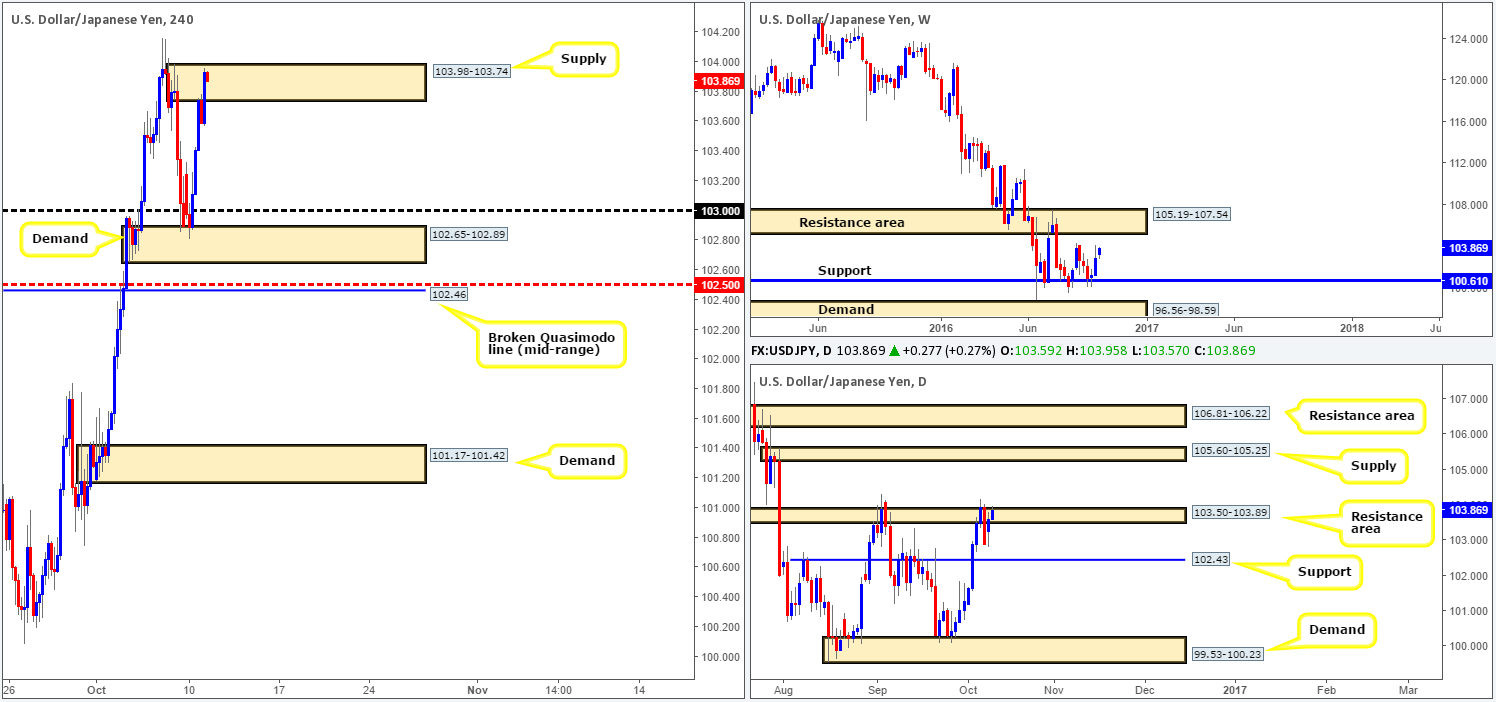
During the course of yesterday’s sessions, the US dollar pressed higher against the Japanese Yen amidst thin trading conditions. As can be seen from the H4 chart, the rally began from demand seen at 102.65-102.89, and ended with price connecting with supply at 103.98-103.74.
Over on the weekly chart, the bulls look as though they’re en route to test weekly highs chalked up on the 29/08 around the 104.32ish range. A decisive push above here could land the pair within striking distance of a resistance area penciled in at 105.19-107.54. Looking down to the daily chart, however, the buyers and sellers are seen battling for position around the top edge of a resistance area coming in at 103.50-103.89 To our way of seeing things, there’s a good chance that this area will continue to hold this market lower here this week, with it having been a considerably strong support/resistance zone on a number of occasions right back to the year 2008! The next downside target to keep an eyeball on is the support fixed at 102.43, followed by demand coming in at 99.53-100.23. Be that as it may, a close above this barrier could portend further buying up to supply seen at 105.60-105.25, which, as you can probably see, is housed within the above said weekly resistance area.
Our suggestions: Given how strong price pushed into the current H4 supply zone, we’re a little cautious about selling from here. Nevertheless, there’s still a good chance that the pair will decline in value from this neighborhood.
Levels to watch/live orders:
- Buys: Flat (Stop loss: N/A).
- Sells: Flat (Stop loss: N/A).
USD/CHF:
Beginning this morning’s report with a look at the daily chart shows that yesterday’s action saw the Swissy ever so slightly close above the trendline resistance extended from the high 1.0256. By and of itself, this could signal that further buying may be on the cards this week up to supply coming in at 0.9956-0.9921, which is seen glued to the underside of a weekly supply zone drawn from 1.0092-0.9928.
Stepping across to the H4 chart, we can also see price recently closed above both a H4 trendline resistance taken from the high 0.9884 and a H4 resistance at 0.9817 (now acting support). Technically speaking, there is little resistance seen overhead here until the H4 Quasimodo resistance level at 0.9863.
Our suggestions: Put simply, watch for price to retest the 0.9817 H4 support boundary today. Given that it intersects beautifully with the above noted H4 trendline support, and bearing in mind that the bigger picture shows room to advance north, we would confidently take a long from here on the condition that a H4 bull candle forms.
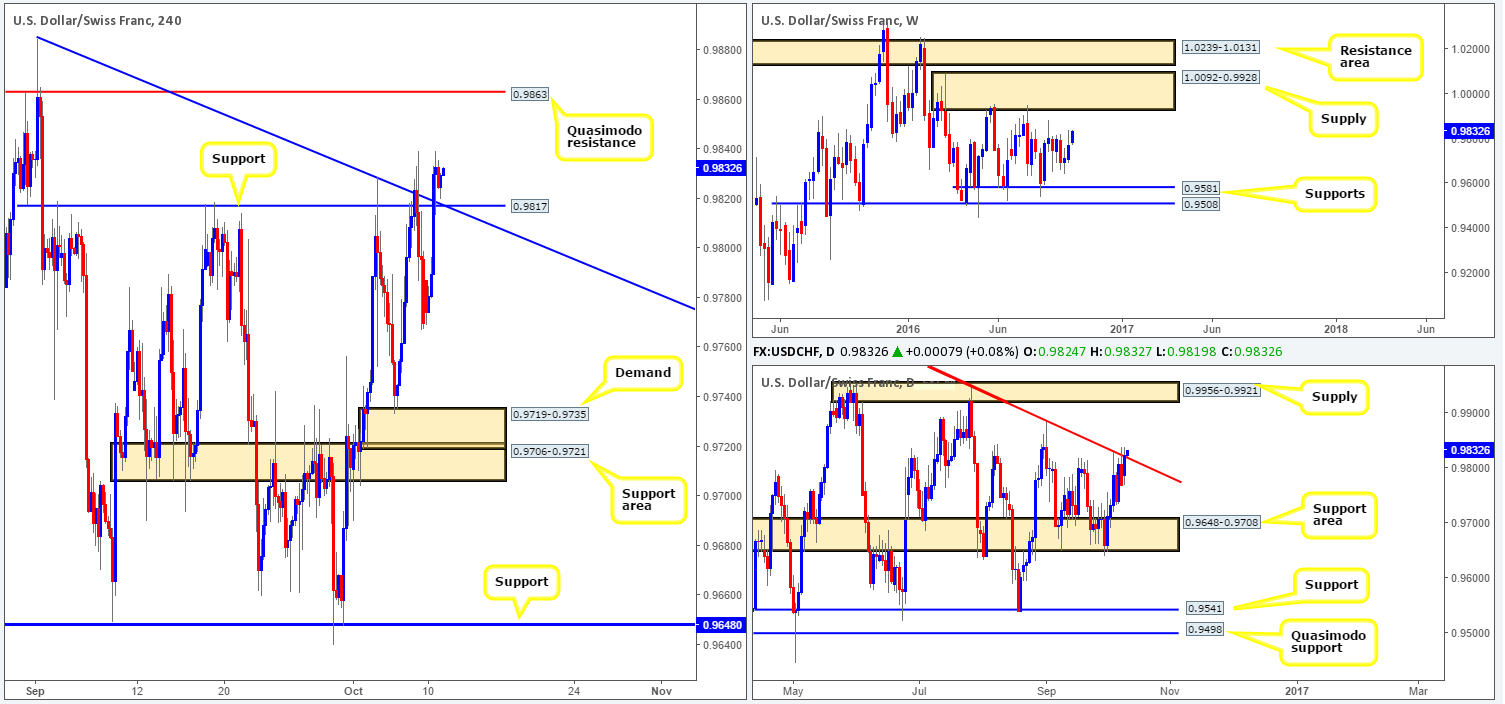
Levels to watch/live orders:
- Buys: 0.9817 region ([H4 bullish candle required prior to pulling the trigger] Stop loss: beyond the trigger candle).
- Sells: Flat (Stop loss: N/A).
DOW 30:
Kicking things off with a look at the weekly chart this morning, we can see that price was recently bid north and has, as a result, forced the unit to collide with resistance drawn in at 18365. Should the sellers defend this barrier, we might see the unit grind down to support coming in at 17977. A push above this resistance on the other hand, could signal that the bulls are ready to strike fresh highs and continue trading northbound. Sliding down into the daily chart, yesterday’s candle ever so slightly closed above resistance at 18322. Despite this, we believe that this close is not significant enough to presage further upside just yet.
Looking over to the H4 chart, yesterday’s buying forced price above the trendline resistance drawn from highs of 18450, and aggressively spiked through a resistance area coming in at 18321-18349. Until a decisive CLOSE above this barrier comes into view (potentially opening up the trapdoor for further buying towards H4 supply at 18466-18447), we would be cautious about buying this market. As far as selling is concerned, shorting this index should only be considered following a close beyond the daily trendline support extended from low 15501.
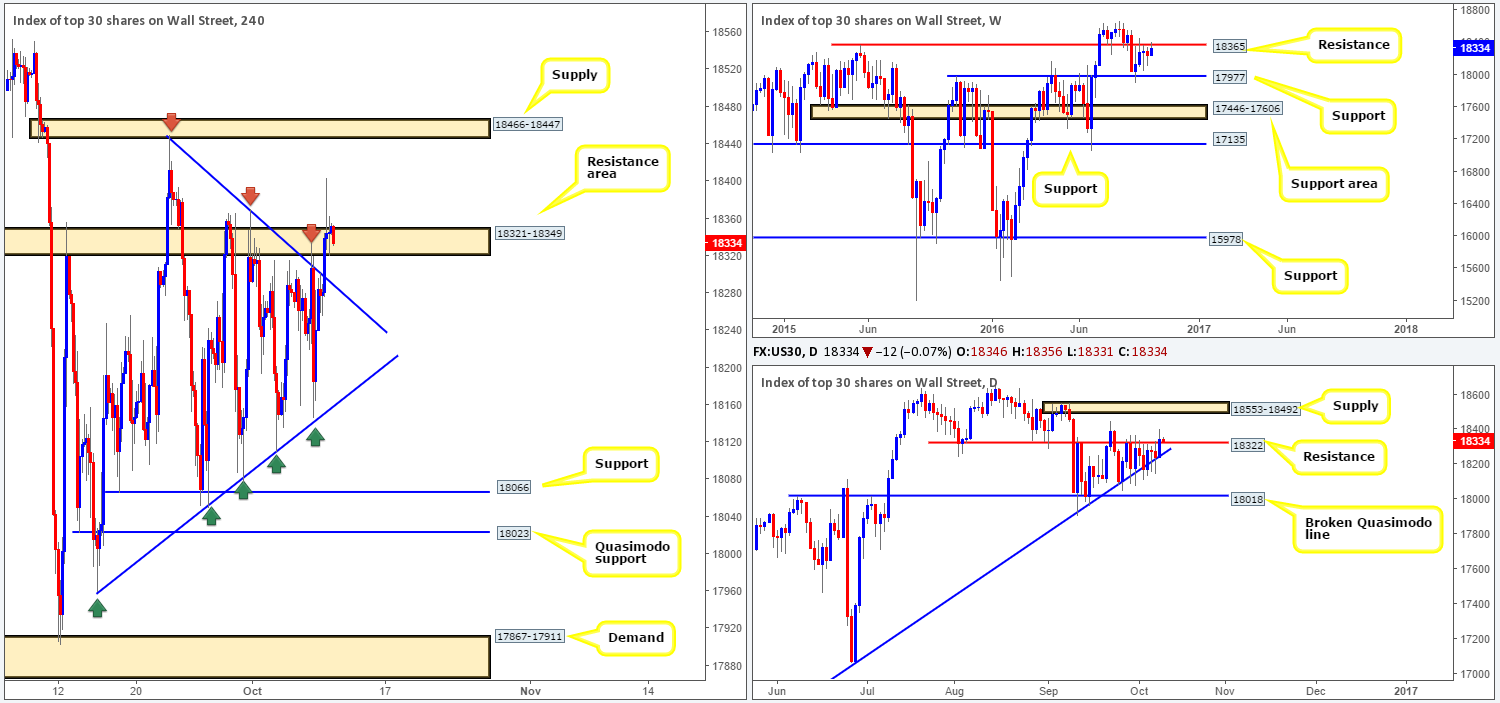
Levels to watch/live orders:
- Buys: Flat (Stop loss: N/A).
- Sells: Flat (Stop loss: N/A).
GOLD:
Going into the early hours of yesterday’s European session, gold topped out just ahead of a H4 supply zone coming in at 1268.1-1265.0. While price did selloff during the London morning stint, momentum severely diminished thereafter due to US banks being closed in observance of Columbus Day.
With the above in mind, let’s remind ourselves where price is currently positioned in the bigger picture. Weekly action recently took out a support area at 1307.4-1280.0 (now acting resistance), and has possibly set the stage for a continuation move south this week down to the support area logged in at 1205.6-1181.2, which happens to converge nicely with two trendline supports (1130.1/1071.2). Daily price on the other hand, remains trading around demand (1234.6-1244.9/ 1250.1-1265.0).
Our suggestions: Although there is room for a continuation move south seen on the H4 chart down to demand at 1234.6-1241.3, this would be a risky sell, in our opinion, since you’re effectively selling into daily demand (see above). A buy from the above said H4 demand, however, does boast support from the above noted daily demands, but given that weekly price shows room to continue lower (see above), this would also be a risky buy in our book.
As we highlighted in yesterday’s report: ‘Sometimes the best position is no position’. This is so very true, and we believe this STILL to be case with gold right now. That is, at least until the daily candles give some indication into which way they may break.

Levels to watch/live orders:
- Buys: Flat (Stop loss: N/A).
- Sells: Flat (Stop loss: N/A).


