
EUR/USD:
Following Friday’s NFP-induced advance, the single currency encountered mild downside pressure Monday amid reports suggesting the European Central Bank (ECB) is mulling further easing. The euro concluded the day down 0.18% versus the US dollar.
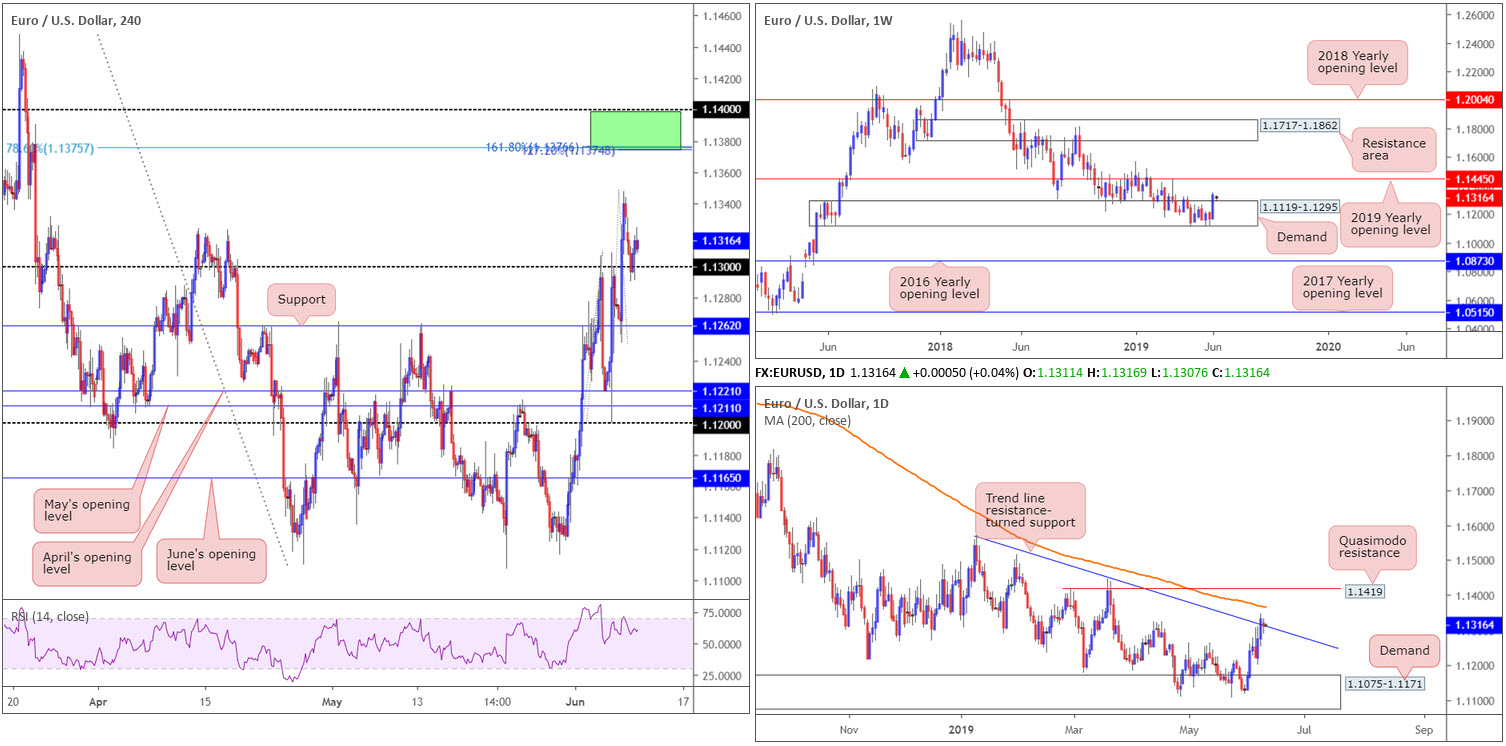
From a technical standpoint, EUR/USD bulls remain underlining an offensive state out of a long-standing weekly demand zone at 1.1119-1.1295. Despite the overall trend still facing a southerly bearing since topping in early 2018, the recently formed near-full-bodied weekly bull candle displays scope for extension to as far north as the 2019 yearly opening level at 1.1445.
Cutting through to the daily timeframe, the research team notes price action is testing a trend line resistance-turned support extended from the high 1.1569. Overhead resistance can be seen in the form of a 200-day SMA (1.1366) and a Quasimodo formation at 1.1419.
A closer reading of price action on the H4 timeframe has the candles rebounding from the 1.13 handle, following Friday’s peak at 1.1347. Aside from possible resistance emerging from 1.1347, the next port of call in terms of upside objectives falls in around the 1.14/1.1374 region (green – comprised of the round number 1.14, a 78.6% Fibonacci resistance at 1.1375 and two 161.8% Fibonacci extension points at 1.1376 and 1.1374).
Areas of consideration:
Having seen all three timeframes display reasonably bullish structure, focus is on further buying from 1.13 today, targeting 1.1347 and ultimately 1.14/1.1374 (which is a valid sell zone given its confluence).
H4 price, as you can see, recently produced a nice-looking bullish engulfing candle off of 1.13. This, alongside the higher-timeframe structure, is likely sufficient evidence to draw in buyers and push higher. Traders have the option of entering at market price, with a protective stop-loss order positioned beneath the lower shadow of the said bullish engulfing formation (1.1290).
Today’s data points: US Core PPI m/m; US PPI m/m.
GBP/USD:
Weighed on by less-than-stellar UK April GDP and some punchy speech-making from Tory leadership frontrunner Boris Johnson keeping the prospect of a no-deal Brexit alive, the British pound declined 0.38% vs. the US dollar Monday.
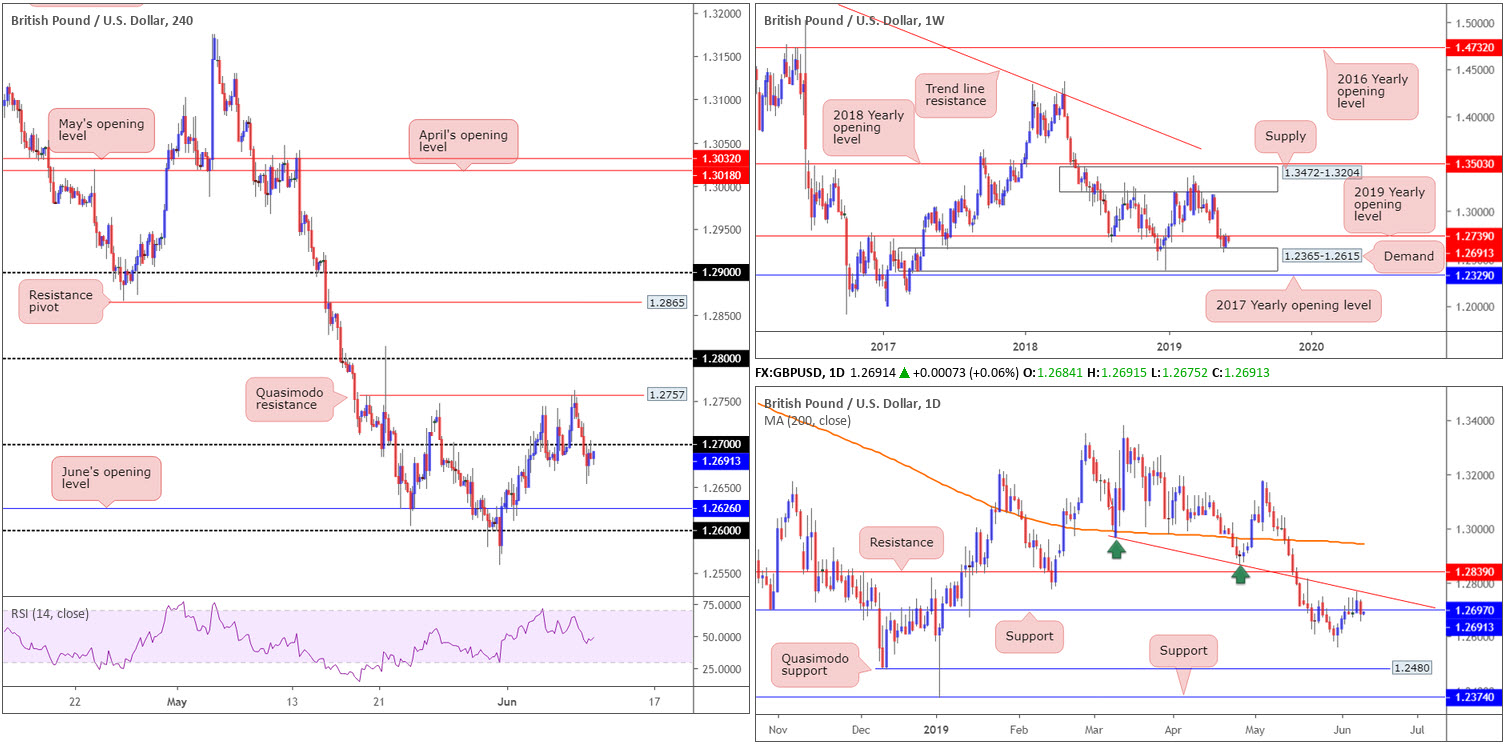
Technically, we’re now trading sub 1.27, after recently retesting the underside of the figure as resistance by way of a H4 shooting star formation. This may call for a move towards June’s opening level at 1.2626, closely shadowed by the 1.26 handle.
On a wider perspective, weekly flow is fading the underside of the 2019 yearly opening level at 1.2739, following a recovery from demand at 1.2365-1.2615 last week. In conjunction with weekly movement, we can also see daily price inching its way south of support at 1.2697, potentially opening up downside towards the 1.2558 May 31 low, followed by Quasimodo support at 1.2480.
Areas of consideration:
Shorts at current price appear high probability, according to our technical studies. Not only do we have weekly price fading resistance at 1.2739, we also have daily price testing waters beneath support at 1.2697 and H4 action chalking up a bearish candlestick formation from the underside of 1.27.
A sell from current price, with a protective stop-loss order above the H4 shooting star’s upper shadow (1.2704) is, therefore, an option today, targeting June’s opening level at 1.2626 as the initial take-profit level.
Today’s data points: UK Average Earnings Index 3m/y; UK Claimant Count Change; UK Unemployment Rate; US Core PPI m/m; US PPI m/m.
AUD/USD:
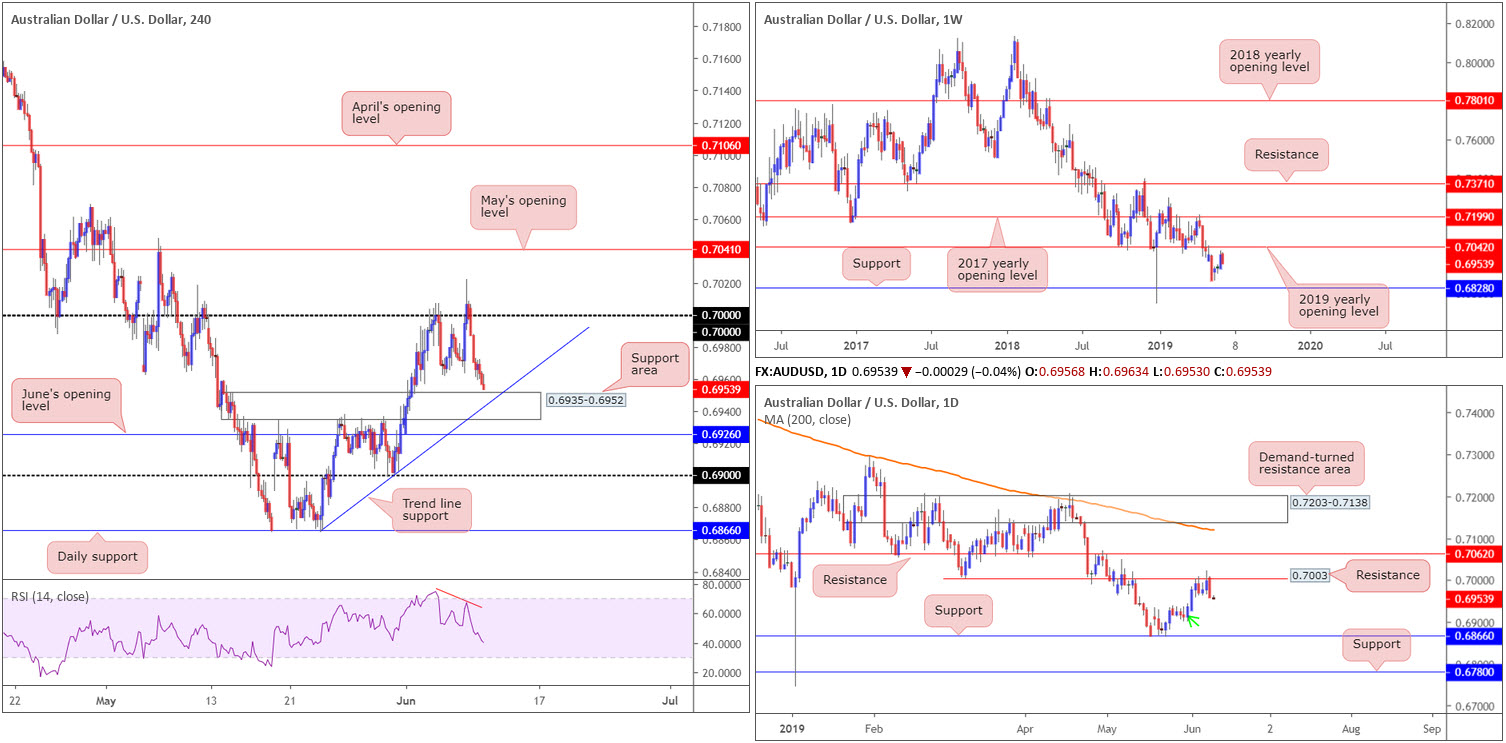
In recent sessions, the commodity-linked Australian dollar failed to build on last week’s upside momentum amid broad-based USD bidding. After firmly reclaiming 0.70 to the downside, the AUD/USD H4 candles engulfed local bottoms around 0.6963ish and is poised to approach a support area at 0.6935-0.6952, which happens to intersect with a trend line support extended from the low 0.6864.
The story on the daily timeframe reveals price action is strongly selling off from resistance at 0.7003, in the shape of a near-full-bodied bearish candle. Continued selling may eventually target demand marked with a green arrow around the 0.6935ish region. However, seeing as this area failed to produce much in the way of notable upside momentum from its base, this limits its position somewhat and may give way to support at 0.6866. Note the aforesaid daily demand also aligns with the H4 support area highlighted above at 0.6935-0.6952.
Areas of consideration:
Today’s spotlight, from a technical perspective, is focused on the H4 support area emphasised above at 0.6935-0.6952 for potential long opportunities, having seen it align closely with the current daily demand and a H4 trend line support.
In order to avoid an unnecessary loss, traders are urged to wait for additional candlestick confirmation to form prior to pulling the trigger – think hammer formation or an engulfing pattern. Not only does this help identify buyer intent, it also provides traders entry and risk levels to work with. As for upside targets out of 0.6935-0.6952, the 0.70 figure appears a logical starting point.
Today’s data points: NAB Business Confidence; US Core PPI m/m; US PPI m/m.
USD/JPY:
The US dollar gapped more than 30 points in opening trade Monday and reached a peak of 108.71 before turning lower. The Japanese yen was softer on the improved market risk tone after BoJ Governor Kuroda made dovish comments, in which he opened the door for further stimulus as the central bank seeks to meet its 2% inflation target. Overall, however, the market concluded the session unchanged.
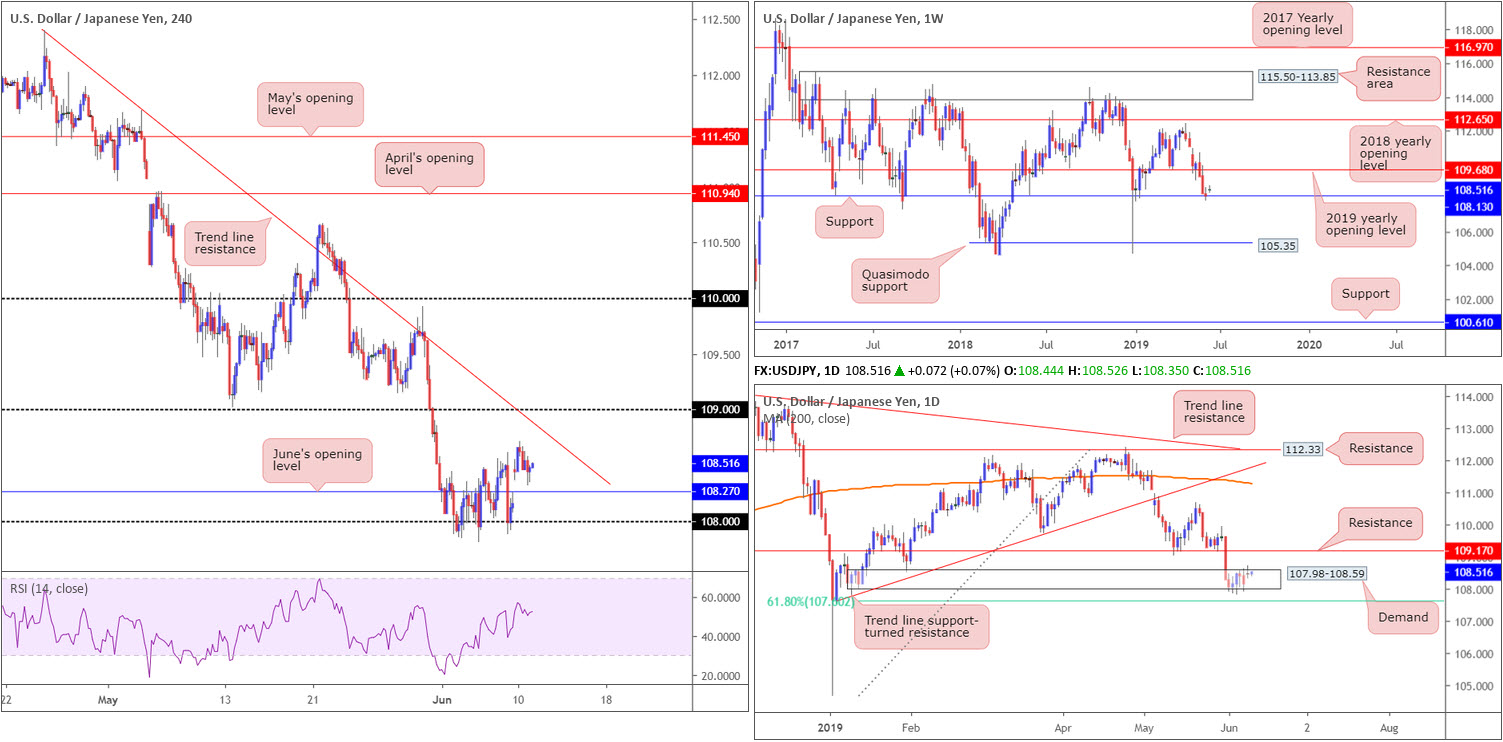
Long-term flow remains loitering around weekly support at 108.13. Having seen a lack of enthusiasm from this barrier, though, traders may want to acknowledge Quasimodo support at 105.35 in the event we press for lower ground in the weeks to come.
Daily demand at 107.98-108.59 is struggling to maintain a presence, as yesterday’s action produced an indecision candle. Despite boasting a connection to weekly support mentioned above at 108.13, the odds of daily price rushing the lower edge of the said demand this week is high, targeting a 61.8% Fibonacci support value at 107.60.
Across on the H4 timeframe, the unit is seen trading north of June’s opening level at 108.27 and faces potential opposition from a nearby trend line resistance extended from the high 112.40. Beyond 108.27, traders may also want to acknowledge the 108 handle.
Areas of consideration:
Longer term, the research team visualises further downside due to a possibly fragile weekly support and lacking daily demand.
Shorter term, on the other hand, a long from June’s opening level on the H4 timeframe at 108.27 could be worth considering, targeting the current H4 trend line resistance. On the same note, a sell from the trend line resistance could also be a consideration.
Irrespective of which level one selects today, if any, additional confirmation should be targeted prior to initiating a position. This could be anything from a bearish/bullish candlestick configuration, a lower-timeframe MA crossover or even drilling down to the lower timeframes and attempting to trade local (price action) structure.
Today’s data points: US Core PPI m/m; US PPI m/m.
USD/CAD:
In early trade Monday, the market observed a gap to 1.3238 amid stronger risk appetite. After dropping to its lowest level since March 1, however, the USD/CAD pair turned north and staged a decisive rebound to turn positive on the day. On the whole, though, structure remains unchanged. For that reason, much of the following report will echo thoughts put forward in Monday’s outlook.
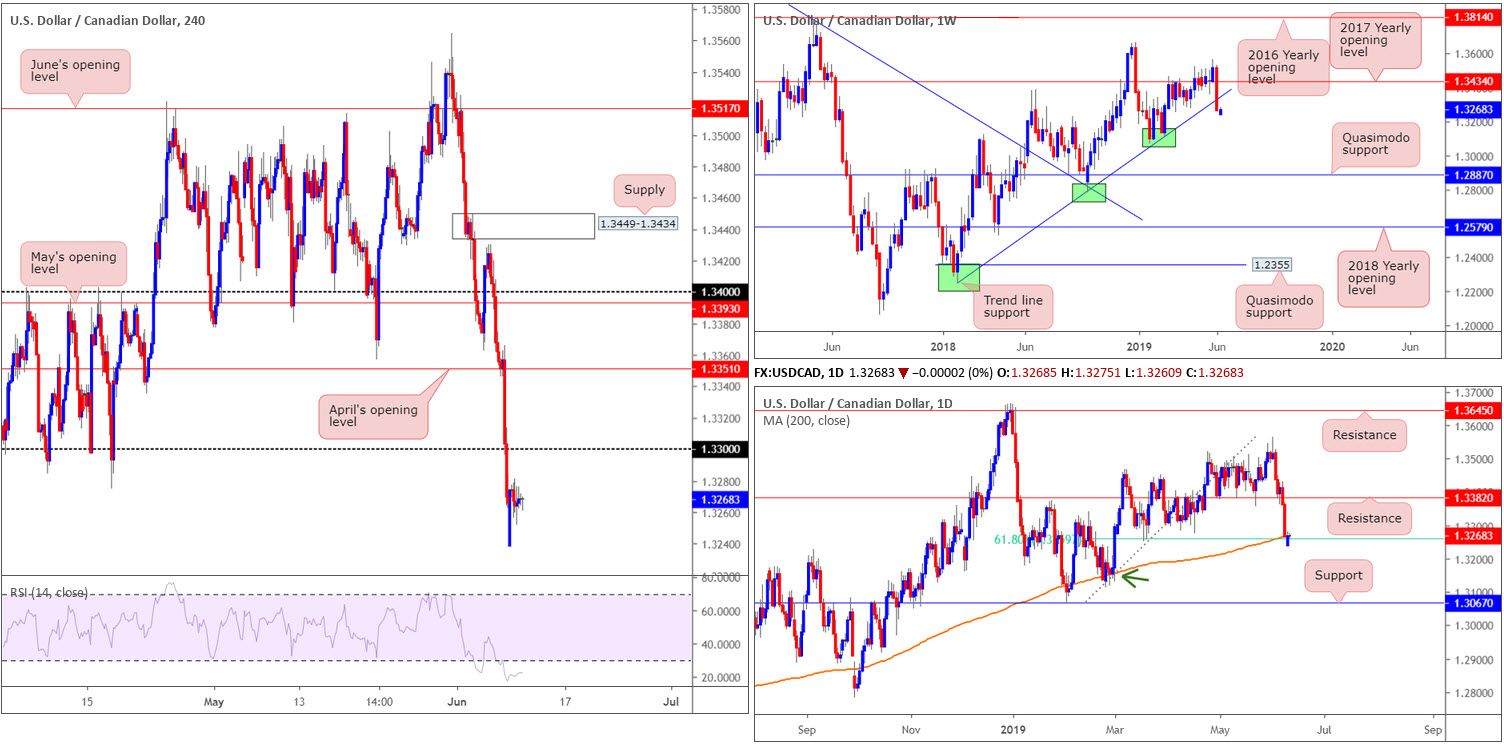
From the weekly timeframe, USD/CAD action engulfed a long-standing trend line support extended from the low 1.2247. The break of this trend line formation is significant, given the length of time this barrier has been in motion. Therefore, a move to the 1.3068 Jan 28 2019 low could be in store. By the same token, though, traders should also prepare for the possibility of a retest of the recently broken trend line support, prior to a move lower.
Thanks to recent selling, the daily candles dethroned support at 1.3382 (now acting resistance) and crossed paths with its 200-day SMA. What’s also notable from a technical perspective is the merging 61.8% Fibonacci support value at 1.3260, and thus could offer a platform for buyers to enter the fray this week. Failure of 1.3260 has potential demand arising from 1.3166ish (green arrow), closely shadowed by a reasonably attractive support emerging from 1.3067.
With 1.33 now a distant memory on the H4 timeframe, the next port of call to the downside falls in around the 1.32 handle, followed by a Quasimodo support level coming in at 1.3150 (not visible on the screen).
Areas of consideration:
In H4 terms, a retest to the underside of 1.33 appears a reasonable possibility, with the expectation of a move lower. This is further bolstered by the weekly timeframe’s position below trend line support. However, seeing daily price testing reasonably strong support around 1.3260ish, we could potentially overthrow 1.33 and head for April’s opening level on the H4 timeframe at 1.3315.
On the other hand, traders who feel the daily 200-day SMA combination with 61.8% Fib support at 1.3260 is enough to draw in buyers, the next upside target on this scale is resistance at 1.3382. Folks concerned by the recent break of weekly trend line support, however, might opt to wait and see if daily action prints a bullish candlestick pattern before pulling the trigger. This not only helps identify buyer intent, it also provides traders entry and risk levels to work with.
Today’s data points: US Core PPI m/m; US PPI m/m.
USD/CHF:
Aside from an enthusiastic start to the day, gapping above 0.99 on the H4 timeframe, the market struggled to pin down short-term direction thereafter. In light of this, much of the following piece will replicate a large portion of Monday’s briefing.
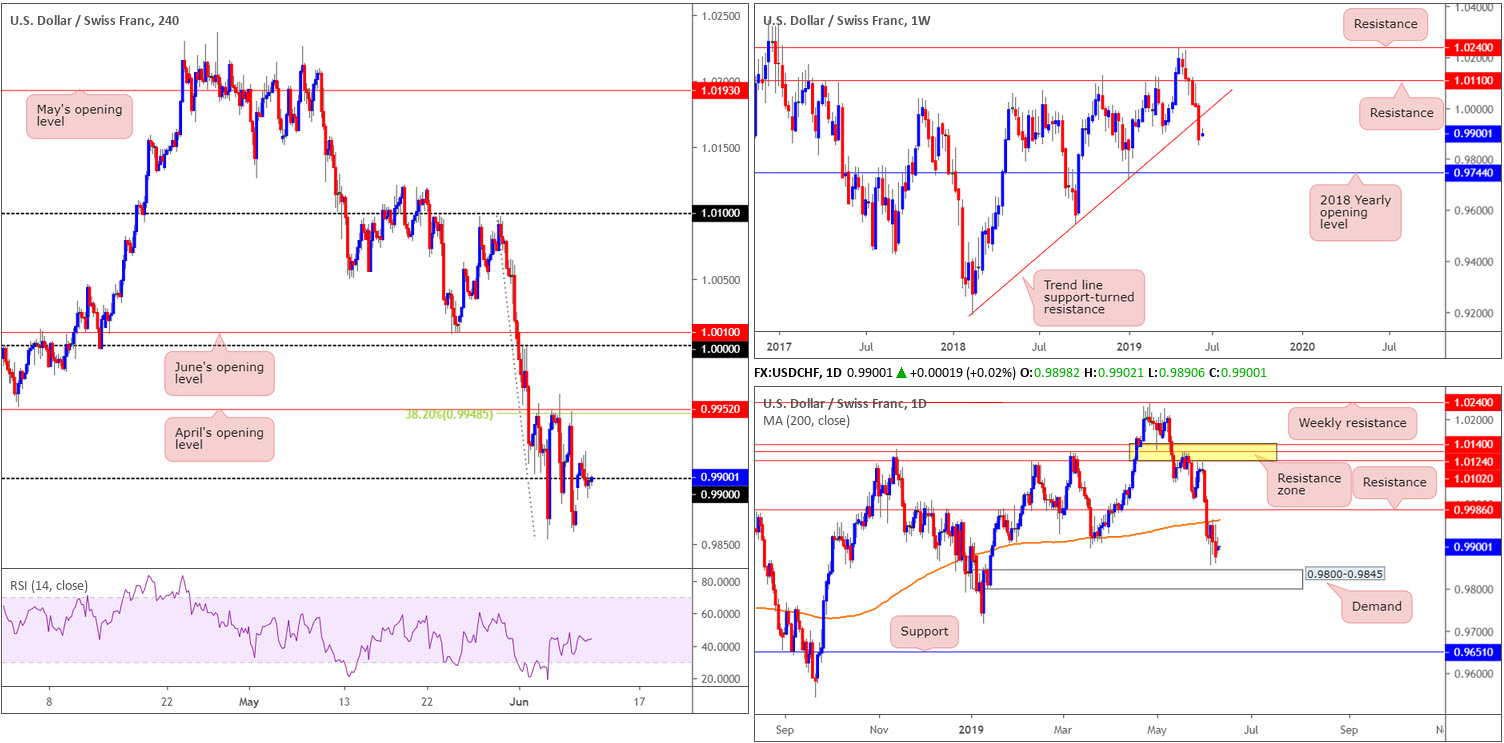
The greenback’s retreat against the Swiss franc from the 2019 high 1.0236 set towards the end of May continued last week, strengthening its position beneath weekly resistance at 1.0110, and now beyond trend line support (etched from the low 0.9187). The break of this long-standing trend line has traders’ crosshairs likely fixed on possible support derived from the 2018 yearly opening level at 0.9744. Over the course of last week, daily players also found a ceiling off its 200-day SMA around 0.9960, and appears poised to approach nearby demand posted at 0.9800-0.9845.
April’s opening level at 0.9952 as well as a 38.2% Fibonacci resistance value at 0.9948 on the H4 timeframe remain in view as the next upside base of resistance. If the H4 candles fail to hold 0.99, however, Quasimodo support at 0.9814 is in sight as the next viable floor (not seen on the screen), which is located within the lower boundary of daily demand coming in at 0.9800-0.9845.
Areas of consideration:
Having witnessed weekly price engulf trend line support and potentially unlock the path lower for further downside, a break below and retest of 0.99 as resistance could be something to keep an eye open for, targeting the top edge of daily demand at 0.9845. Remember within this area we also hold the H4 Quasimodo support at 0.9814. In order to avoid being taken out on a whipsaw above 0.99 (fakeouts are common viewing around psychological numbers), traders are urged to allow price action to prove itself before committing. This could be anything from a H4 bearish candlestick configuration, a lower-timeframe MA crossover or even drilling down to the lower timeframes and attempting to trade local (price action) structure from 0.99.
In addition to the above, traders are also urged to keep a tab on H4 resistance at 0.9952 for possible sells, which, as already highlighted, boasts a connection with a 38.2% Fibonacci resistance value at 0.9948.
Today’s data points: US Core PPI m/m; US PPI m/m.
Dow Jones Industrial Average:
US stocks rose higher Monday, extending last week’s immense gains, after the US reached an agreement with Mexico on tariffs. The Dow Jones Industrial Average closed 70 points higher, or 0.27%; the S&P 500 also gained 0.47%, along with the tech-heavy Nasdaq 100 advancing 1.14%.
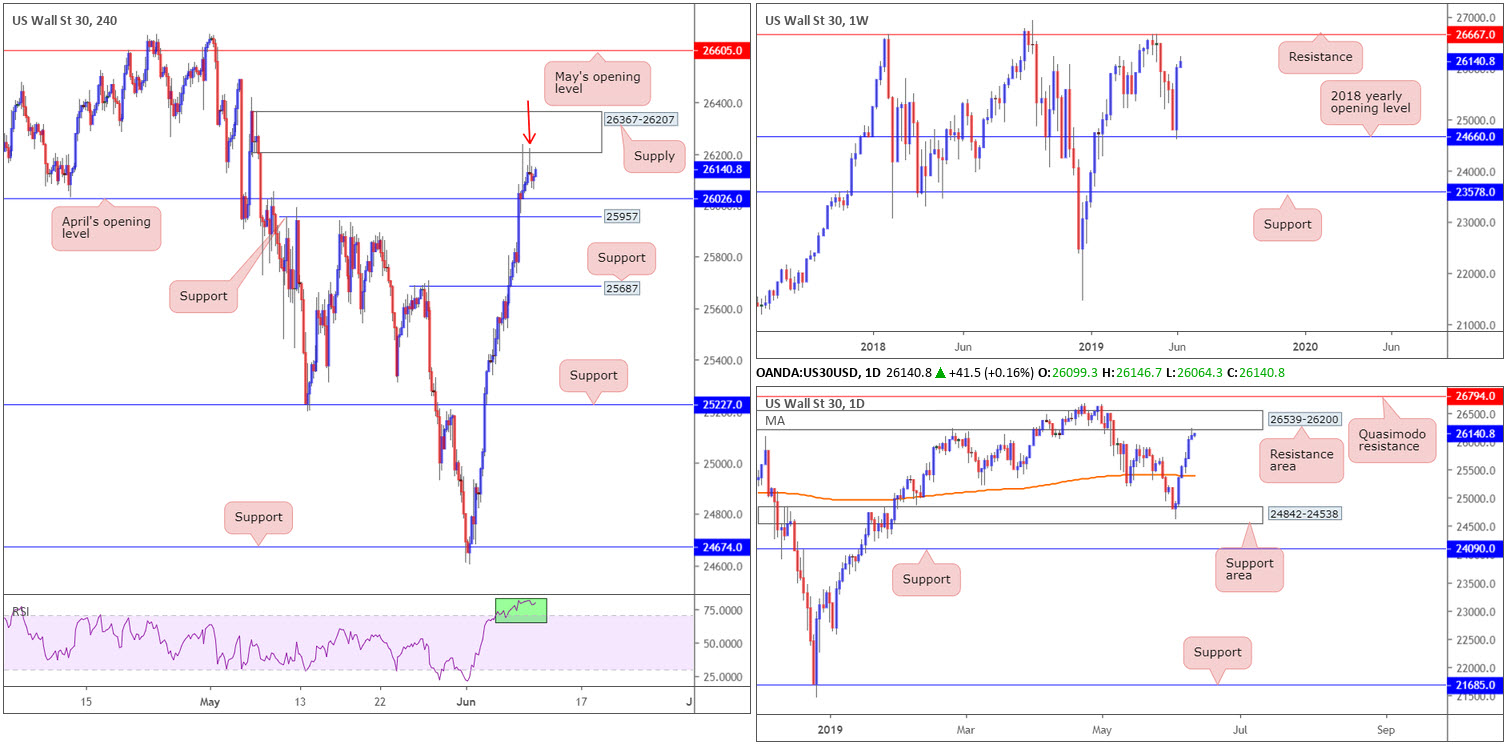
Technically speaking, however, limited movement was seen Monday. H4 action remains fading fresh supply drawn from 26367-26207, which happens to converge with the lower edge of a daily resistance area at 26539-26200 and also comes with RSI overbought confirmation (green). The next downside objective on the H4 scale can be seen around April’s opening level at 26026, shadowed closely by support present at 25957.
Weekly flow, nevertheless, recently snapped back more than three weeks’ worth of losses last week off its 2018 yearly opening level at 24660, consequently producing a bullish engulfing pattern. Additional upside from this point has resistance in view at 26667 this week.
Areas of consideration:
Focus remains around the aforementioned daily resistance area, more specifically the H4 supply zone at 26367-26207, for potential shorting opportunities. Ultimately it would be ideal to identify some form of bearish confirmation before pulling the trigger, such as the shooting star configuration formed yesterday (red arrow). In terms of take-profit targets, April’s opening level at 26026 as well as H4 support at 25957 are the next logical floors in view. Beyond here, H4 support at 25687 is next in the firing range.
Today’s data points: US Core PPI m/m; US PPI m/m.
XAU/USD (GOLD):
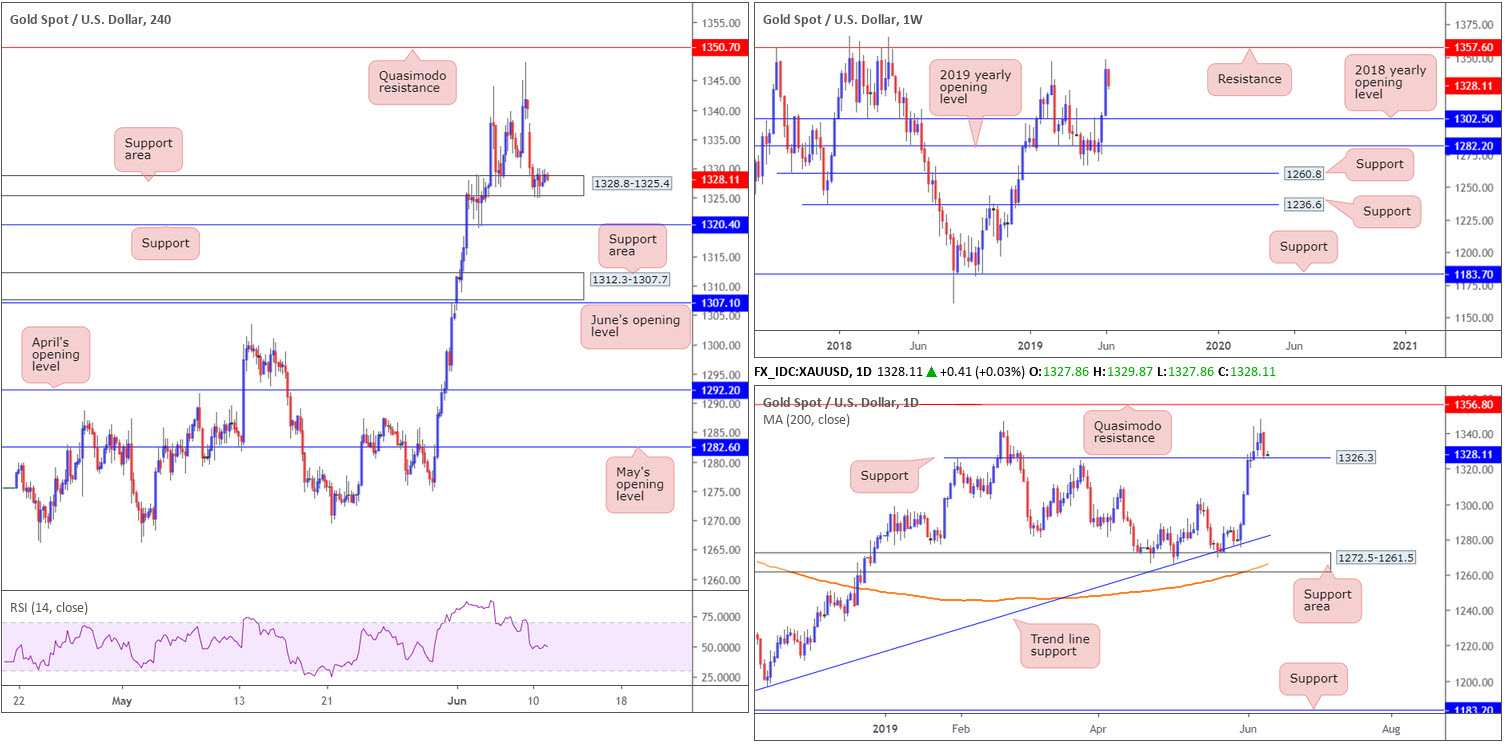
Although finishing the day down nearly 1.00%, thanks largely to opening trade, a large portion of Monday’s movement was confined to a H4 support area coming in at 1328.8-1325.4. Traders may also wish to acknowledge daily support entering the fold around 1326.3, seen plotted within the said H4 support area.
Beyond the current H4 support area, H4 support resides around 1320.4, followed by another support area positioned at 1312.3-1307.7.
Our position on the weekly timeframe has bullion fading recent gains off last week’s high 1348.2. Continued selling could land the unit at the 2018 yearly opening level at 1302.5, whereas a move higher has resistance at 1357.6 to target.
Areas of consideration:
Judging by the lack of enthusiasm out of the H4 support area at 1328.8-1325.4, a test of the H4 support level at 1320.4 could be on the cards today. This will likely trip sell stops and thus provide liquidity to traders looking to buy. To be on the safe side, the research team recommends waiting for additional confirmation to form before committing funds to a position.
In the event we do eventually push for higher ground, the area between 1357.6 and 1350.7 is still on the menu for potential selling opportunities (comprised of the weekly resistance level, the daily Quasimodo resistance level and also the H4 Quasimodo resistance level). As 1357.6/1350.7 is somewhat small in range, though, traders are recommended to wait for additional confirmation before committing funds. As highlighted in other markets, this could be anything from a H4 bearish candlestick configuration, a lower-timeframe MA crossover or even drilling down to the lower timeframes and attempting to trade local (price action) structure within the zone.
The accuracy, completeness and timeliness of the information contained on this site cannot be guaranteed. IC Markets does not warranty, guarantee or make any representations, or assume any liability with regard to financial results based on the use of the information in the site.
News, views, opinions, recommendations and other information obtained from sources outside of www.icmarkets.com.au, used in this site are believed to be reliable, but we cannot guarantee their accuracy or completeness. All such information is subject to change at any time without notice. IC Markets assumes no responsibility for the content of any linked site. The fact that such links may exist does not indicate approval or endorsement of any material contained on any linked site.
IC Markets is not liable for any harm caused by the transmission, through accessing the services or information on this site, of a computer virus, or other computer code or programming device that might be used to access, delete, damage, disable, disrupt or otherwise impede in any manner, the operation of the site or of any user’s software, hardware, data or property.


