
DXY:
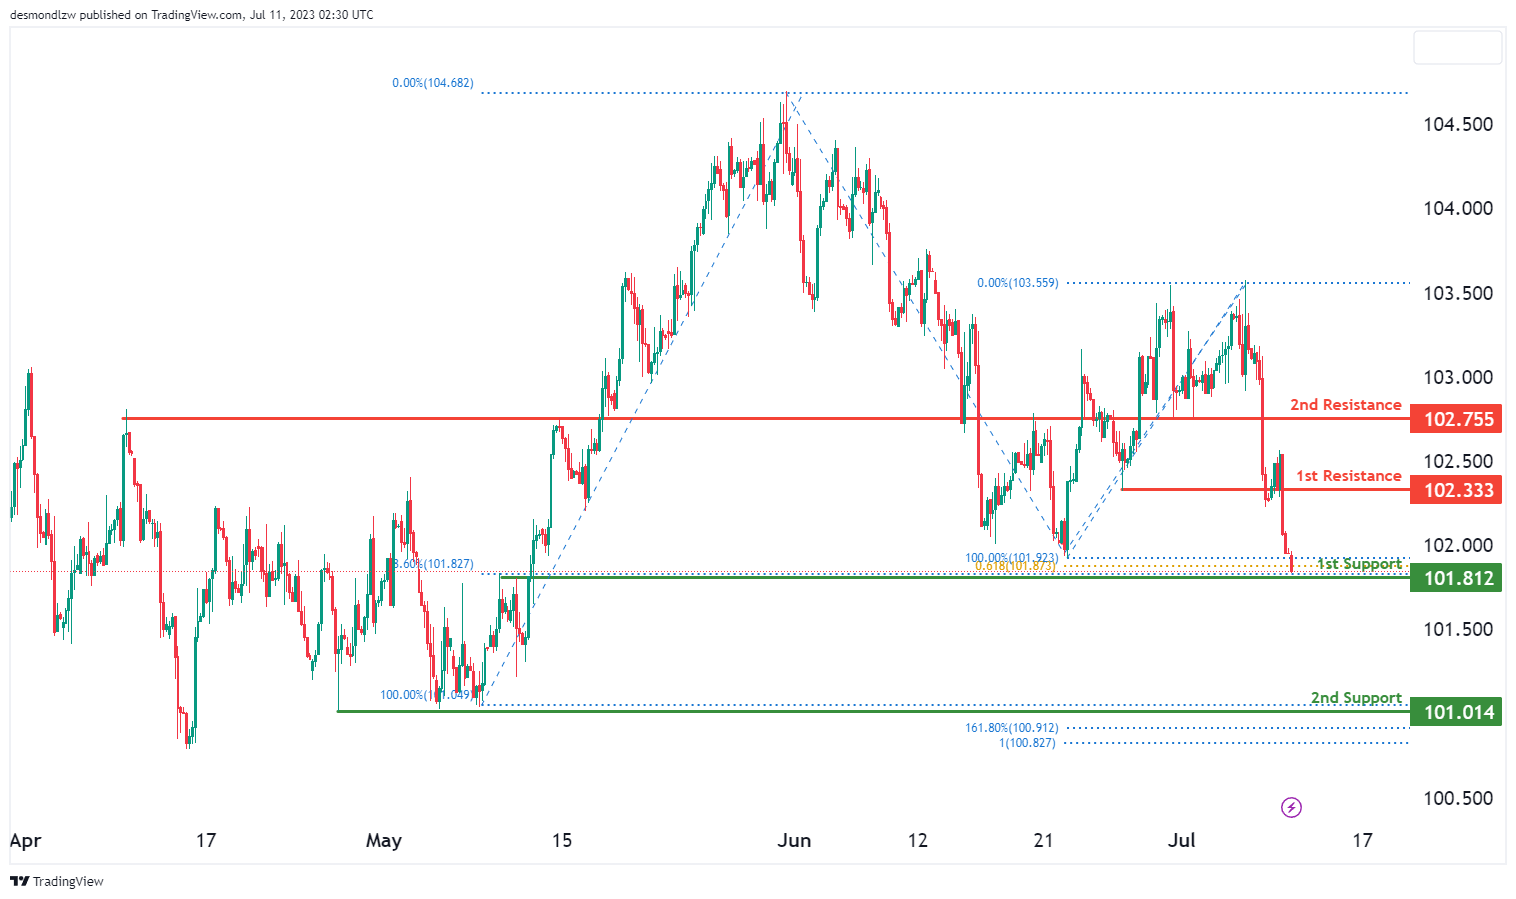
Given the overall bullish momentum of the DXY, we might see a bullish bounce off the 1st support, with price heading towards the 1st resistance.
The 1st support stands at 101.81, which is an overlap support. This support level’s strength is reinforced by both a 78.6% Fibonacci retracement and a 61.8% Fibonacci projection. Should the price bounce off this support, we could observe a rise towards our 1st resistance at 102.33, characterized as a significant pullback resistance.
However, if the price breaks the 1st support, it could descend towards the 2nd support at 101.01. This level serves as a multi-swing low support and coincides with a 161.8% Fibonacci extension and a 100% Fibonacci projection, adding further credibility as a significant support zone.
On the flip side, if the price breaches the 1st resistance, it could potentially ascend towards our 2nd resistance at 102.75, another pullback resistance of note. This resistance level aligns with a 78.6% Fibonacci retracement, suggesting it as a potential reversal or slowdown area.
EUR/USD:
EUR/USD’s momentum is currently bearish. As a consequence, we might observe a bearish reaction off the 1st resistance, causing a price drop towards the 1st support.
At present, the 1st resistance is located at 1.1010, acting as a substantial swing high resistance. If price reacts off this resistance, we could expect a decline to our 1st support, identified at 1.0972 and known as a pullback support.
However, if price breaches the 1st resistance, it has the potential to climb towards our 2nd resistance, positioned at 1.1079, which is a notable multi-swing high resistance.
On the contrary, should the price break through the 1st support, it may continue its descent towards the 2nd support at 1.0912, another noteworthy pullback support.

EUR/JPY:
The EUR/JPY instrument is currently showcasing a bullish trend. The price is expected to bounce off the first support and continue its bullish momentum towards the first resistance.
The first support level is at 155.15 and is deemed strong due to being an overlap support and aligning with the 78.60% Fibonacci retracement level. The second support, situated at 154.03, is seen as a strong support level due to its status as a swing low support.
On the other hand, the first resistance is located at 156.97. It’s significant because it acts as an overlap resistance and aligns with the 61.80% Fibonacci retracement level. The second resistance level at 157.96 is considered noteworthy due to its status as a multi-swing high resistance, which could potentially pose a challenge to the price’s upward movement.

EUR/GBP:
The EUR/GBP pair currently exhibits a bearish momentum, a trend that is largely attributable to the price being positioned below the bearish Ichimoku cloud.
Given this bearish predisposition, there is potential for the price to continue its descent towards the first support level, located at 0.8524. This support is deemed strong, largely due to its status as a multi-swing low support. The second support is at 0.8493 and is considered robust due to it being an overlap support.
In contrast, the first resistance can be found at 0.8577. Its significance is derived from its overlap resistance characteristics. The second resistance, positioned at 0.8627, is noteworthy because of its overlap resistance nature and its correlation with the 78.60% Fibonacci retracement level, which could pose challenges to an upward price movement.

GBP/USD:
GBP/USD’s momentum is presently bullish, propelled by its position above the bullish Ichimoku cloud and above a major ascending trend line, suggesting further bullish momentum may be anticipated.
Given these factors, we could potentially see a bullish continuation towards the 1st resistance. The 1st support is found at 1.2847, operating as a pullback support. If price were to bounce off this support, we could anticipate a rise to our 1st resistance, which stands at 1.2916. This resistance aligns with a 61.8% Fibonacci projection and a 127.2% Fibonacci extension, adding credence to its role as a significant resistance level.
Should the price break the 1st resistance, it could potentially ascend towards the 2nd resistance at 1.3048, another pullback resistance. This resistance aligns with a 78.6% Fibonacci projection, marking it as a potential reversal zone.
Conversely, if price breaches the 1st support, it might continue to decline towards the 2nd support at 1.2753, which is a solid overlap support.

GBP/JPY:
The GBP/JPY instrument is currently demonstrating a bearish momentum. It’s anticipated that the price could potentially continue its bearish movement towards the first support level.
The first support is situated at 179.95 and is deemed significant as it represents a swing low support and aligns with the 23.60% Fibonacci retracement level. Additionally, the second support is located at 178.85 and is considered robust due to its overlap support and a 127.20% Fibonacci extension.
On the other hand, the first resistance is found at 182.10, marked by its overlap resistance. The second resistance, positioned at 183.89, is notable as it represents a multi-swing high resistance and is correlated with the 78.60% Fibonacci retracement level. This could potentially pose a significant barrier to any upward price movements.

USD/CHF:
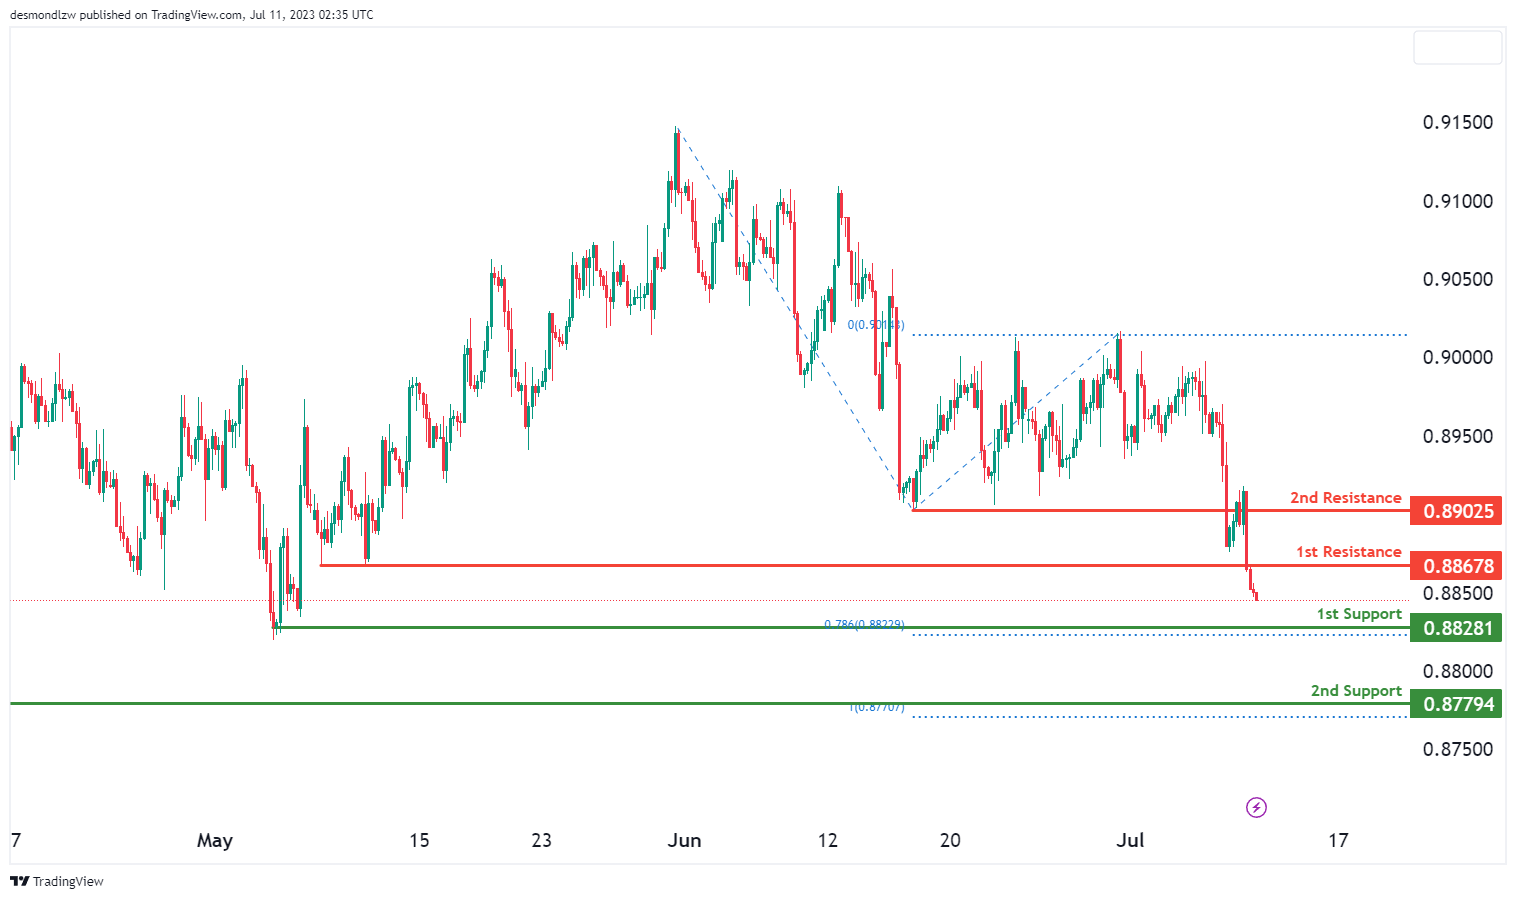
The overall momentum of USD/CHF is currently bearish, implying the possibility of a bearish continuation towards the 1st support.
The 1st support is identified at 0.8828, and it is considered to be a solid swing low support, aligning with the 78.6% Fibonacci projection. If the price reacts off this support, we might expect a decline to the 1st resistance, located at 0.8867, which serves as a pullback resistance.
On the flip side, if the price breaches our 1st resistance, it could potentially ascend towards the 2nd resistance at 0.8909, which is an overlap resistance.
However, if the price breaks the 1st support, it could potentially drop to the 2nd support at 0.8779, which is a significant swing low support and coincides with a 100% Fibonacci projection.
USD/JPY:
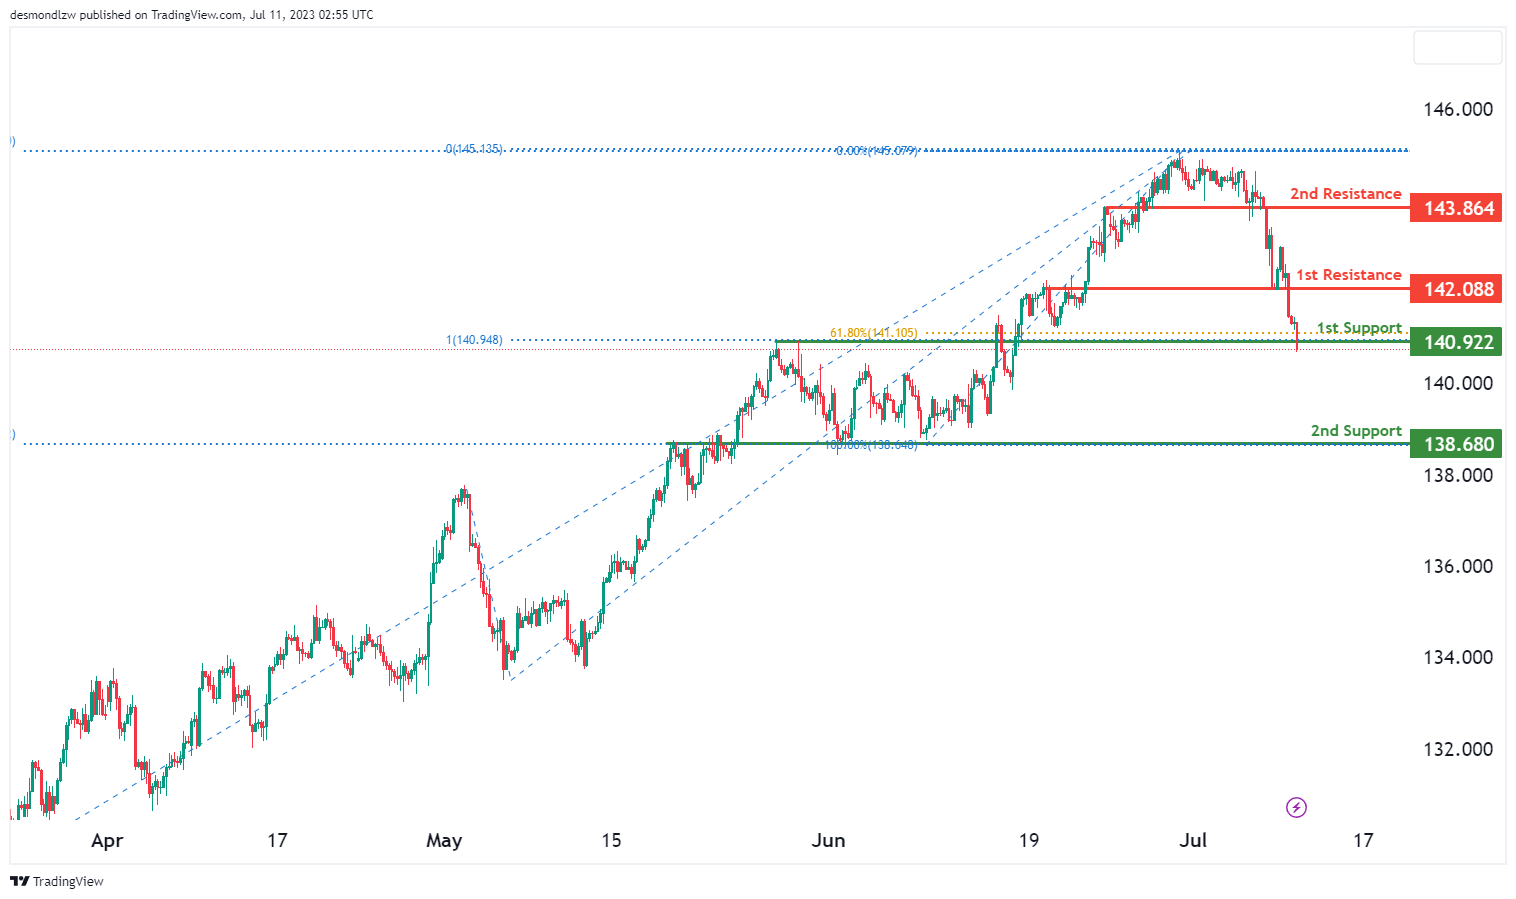
USD/JPY’s momentum is currently bullish, suggesting the possibility of a bullish bounce off the 1st support, propelling it towards the 1st resistance.
The 1st support level is found at 140.92. This level is a strong pullback support, coinciding with a 100% Fibonacci projection and a 61.8% Fibonacci retracement. If the price were to react positively to this level, it might propel itself towards the 1st resistance at 142.08, another significant pullback resistance.
If price manages to break past the 1st resistance, it could potentially rise towards the 2nd resistance at 143.86, which acts as another crucial pullback resistance.
Conversely, if price breaches the 1st support, it could potentially descend towards the 2nd support down at 138.68. This level serves as a robust overlap support.
USD/CAD:
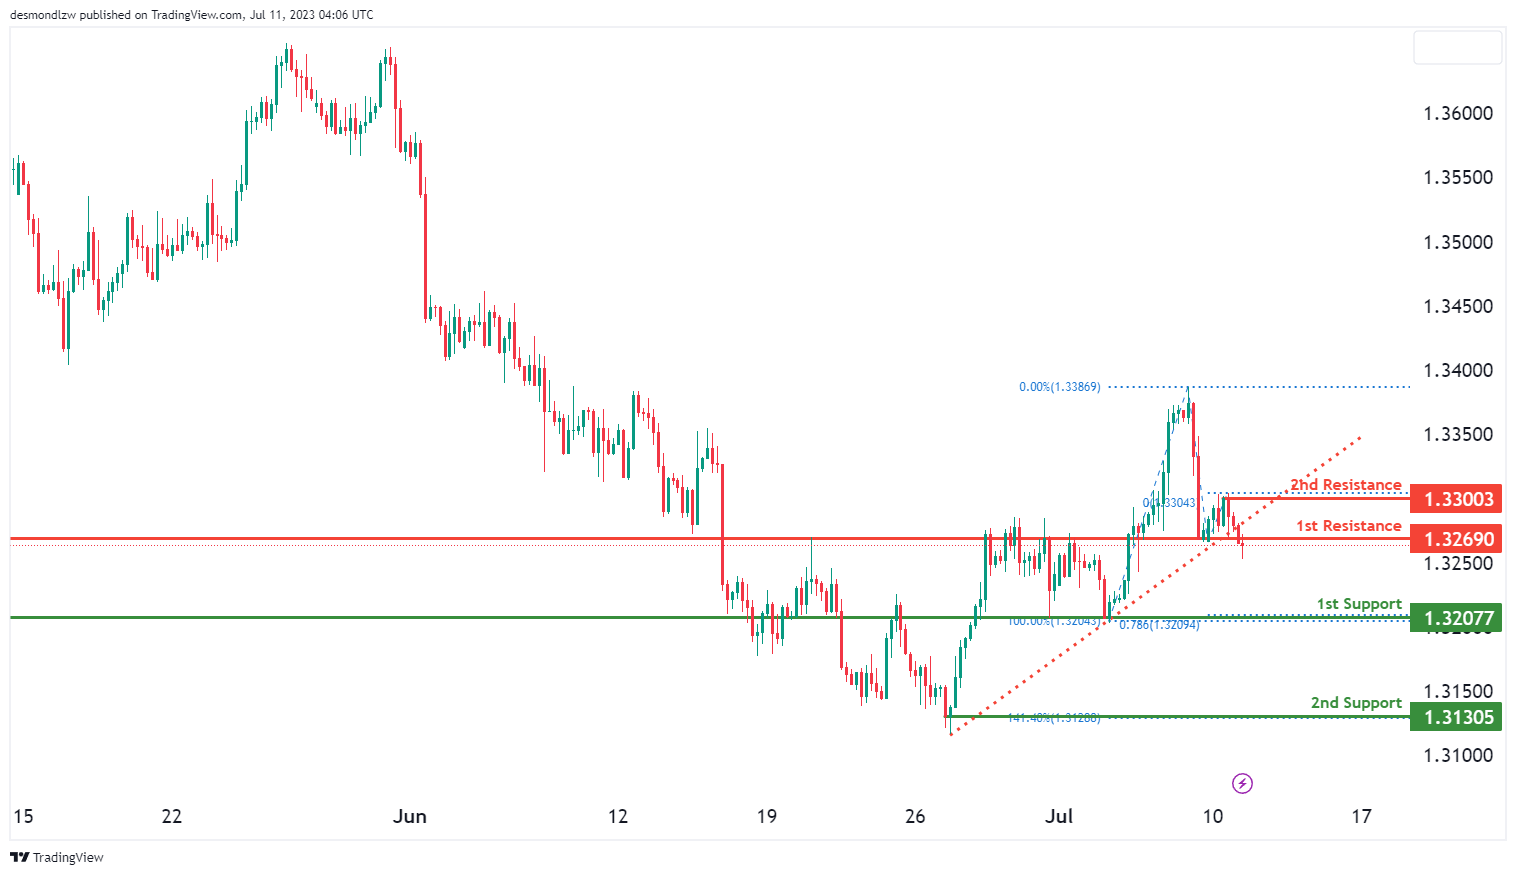
The USD/CAD chart currently demonstrates a weak bearish momentum, indicating the potential for a bearish continuation towards the 1st support level.
The 1st support is located at 1.3208 and is characterized as an overlap support, providing a significant level of price stability. Furthermore, this support level aligns with a 78.60% Fibonacci projection level, adding further significance to its role.
In addition, the 2nd support at 1.3131 acts as another overlap support and coincides with a 141.40% Fibonacci extension level, strengthening its importance as a potential level of support.
On the resistance side, the 1st resistance is positioned at 1.3269 and represents an overlap resistance. This level serves as a potential barrier to upward price movement.
Moreover, the 2nd resistance at 1.3300 is classified as a pullback resistance, suggesting a level where the price might face selling pressure.
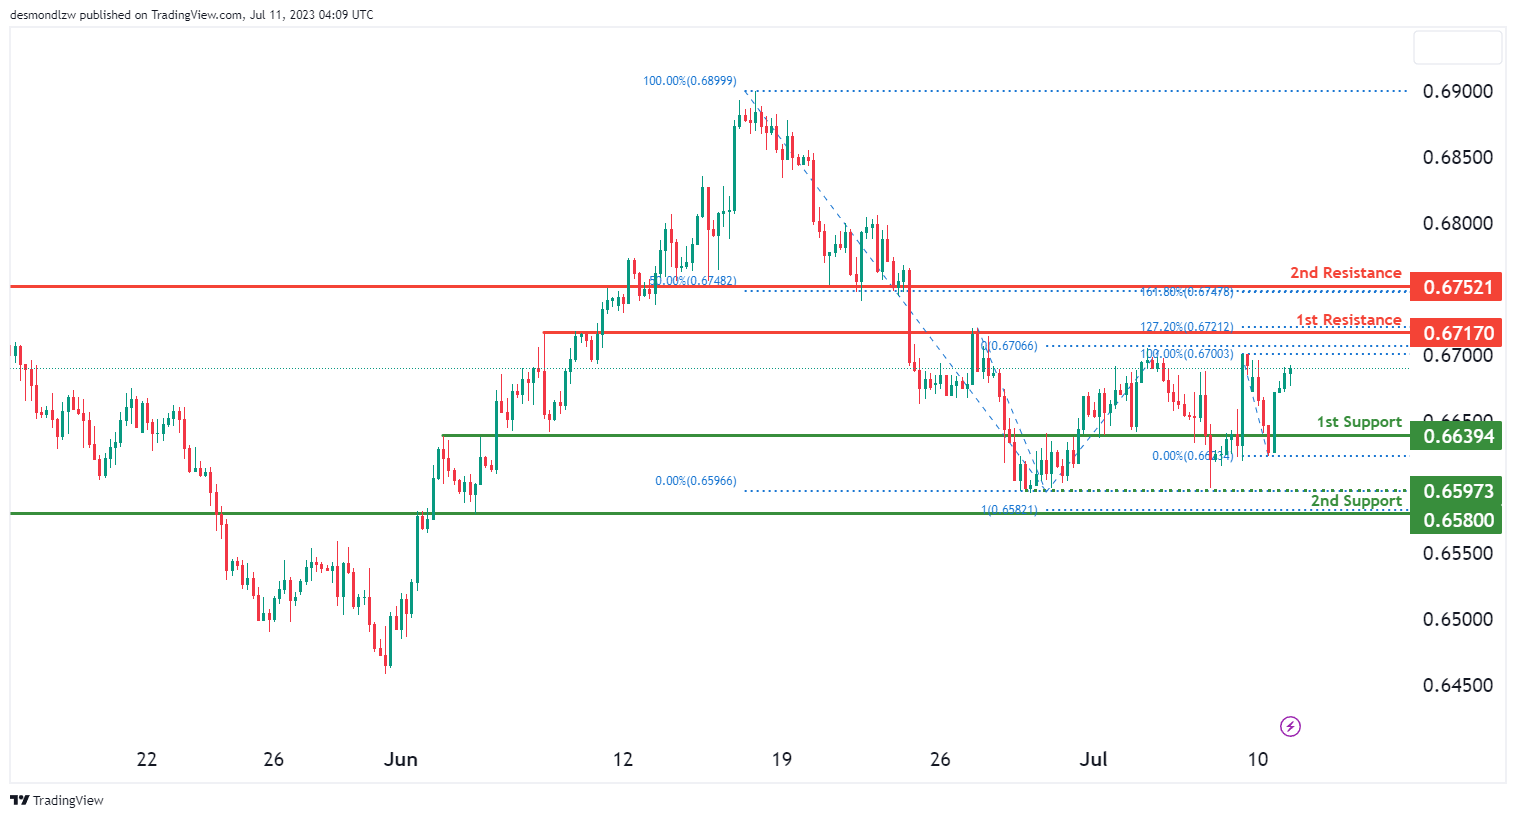
AUD/USD:
The AUD/USD chart currently exhibits a bullish momentum, indicating the potential for a bullish continuation towards the 1st resistance.
The 1st support level is located at 0.6639 and serves as an overlap support, providing a solid foundation for potential price stability. Additionally, the 2nd support at 0.6580 acts as an overlap support and coincides with a 100% Fibonacci projection level, adding further significance to this level.
On the upside, the 1st resistance is positioned at 0.6717, representing an overlap resistance. It is accompanied by a 127.20% Fibonacci extension level, emphasizing its importance as a significant barrier to further bullish movement. Should the price manage to surpass this resistance, it may target the 2nd resistance level at 0.6752. This level is characterized by an overlap resistance, a 50% Fibonacci retracement level, and a 161.80% Fibonacci extension level.
NZD/USD
The NZD/USD chart currently exhibits a weak bullish momentum with low confidence, suggesting the potential for a bullish continuation towards the 1st resistance.
The 1st support level is identified at 0.6220, representing an overlap support that provides a foundation for potential price stability. Additionally, the 2nd support at 0.6153 also acts as an overlap support, adding further significance to its role.
On the upside, the 1st resistance is positioned at 0.6246, characterized as a swing high resistance. It is accompanied by a 145.00% Fibonacci extension level and a 78.60% Fibonacci projection level, highlighting its importance as a significant barrier for further bullish movement. If the price manages to surpass this resistance, it may target the 2nd resistance level at 0.6297. This level is characterized by multi-swing high resistance and aligns with a 100% Fibonacci projection level.

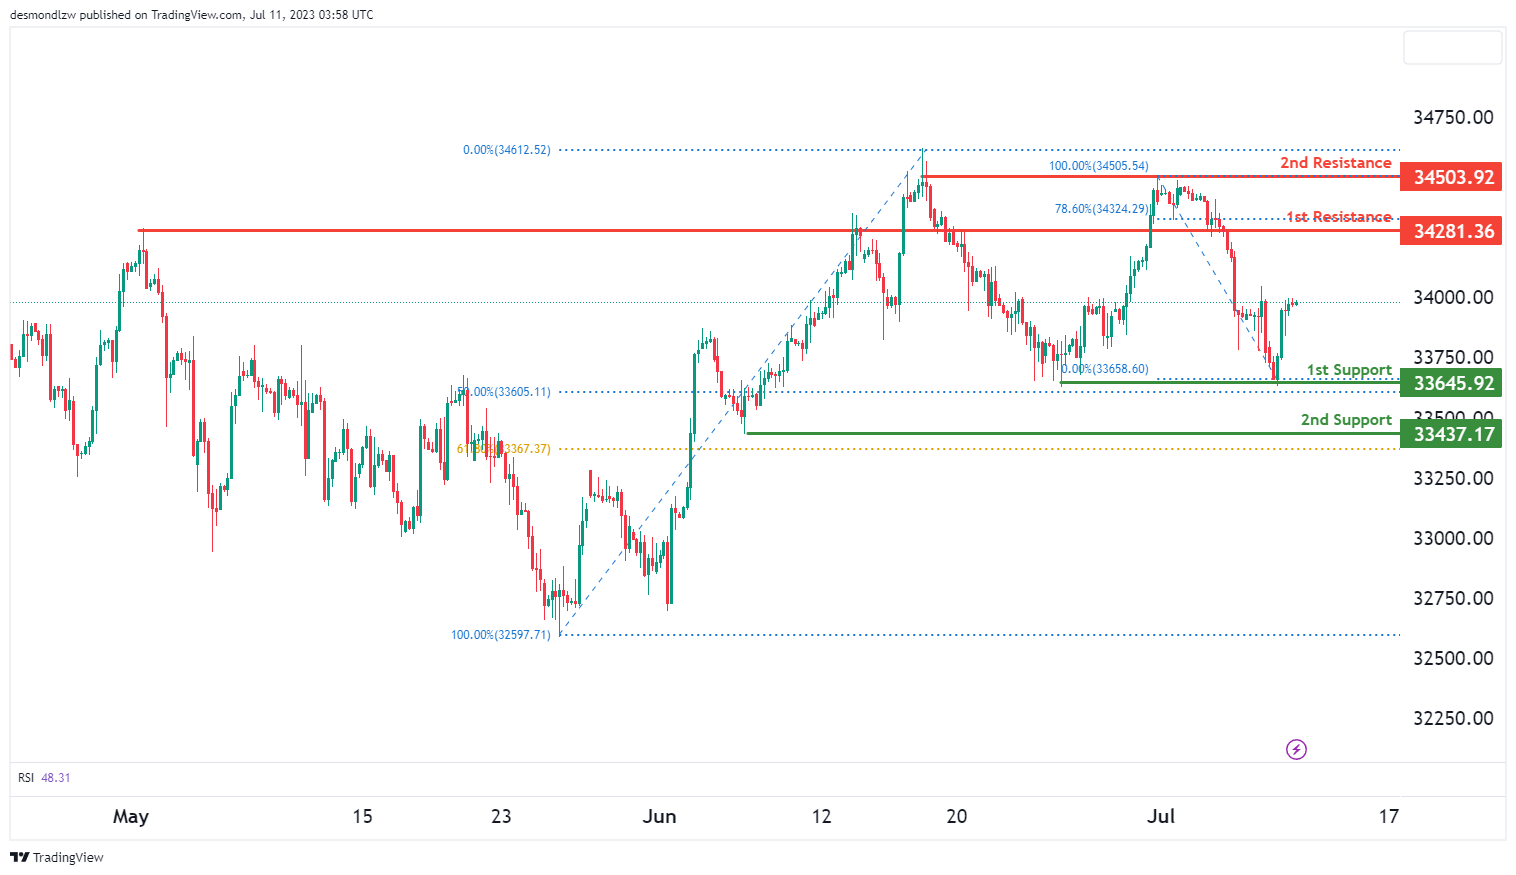
DJ30:
The DJ30 (Dow Jones Industrial Average) chart currently experiencing a bullish trend. Given this, it’s anticipated that the price might continue this bullish movement towards the first resistance.
The first support is located at 33645.92, which is considered a strong support level due to its multi-swing low support status and a 50% Fibonacci Retracement. There is a second support at 33437.17, which is deemed robust given that it’s a swing low support and at the 61.80% Fibonacci Retracement.
On the other hand, the first resistance is found at 34281.36. This resistance level is notable due to its overlap resistance and is located at the 78.60% Fibonacci Retracement. The second resistance is located at 34503.92 and is of importance due to it being a multi-swing high resistance. It could potentially hinder upward price movements.
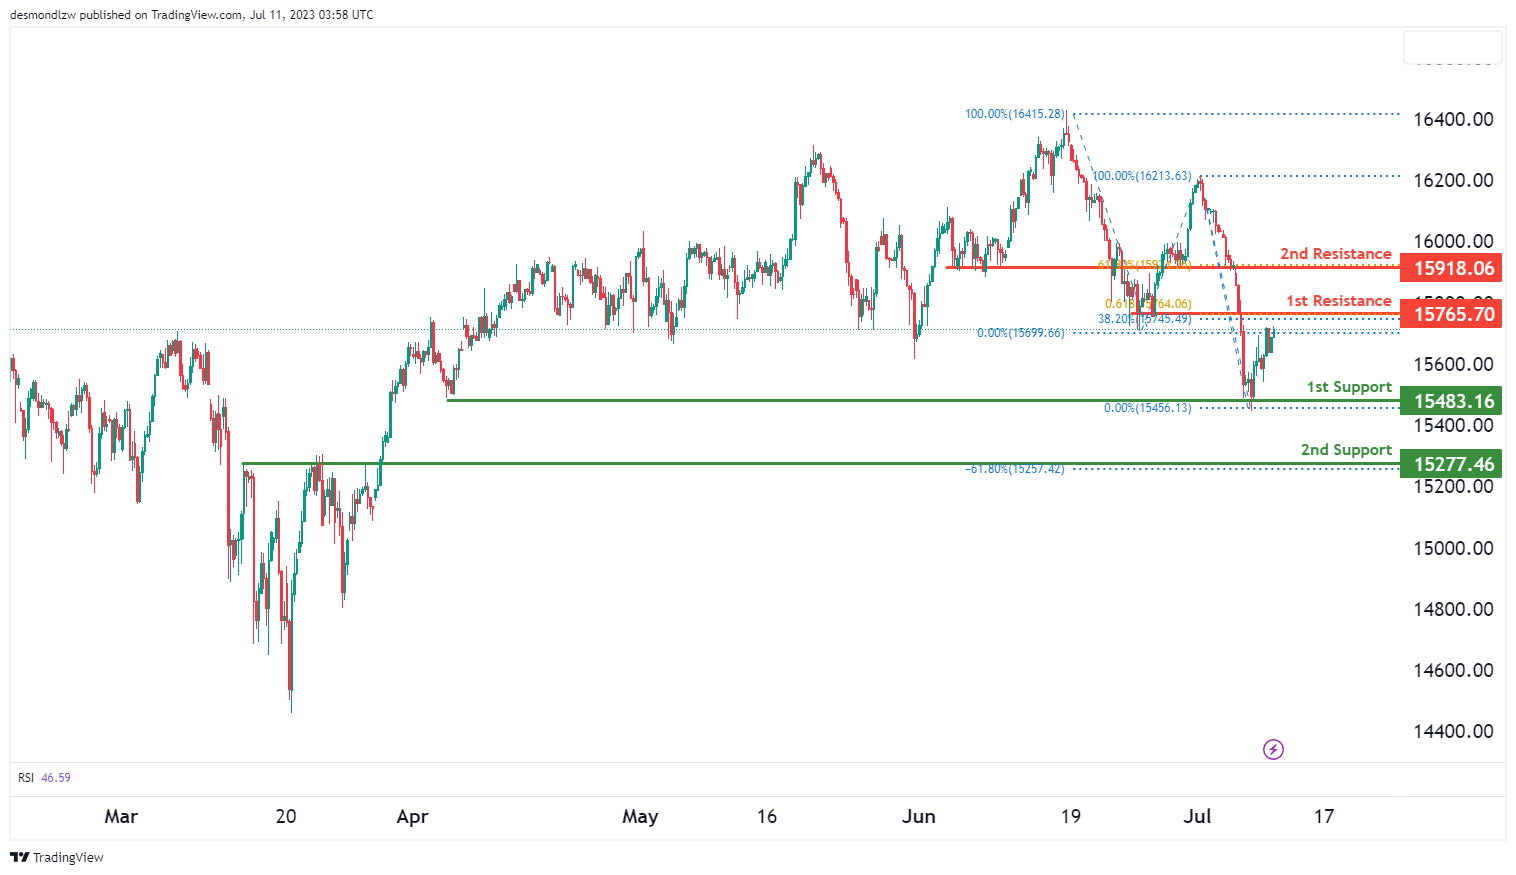
GER30:
The GER30 (DAX) chartcurrently shows a bullish momentum. It’s likely that the price may continue to rise towards the first resistance.
The first support, found at 15483.16, is deemed strong due to its role as a multi-swing low support. The second support is at 15277.46 and is recognized as solid given that it serves as an overlap support and is located at the -61.8% Fibonacci Expansion.
In contrast, the first resistance is at 15765.70, marked as significant due to its status as an overlap resistance. Additionally, it aligns with the 61.80% Fibonacci Projection and the 38.20% Fibonacci Retracement, indicating a Fibonacci confluence.
The second resistance is located at 15918.06 and is substantial due to its role as an overlap resistance and its position at the 61.80% Fibonacci Retracement. This could pose a potential barrier to upward price movements.
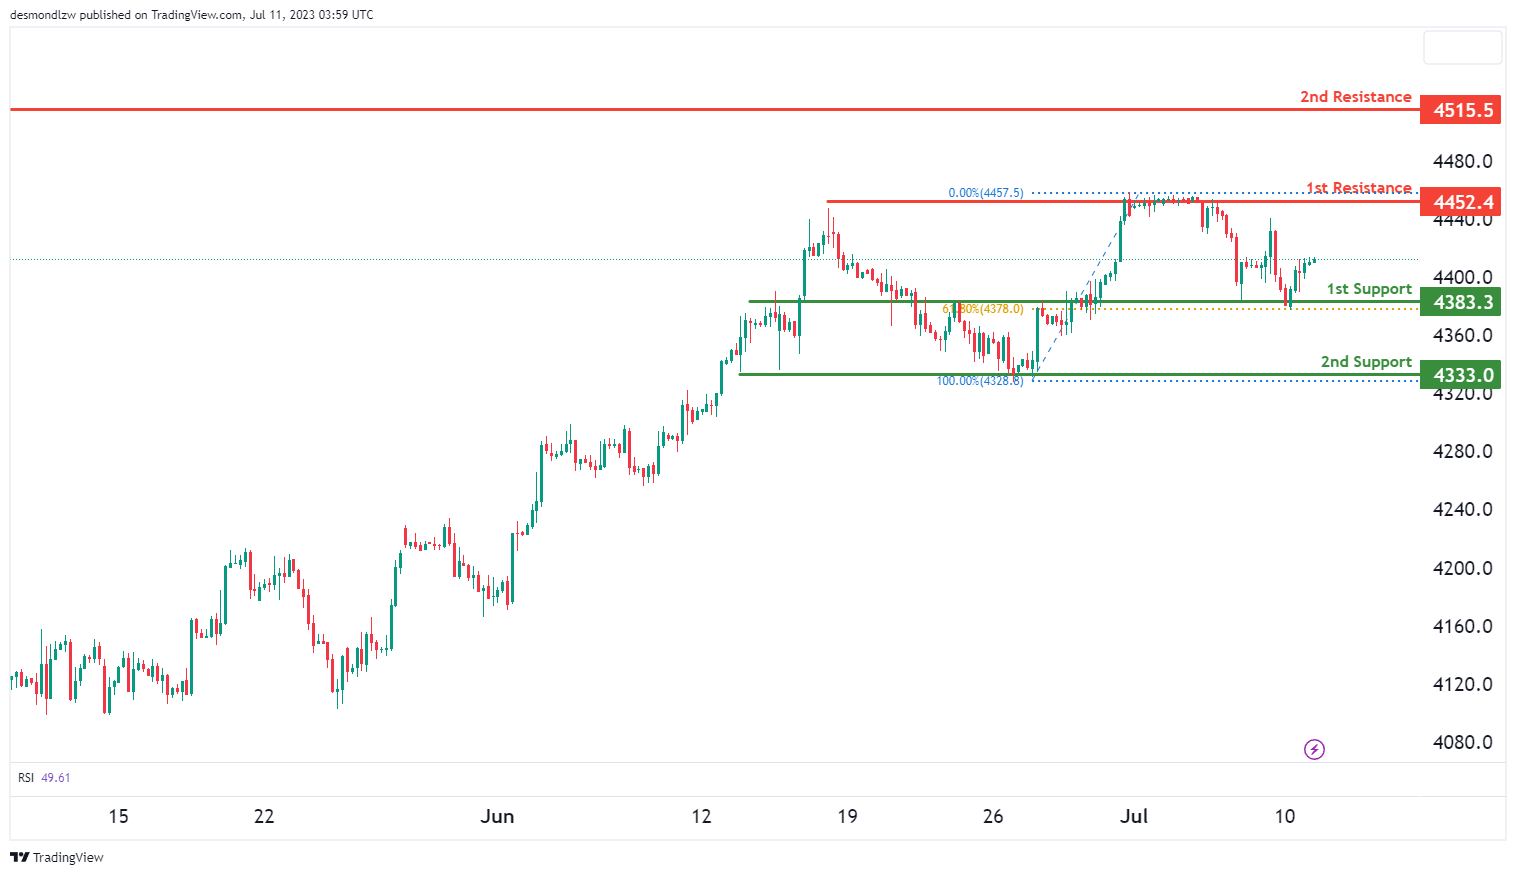
US500
The US500 (S&P 500) chart currently indicates a bullish trend. The price is anticipated to sustain its upward trajectory, moving towards the first resistance.
The first support level is at 4383.3 and is considered strong due to its position as an overlap support and its alignment with the 61.80% Fibonacci retracement level.Meanwhile, the second support is found at 4333.0, lending further strength due to its status as a multi-swing low support.
On the other hand, the first resistance is positioned at 4452.4. This level is noteworthy due to its role as a multi-swing high resistance, potentially posing a significant challenge to upward price movements.
The second resistance is situated at 4515.5 and holds significance as it’s marked as a swing high resistance, which could create an obstacle for price movements on the rise.
BTC/USD:
The BTC/USD instrument is currently showing a neutral overall momentum. It’s conceivable that the price might fluctuate between the 1st support and 1st resistance levels. The 1st support is positioned at 29826 and is viewed as strong due to its overlap support and a 23.60% Fibonacci Retracement.
The 2nd support, found at 28274, is also considered robust due to its overlap support and a 50% Fibonacci Retracement.
On the other hand, the 1st resistance is located at 31457 and is deemed significant owing to its multi-swing high resistance and a 61.80% Fibonacci Retracement. The 2nd resistance, at 32252, is notable for its swing high resistance nature, which could potentially pose a significant obstacle for any upward movement in price.

ETH/USD:
The ETH/USD instrument is currently on a bearish trend, largely attributed to the price trading below the bearish Ichimoku cloud.
As the trend proceeds, it’s probable that the price might continue on this bearish direction towards the 1st support, positioned at 1826.24. This support level is regarded as strong due to its character as a multi-swing low support.
Further on, the 2nd support stands at 1763.33 and is considered strong due to its overlap support and a 50% Fibonacci Retracement.
On the other hand, the 1st resistance is positioned at 1916.21 and is recognized as significant due to its overlap resistance and a 61.80% Fibonacci Retracement. The 2nd resistance, found at 1975.62, is also notable as it represents swing high resistance, and could potentially pose an obstacle to any upward price movements.
An intermediate support level is also noticeable at 1846.13, recognized as durable due to its status as a multi-swing low support.

WTI/USD:
The WTI/USD chart currently shows a bullish momentum, indicating the potential for a bullish continuation towards the 1st resistance.
The 1st support level is located at 72.78 and is considered a significant overlap support, further reinforced by a 23.60% Fibonacci retracement level. This level provides a solid foundation for potential price stability. Additionally, the 2nd support at 70.14 also acts as an overlap support and aligns with a 50% Fibonacci retracement level, adding further significance.
On the upside, the 1st resistance is situated at 74.25. This level represents an overlap resistance and is accompanied by a 127.20% Fibonacci extension and a 78.60% Fibonacci projection, marking it as a key hurdle for the bullish continuation. If the price manages to breach this resistance, it may target the 2nd resistance at 76.65. This level is characterized as an overlap resistance and coincides with a 61.80% Fibonacci retracement level.

XAU/USD (GOLD):
The XAU/USD pair is demonstrating a neutral trend, indicating possible price fluctuations between the 1st resistance and 1st support levels.
The 1st support level is positioned at 1912.34 and is classified as an overlap support, offering considerable stability for the price. Should the price descend below this level, it may encounter another protective layer at the 2nd support, identified at 1900.86, a noteworthy swing low support.
On the contrary, if the price advances, it could confront the 1st resistance at 1931.81. This overlap resistance is consistent with a 23.6% Fibonacci retracement and a 61.8% Fibonacci projection, representing a Fibonacci confluence, which further strengthens this resistance level.
Should the price succeed in surpassing the 1st resistance, it could set its trajectory towards the 2nd resistance located at 1945.96. This level coincides with a 100% Fibonacci projection, marking another key resistance point.
In addition, the present chart exhibits a symmetrical triangle pattern, symbolizing a period of price consolidation before the price is forced to either break out or break down. A move above the upper trendline of this pattern could signify a bullish breakout, while a plunge below the lower trendline could denote a bearish breakdown.

The accuracy, completeness and timeliness of the information contained on this site cannot be guaranteed. IC Markets does not warranty, guarantee or make any representations, or assume any liability regarding financial results based on the use of the information in the site.
News, views, opinions, recommendations and other information obtained from sources outside of www.icmarkets.com, used in this site are believed to be reliable, but we cannot guarantee their accuracy or completeness. All such information is subject to change at any time without notice. IC Markets assumes no responsibility for the content of any linked site.
The fact that such links may exist does not indicate approval or endorsement of any material contained on any linked site. IC Markets is not liable for any harm caused by the transmission, through accessing the services or information on this site, of a computer virus, or other computer code or programming device that might be used to access, delete, damage, disable, disrupt or otherwise impede in any manner, the operation of the site or of any user’s software, hardware, data or property.


