
A note on lower timeframe confirming price action…
Waiting for lower timeframe confirmation is our main tool to confirm strength within higher timeframe zones, and has really been the key to our trading success. It takes a little time to understand the subtle nuances, however, as each trade is never the same, but once you master the rhythm so to speak, you will be saved from countless unnecessary losing trades. The following is a list of what we look for:
- A break/retest of supply or demand dependent on which way you’re trading.
- A trendline break/retest.
- Buying/selling tails – essentially we look for a cluster of very obvious spikes within the higher timeframe zone.
- Candlestick patterns. We tend to only stick with pin bars and engulfing bars as these have proven to be the most effective.
EUR/USD:
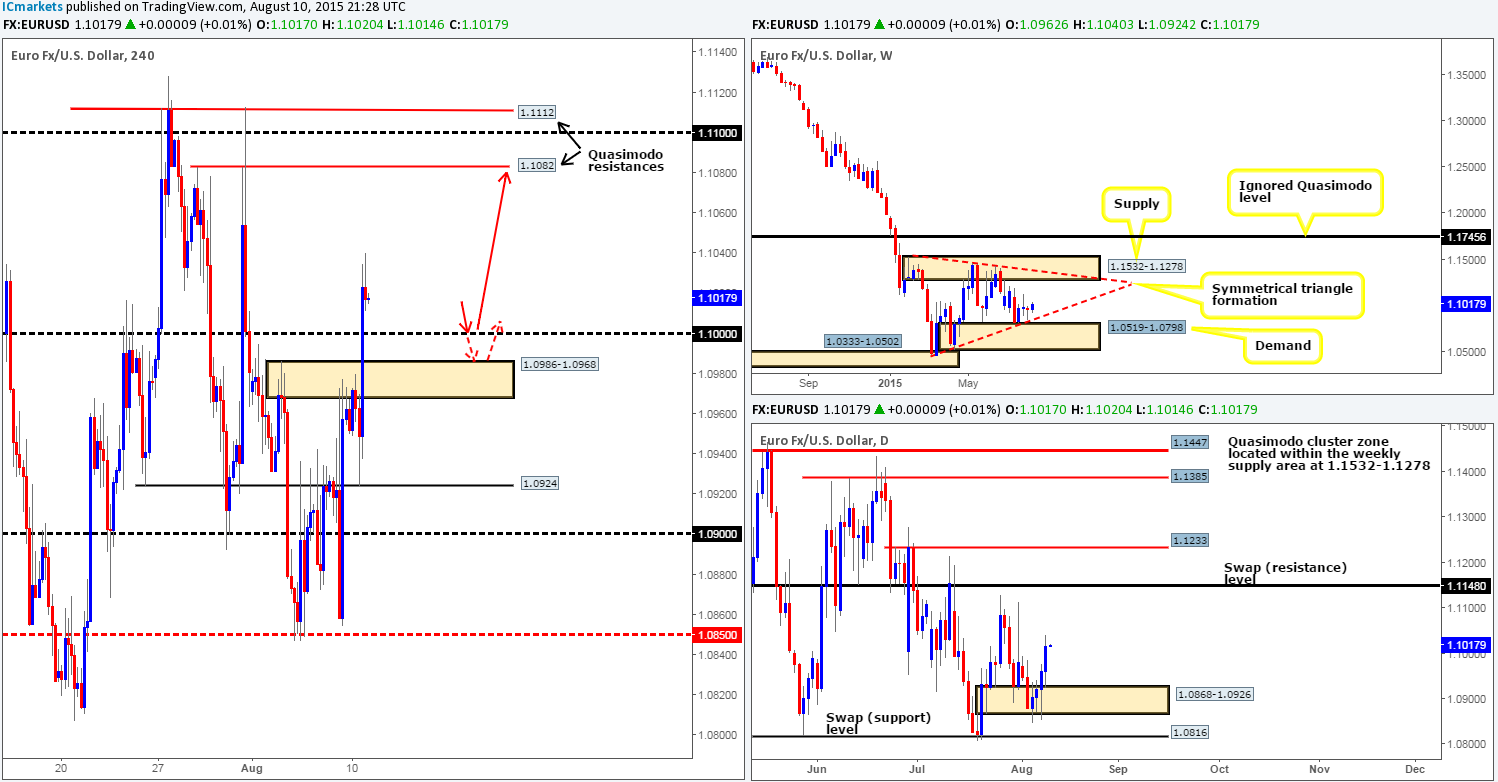
Mid-way through yesterday’s London morning trade, we can see that offers came into the EUR/USD market around the 4hr supply area coming in at 1.0986-1.0968. This consequently drove price down towards a 4hr swap (support) level at 1.0924, which, as you can see, was clearly enough to support a counter-attack of over 100 pips, resulting in both the aforementioned 4hr supply zone and the psychological resistance 1.1000 being consumed.
With both the 4hr supply and round-number resistance now out of the picture and the higher timeframes still showing little resistance on the horizon at least until the daily swap (resistance) level at 1.1148, the path north is likely clear for further buying today/tomorrow up to at least the 4hr Quasimodo resistance barrier 1.1082. However, buying this pair will only become a possibility for us once/if price retests either 1.1000 or 1.0986-1.0968 (red arrows), and shows some form of lower timeframe buying confirmation.
In addition to the above, traders should go in with the expectation here that a fakeout below 1.1000 will likely be seen (hopefully right into our second area of interest), since stop losses below this number (sell stops – great for buying liquidity) are just begging to be snapped up, so trade carefully here.
Levels to watch/live orders:
- Buys: 1.1000 [Tentative – confirmation required] (Stop loss: dependent on where one confirms this level) 1.0986-1.0968 [Tentative – confirmation required] (Stop loss: 1.0965).
- Sells: Flat (Stop loss: N/A).
GBP/USD:
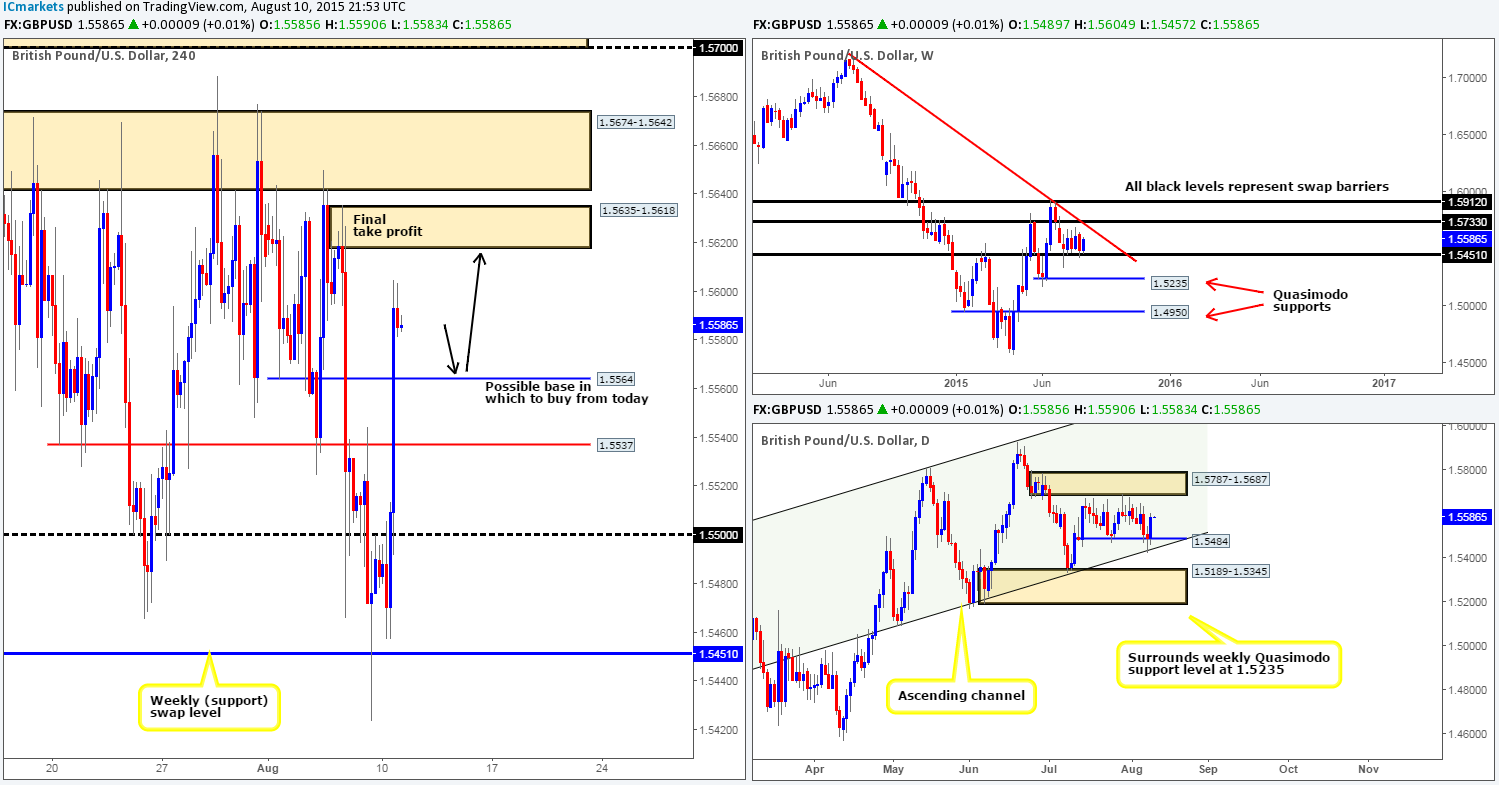
For those who read our previous report on Cable http://www.icmarkets.com/blog/monday-10th-august-weekly-technical-outlook-and-review/ you may recall us mentioning to keep a close eye on 1.5500 for a potential break and retest buying opportunity. As you can see, this played out to perfection. Price closed above 1.5500 mid-way through the London session, and retested it as support going into the early hours of the U.S. session. We managed to find a beautiful entry long on the 5 minute timeframe via a pin-bar candle painted at 13.20pm GMT yesterday. Partial profits were quickly taken at 1.5537 and 1.5564 with 30% of our remaining position still left to run in the market with the hope of price reaching 4hr supply coming in at 1.5635-1.5618. Before this happens though, we’re prepared for a possible retracement to retest 1.5564 as support (see black arrows), which in itself, could provide a nice base in which to pyramid our current long position today should we see corresponding lower timeframe confirming price action.
This drive north should not come as much of a surprise, however, since as we mentioned in yesterday’s report, price was trading at not only a weekly swap (support) level at 1.5451, but also daily support drawn from 1.5484, as well as the daily ascending channel support taken from the low 1.5087.
Levels to watch/ live orders:
- Buys: 1.5564 [Tentative – confirmation required] (Stop loss: dependent on where one confirms this level).
- Sells: Flat (Stop loss: N/A).
AUD/USD:
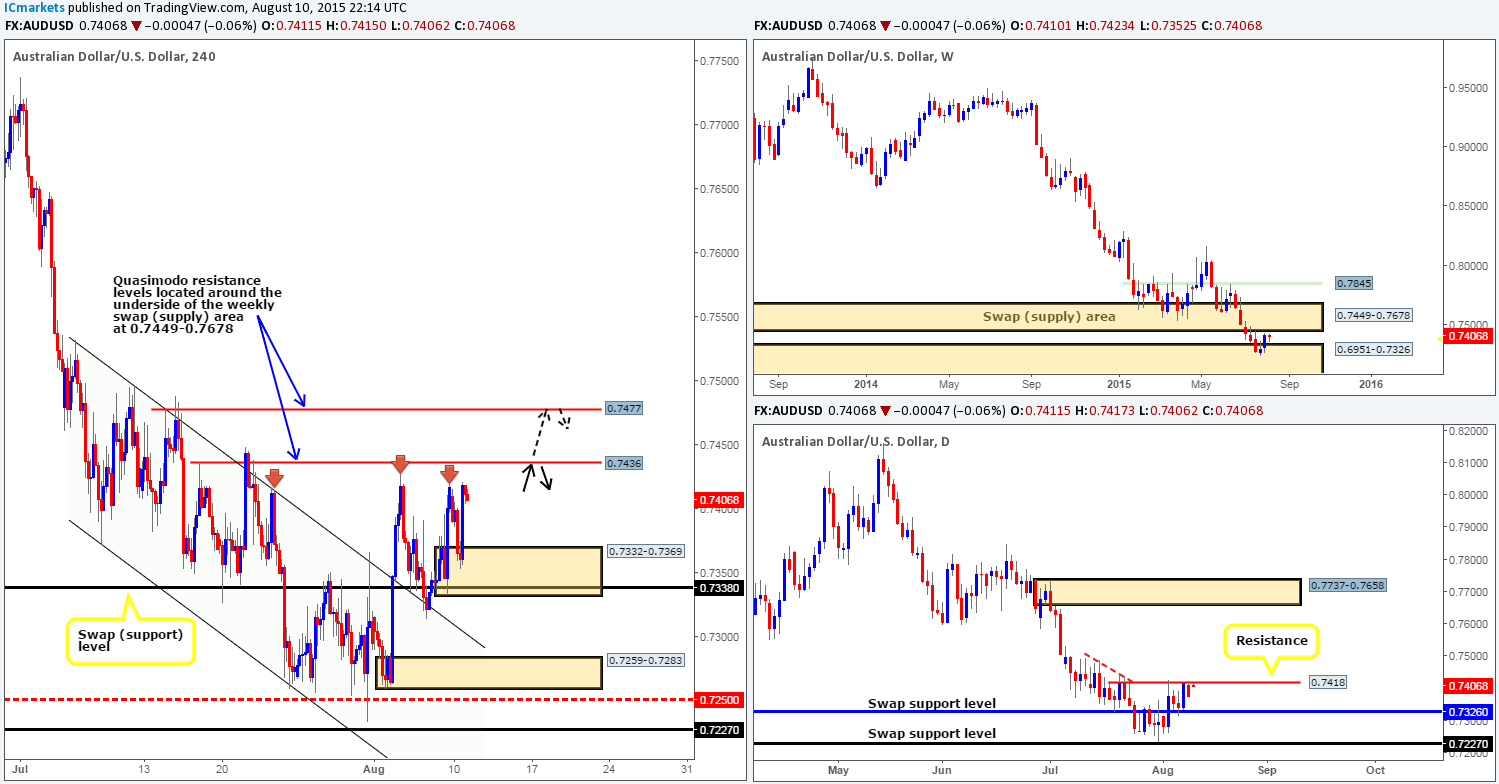
Throughout the course of yesterday’s sessions, we can see that price sold off to tie-in with 4hr demand seen at 0.7332-0.7369, which was aggressively defended going into the U.S. open. With price closing the day only a pip above Sunday’s open (0.7410) at 0.7411, much of the following analysis will remain similar to the previous…
In view of price trading at not only a minor daily resistance level at 0.7418, but also just below a long-term weekly swap (supply) area at 0.7449-0.7678, we feel that this market will likely struggle to trade much higher this week. With this, we are currently eyeing 0.7436 and 0.7477 for potential shorts today/this week, which are both 4hr Quasimodo resistance levels located around the underside of the aforementioned weekly swap (supply) zone. In addition to this, the highs marked with red arrows at: 0.7416/0.7427/0.7418 are just begging to be faked, thus making our chosen 4hr Quasimodo resistance levels that much more attractive!
We would strongly advise against placing pending orders at the above said 4hr levels simply because for one, price can fake higher and take you out, and two, it is difficult to know which level will react, if any! Waiting for lower timeframe confirmation here may help avoid these unnecessary losses.
Levels to watch/ live orders:
- Buys: Flat (Stop loss: N/A).
- Sells: 0.7436/0.7477 [Tentative – confirmation required] (Stop loss: Dependent on where one confirms these levels).
USD/JPY:
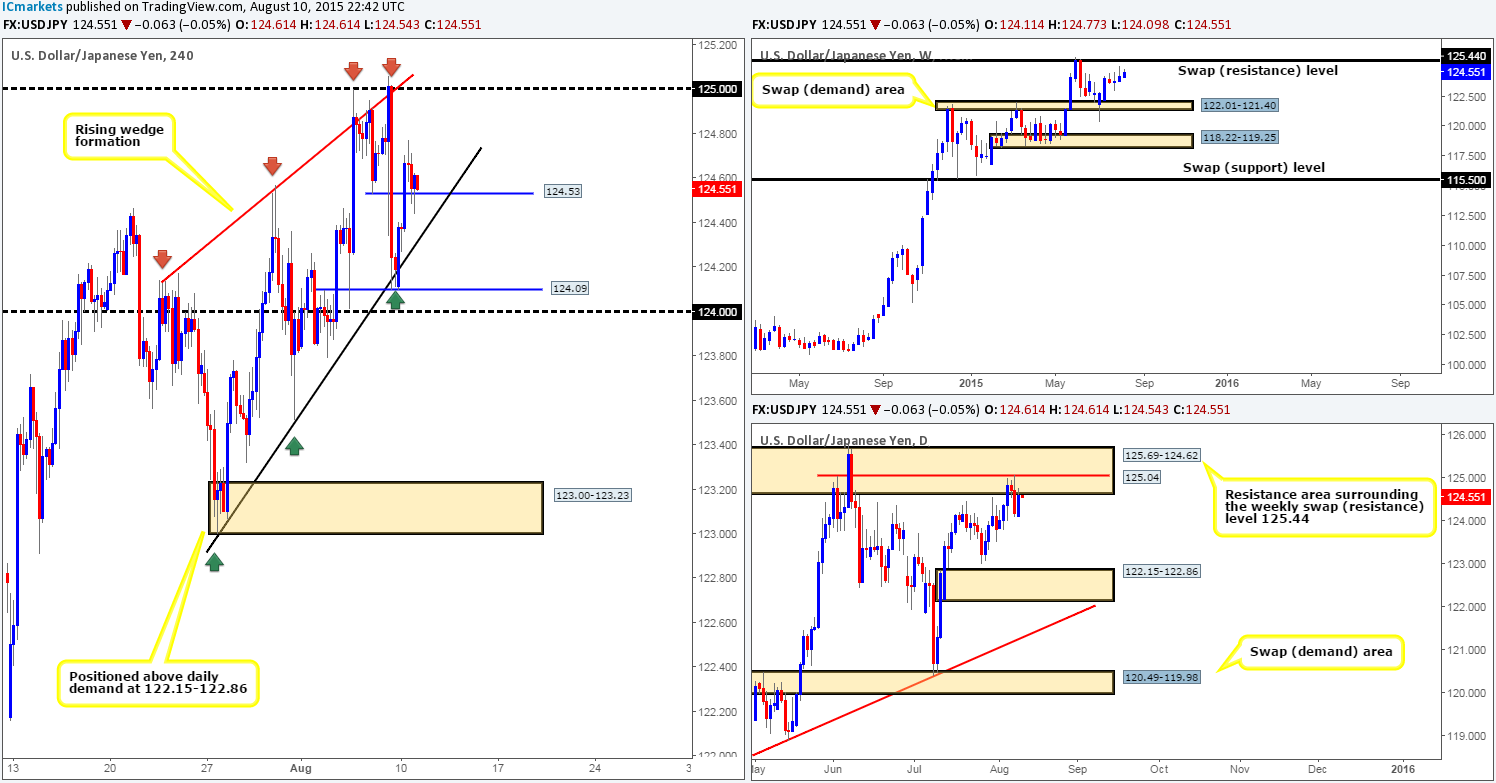
The USD/JPY pair, as you can see, responded beautifully yesterday to the 124.09 support area. This barrier converges with the 4hr trendline (which forms the lower limit of the current risking wedge pattern in play) extended from the low 123.00 as well as additional support falling in just below from the psychological number 124.00. The buying seen from this zone saw price cleanly close above a minor 4hr swap (resistance) level at 124.53, and is, as of writing, providing support to this market.
Buying right now with a long-term or even a medium-term outlook would not be the best path to take in our opinion due to where price is currently located on the higher timeframe picture. The weekly chart shows resistance coming in at 125.44; meanwhile on the daily chart price is trading around the underside of a daily resistance area at 125.69-124.62 as we write.
However, seeing as price is currently respecting 124.53 as 4hr support, there may be a potential intraday long opportunity from here today, targeting 125.00. Waiting for the lower timeframes to confirm this level’s strength is advised since there is very little support below this level stopping prices from faking/spiking lower and taking out your stops.
Once or indeed if price does reach 125.00, this could be a fantastic base in which to look to enter short into this market. Nevertheless, we would advise placing your stop above the aforementioned daily resistance area (even if you manage to confirm this area on the lower timeframes) to avoid being stopped out if price wanted to connect with the aforementioned weekly resistance level. If one is not comfortable with this type of stop-loss size, you could alternatively wait to see if price breaches 125.00 and then look for lower timeframe confirmed shorts at the weekly resistance level itself with a smaller stop (above daily resistance area) and greater risk/reward.
Levels to watch/ live orders:
- Buys: 124.53 [Tentative – confirmation required] (Stop loss: dependent on where one confirms this level).
- Sells: 125.00 [Tentative – confirmation required] (Stop loss: dependent on where one confirms this level) 125.44 [Tentative – confirmation required] (Stop loss: dependent on where one confirms this level).
USD/CAD:
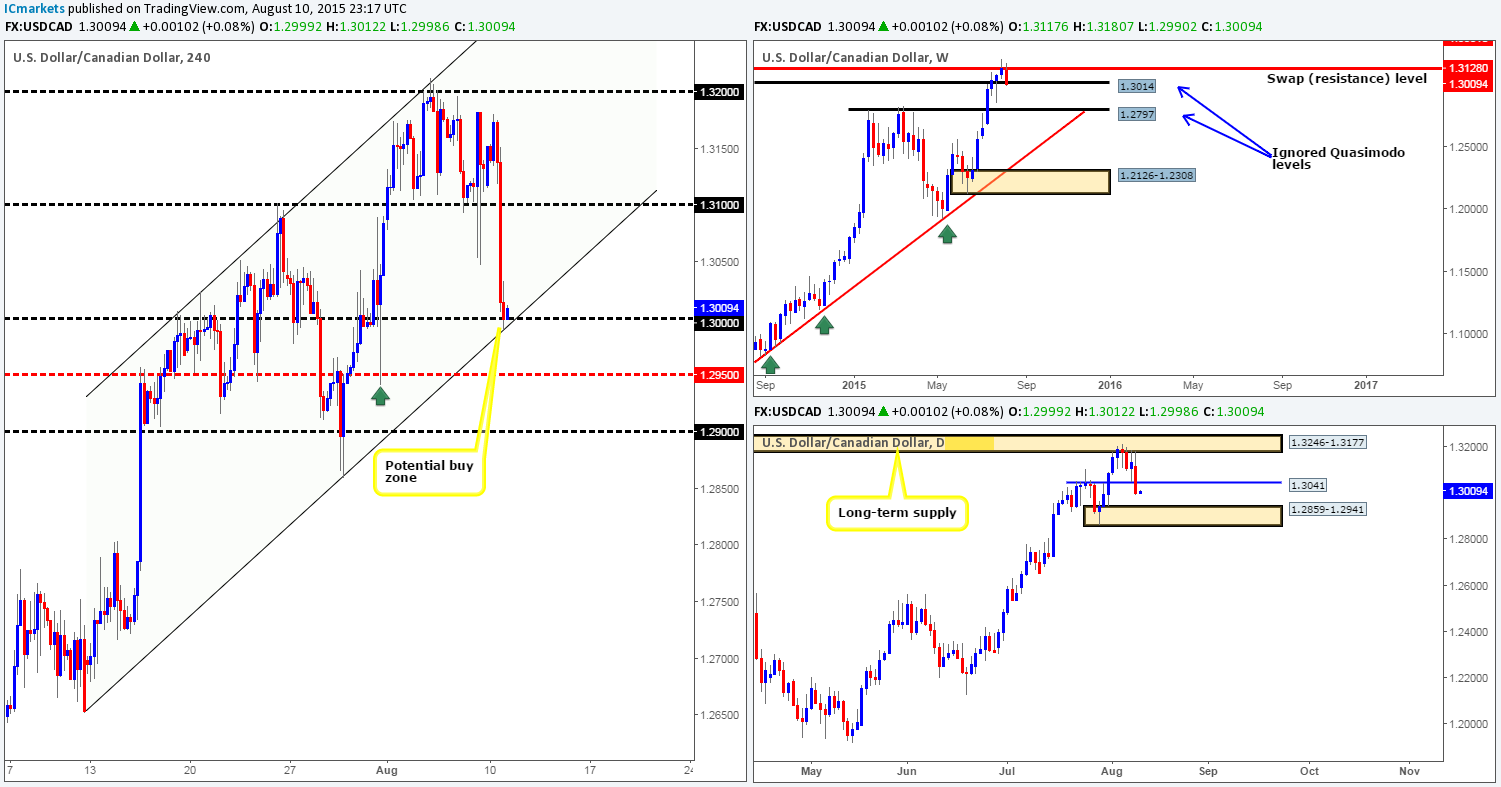
Heavy selling was seen during yesterday’s sessions surpassing the psychological support 1.3100 and driving into the lower limits of the current 4hr ascending channel (1.2652/1.3023), which, as you can see, also boasts psychological support from 1.3000.
In that price is now trading at a potential buy zone on the 4hr structure, where do we stand in the bigger picture? Well, from the weekly scale, price is now trading just below an ignored weekly Quasimodo level at 1.3014 which could potentially still support this market. The daily timeframe on the other hand, shows that price recently closed below a minor daily swap (support) level at 1.3041, and as a result, the path south now appears to be clear down towards a daily demand zone coming in at 1.2859-1.2941.
On account of the above, our approach to this market today will be centered around buying from 1.3000 on the basis that weekly support from the ignored Quasimodo level mentioned above will kick in and back this trade up. For safety however, we would advise waiting for the lower timeframes to show some buying strength at 1.3000 before committing capital, as this could save you from an agonizing 60-pip drawdown down to the aforementioned daily demand zone and also keep you out of a losing trade.
Levels to watch/ live orders:
- Buys: 1.3000 [Tentative – confirmation required] (Stop loss: dependent on where one confirms this level).
- Sells: Flat (Stop loss: N/A).
USD/CHF:
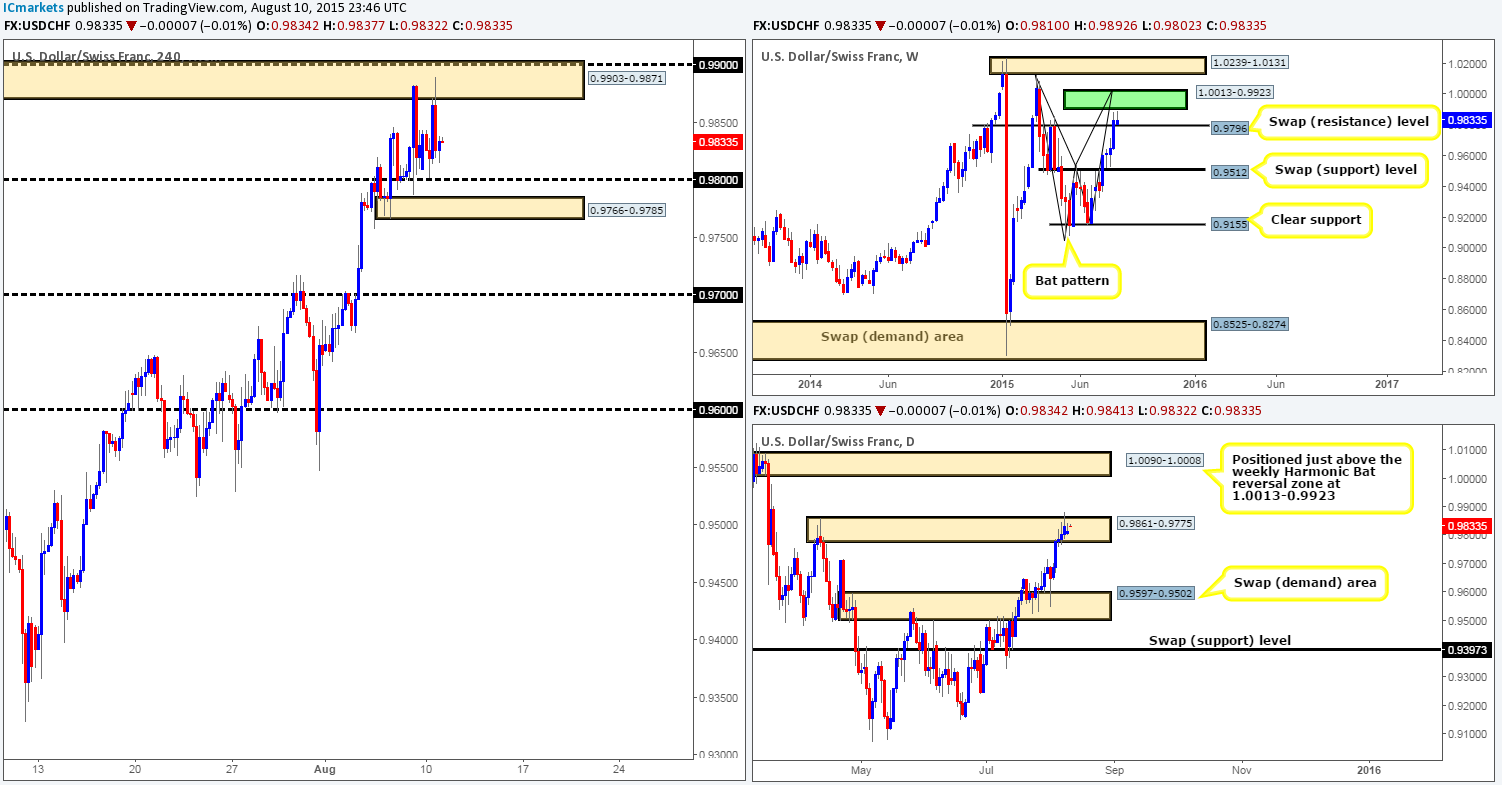
The USD/CHF pair, as you can see, has now entered into a minor phase of consolidation between 4hr supply coming in at 0.9903-0.9871 and round-number support at 0.9800.
Now, considering that this temporary range has set itself up within the confines of a daily supply area at 0.9861-0.9775, price will likely breakout south, right? Not necessarily. Check out the weekly timeframe, can you see how close price is to connecting with the lower limits of a weekly Harmonic Bat completion zone at 1.0013-0.9923? With this, price could rally further north before seeing any sort of decent move to the downside. For this reason, our plan of attack today, and possibly for the remainder of the week, will consist of looking for lower timeframe confirmed sell trades within either the 4hr supply area located just above the current at 0.9982-0.9936, or an area of 4hr supply positioned much higher up on the curve at 1.0068-1.0046.
Notice that the closest 4hr supply zone is located nicely within our weekly Harmonic resistance area, while the other is positioned just above it within a strong looking daily supply zone coming in at 1.0090-1.0008. These two 4hr areas of supply are what we’d consider high-probability turning points in the market.
Levels to watch/ live orders:
- Buys: Flat (Stop loss: N/A).
- Sells: 0.9982-0.9936 [Tentative – confirmation required] (Stop loss: dependent on where one confirms this area since a fakeout could be seen above to parity) 1.0068-1.0046 [Tentative – confirmation required] (Stop loss: 1.0077).
DOW 30:
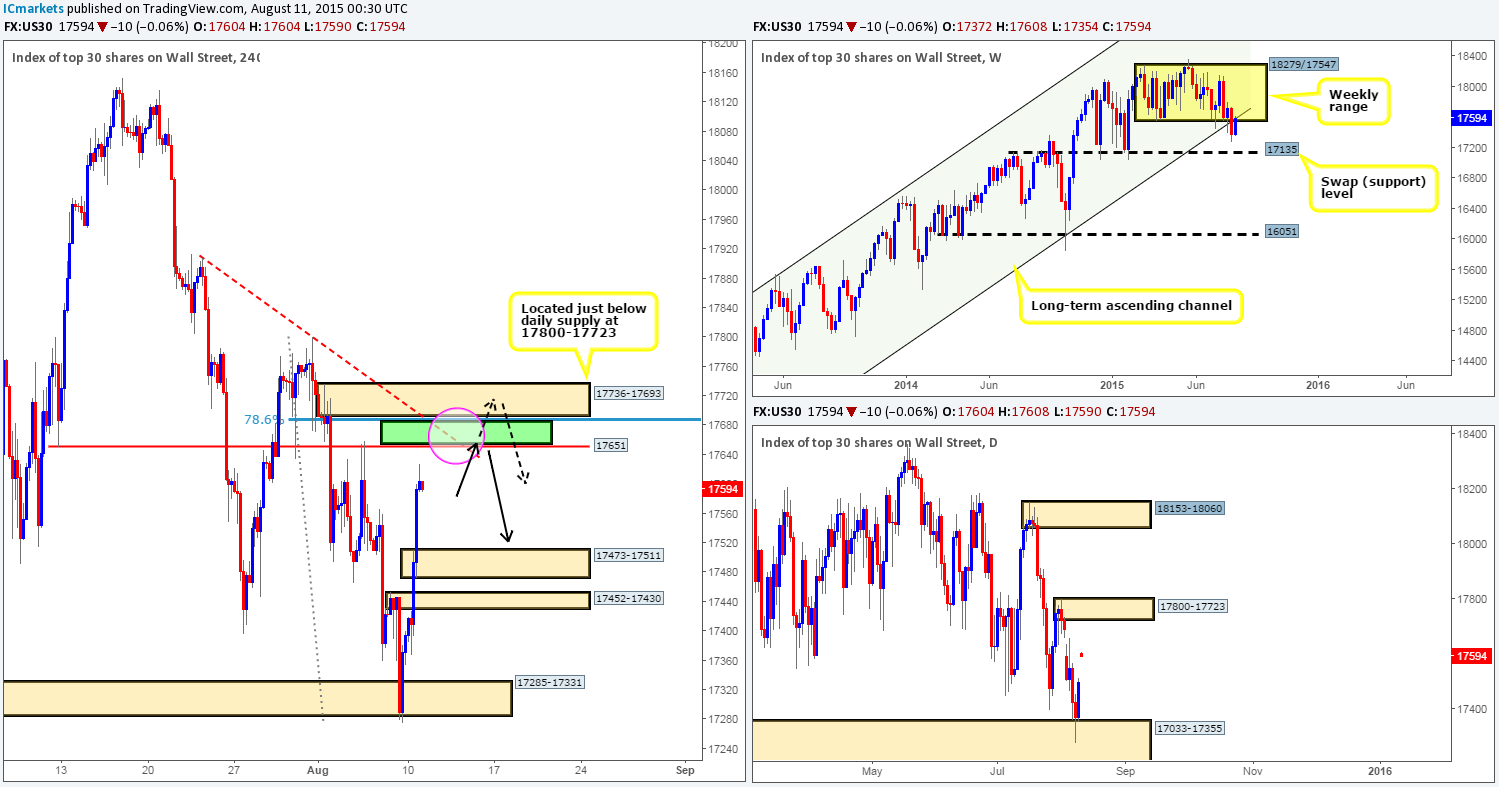
Amid yesterday’s sessions the DOW index continued to rally higher, punching through offers sitting around both the 4hr supply at 17452-17430 and the 4hr ignored Quasimodo level seen at 17494 (now a 4hr demand zone at 17473-17511), consequently reaching highs of 17628 on the day.
Considering that the weekly timeframe shows price is now retesting both the underside of the weekly range lower limit 17547and its converging weekly ascending channel support – turned resistance taken from the low 10402, our attention will mostly be driven toward shorts today. In that event, we’re currently eyeing the 4hr swap (resistance) region at 17651 for potential selling opportunities today (green area), which, as you can see, coincides nicely with a 4hr down trendline extended from the high 17908.
One will have to be careful selling from this 4hr swap (resistance) barrier, however, due to the possibility that price may fake higher to connect with the 4hr supply zone just above it (that boasts additional resistance from the 78.6% Fibonacci level) at 17736-17693 (positioned just below daily supply at 17800-17723). Therefore, we would advise waiting for the lower timeframes to confirm whether it is worth shorting at 17651 before actually risking capital to this idea, as there is nothing worse than getting stopped out by a couple of points only to see price hit your take profit!
Levels to watch/ live orders:
- Buys: Flat (Stop loss: N/A).
- Sells: 17651 [Tentative – confirmation required] (Stop loss: dependent on where one confirms this area) 17736-17693 [Tentative – confirmation required] (Stop loss: dependent on where one confirms this level).
XAU/USD: (Gold)
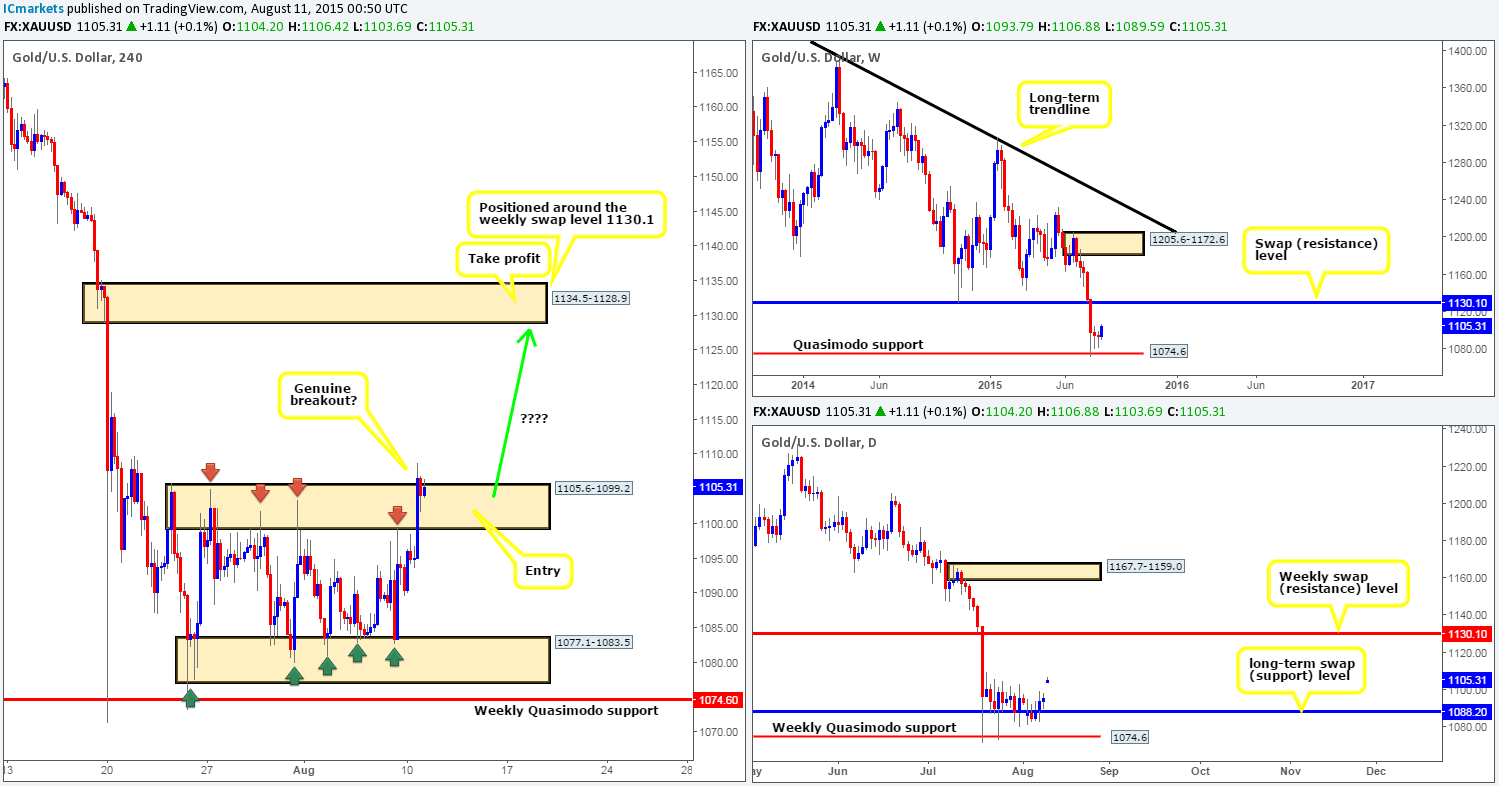
Following nearly three weeks of ranging action on the 4hr timeframe between the 4hr demand at 1077.1-1083.5 and 4hr supply at 1105.6-1099.2, a heavy round of bids entered the market during yesterday’s sessions forcing price to breakout of this consolidation.
In the event that this breakout is indeed genuine, there may be a potentially humongous trade opportunity setting up. Our rationale behind this idea comes from the following:
- Weekly buyers may still be in the market from the weekly Quasimodo support level at 1074.6.
- The daily swap (support) level at 1088.2 is also providing extra support in this market.
- Space seen above the current 4hr range up to 4hr supply area coming in at 1134.5-1128.9 (conveniently positioned around the weekly swap [resistance] level at 1130.1).
Therefore, should the buyers be able to hold this market above the recently broken 4hr supply barrier, there may be a long opportunity if corresponding lower timeframe confirmation is also seen. The reasons for requiring confirmation at this area is simply due to not knowing whether this recently broken supply will hold as demand, and also being unable to tell if price will fakeout lower before driving higher. Too many times we have seen traders pick a correct area but are taken out on a small fakeout spike! Nothing is more frustrating!
The target for this trade is simply the 4hr supply area mentioned above at 1134.5-1128.9. I t will be interesting to see how this plays out.
Levels to watch/ live orders:
- Buys: 1105.6-1099.2 [Tentative – confirmation required] (Stop loss: dependent on where one finds confirmation in this area).
- Sells: Flat (Stop loss: N/A).


