
Key risk events today:
Limited.
(Previous analysis as well as outside sources – italics).
EUR/USD:
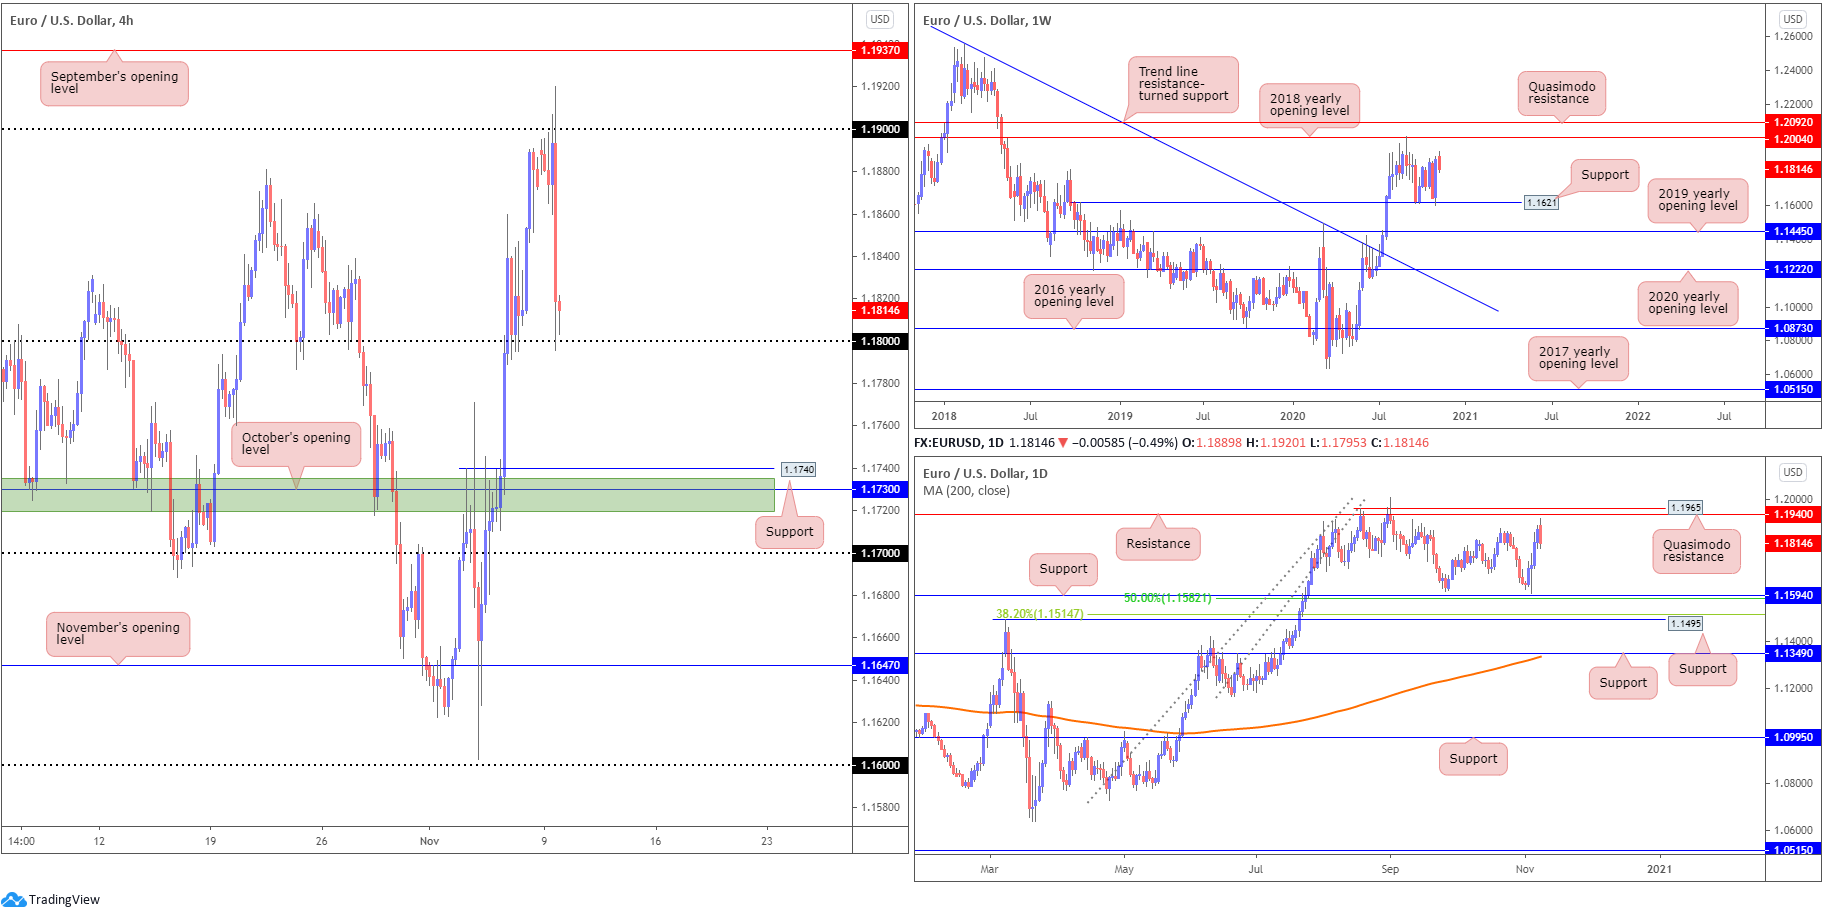
EUR/USD, as we head into the closing stages of Monday’s explosive session, touches gloves with the 1.18 handle on the H4 after finding thin air north of 1.19. Efforts to hold things off 1.18 are proving difficult, proposing moves to support at 1.1740 (a previous Quasimodo resistance), as well as a support zone (green) around 1.1719-1.1735 and October’s opening value at 1.1730.
Further afield on the weekly timeframe, we’ve so far failed to build on last week’s 2% advance, despite technical structure indicating room to advance towards the 2018 yearly opening value at 1.2004, closely shadowed by Quasimodo resistance priced at 1.2092. Trend traders may also acknowledge July’s trend line resistance break, taken from the high 1.2555, on top of the break of the 1.1495 March 9 swing high.
A closer reading of price action on the daily timeframe, reveals the unit snapped a four-day bullish phase yesterday, ahead of resistance at 1.1940 and Quasimodo resistance at 1.1965. Support at 1.1594, and nearby 50.0% retracement ratio at 1.1582, reside as the next downside targets should further selling take shape.
Areas of consideration:
- A 1.18 breach on the H4 scale potentially triggers intraday bearish scenarios, targeting the 1.1730ish zone.
- October’s opening value at 1.1730 and connecting H4 areas form a support to be aware of, though do take into account no higher timeframe support exists here.
- The connection between September’s opening value 1.1937 on the H4 and daily resistance at 1.1940 arranges interesting confluence.
GBP/USD:
For those who read Monday’s technical briefing you may recall the following (italics):
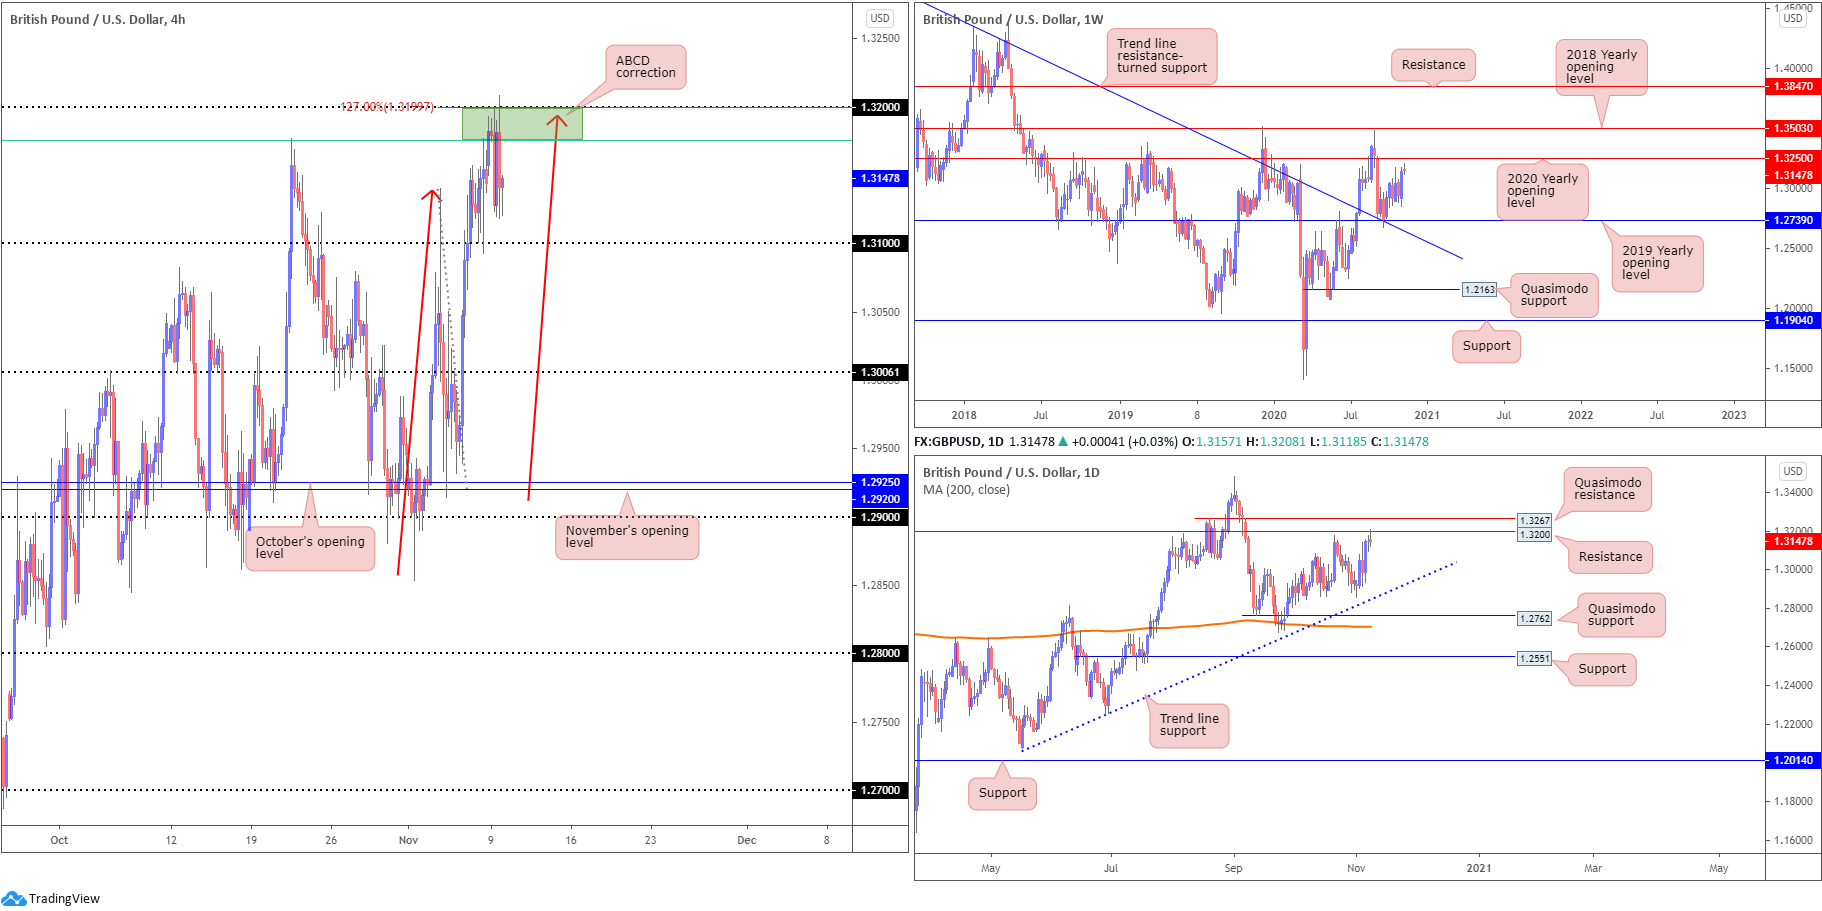
Following a retest at the 1.31 handle, Friday responded from interesting resistance between 1.32/1.3174 (green), made up of the 1.32 handle, an ABCD pullback (red arrows) at 1.3192, a 1.27 BC projection point at 1.3199 along with a 61.8% Fibonacci retracement ratio at 1.3174 (green line).
Despite a mild push to peaks at 1.3208, 1.32/1.3174 stood its ground on Monday, aided by a muscular USD advance and, of course, daily resistance also plotted at 1.3200. Should we continue to depreciate south of 1.32/1.3174, expect 1.31 to make an appearance.
From the weekly timeframe, limited change is visible. Last week formed a solid bullish engulfing candle, pointing to a possible test of the 2020 yearly opening value at 1.3250, with a break exposing the 2018 yearly opening value at 1.3503. The 2019 yearly opening value from 1.2739 is also observed to the downside, closely converging with trend line resistance-turned support, taken from the high 1.5930. It is also worth pointing out the aforementioned trend line was engulfed in July of this year, announcing an uptrend could be on the cards.
Areas of consideration:
- Weekly timeframe displays room to move higher until weekly resistance at 1.3250. Therefore, a break of 32/1.3174 on the H4 may fuel breakout buying to 1.3250.
- With daily resistance at 1.3200 representing the upper edge of the H4 resistance zone at 32/1.3174, however, short positions from here enter Tuesday in a healthy position, with 1.31 likely eyed.
AUD/USD:
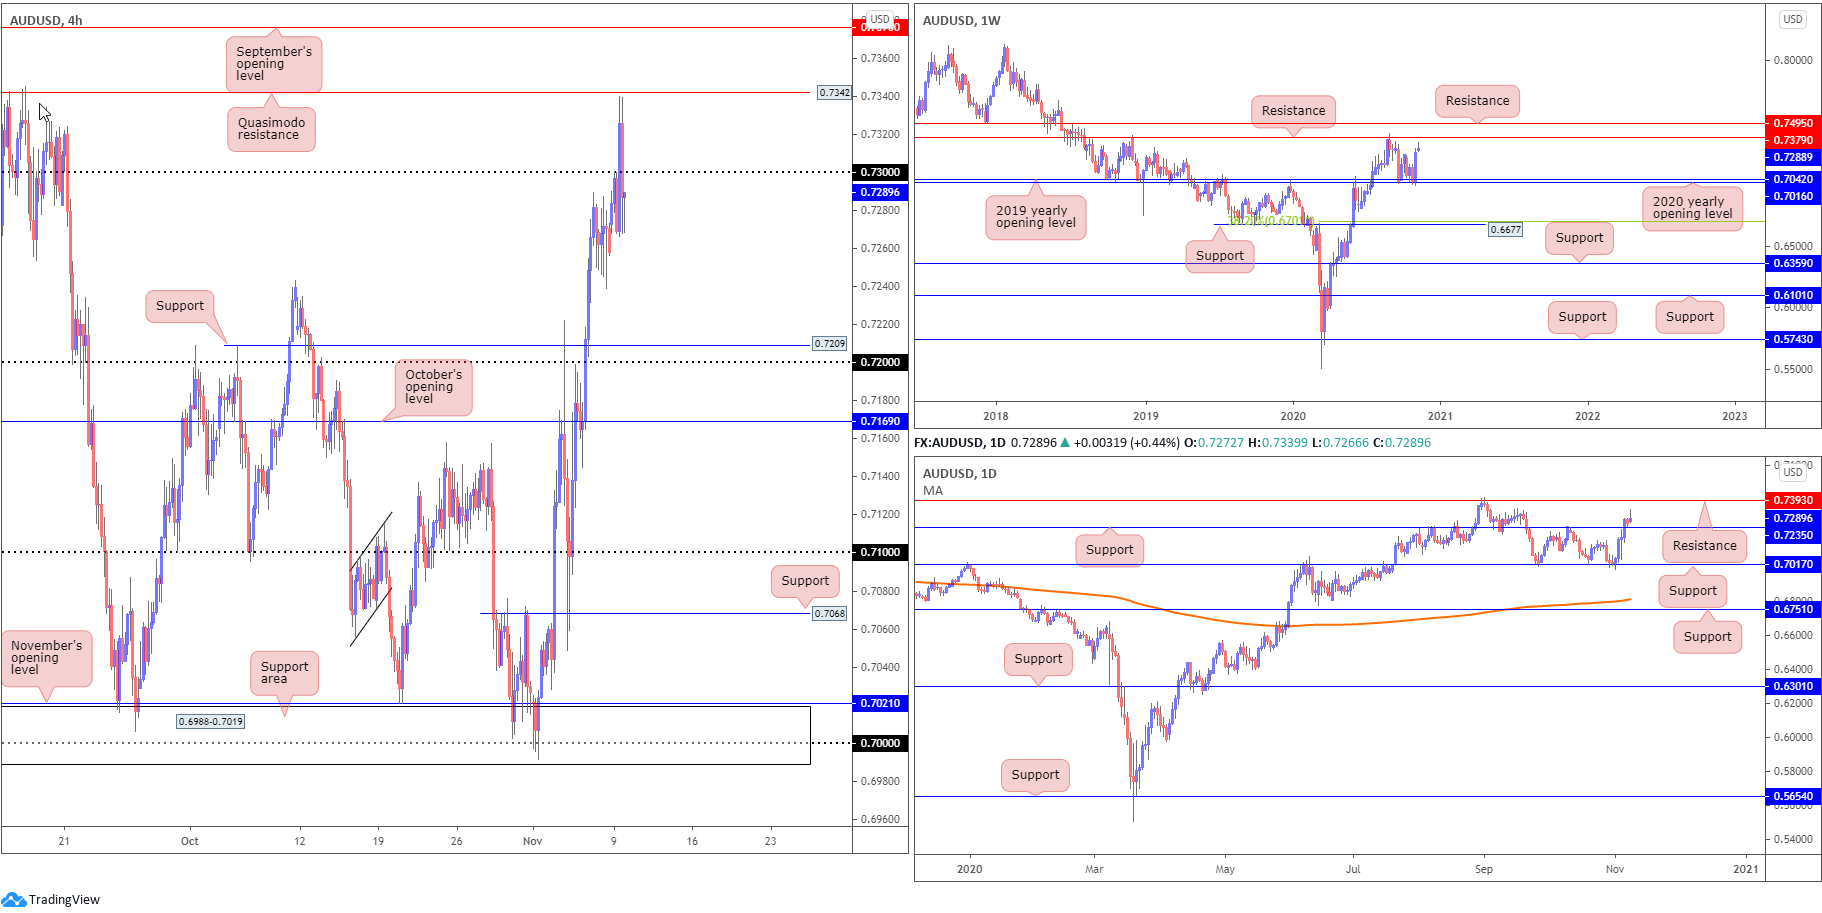
High-beta currencies gleaned fresh impetus amid moves to risk assets Monday, sparked by optimistic COVID19 vaccine news. AUD/USD upside, albeit short-lived, aggressively spiked above 0.73 to test levels just south of Quasimodo resistance at 0.7342. Chart studies indicate support at 0.7209 and the 0.72 handle could make their way into the spotlight should a bearish theme emerge sub 0.73.
From the weekly timeframe, price structure remains unchanged (italics):
Last week’s risk rally, together with the 2020 (0.7016) and 2019 (0.7042) yearly opening values (supports), underpinned the Australian dollar’s near-250-pip advance against the US dollar, consequently producing a sizeable bullish engulfing candle. The positive close, in addition to this market trending higher since early 2020, might motivate additional bullish flow this week towards resistance priced in at 0.7379.
From the daily timeframe, nevertheless, Monday formed what many candlestick analysts would label a shooting star pattern (bearish signal). This shines the spotlight back on support at 0.7235, while a revival of bids could attack resistance at 0.7393.
Areas of consideration:
- Sellers still have their work cut out for them under 0.73 on the H4, despite the daily bearish candlestick formation. Not only do both weekly and daily charts reveal room to move above 0.73 to at least 0.7379 (weekly resistance), a downside move on the H4 could be halted as soon as 0.7235 support on the daily timeframe.
- A retreat to 0.72, however, could trigger dip-buyers, while a decisive H4 close above 0.73 may tempt breakout buying moves, targeting Quasimodo resistance at 0.7342, followed by September’s opening value at 0.7376 (and weekly resistance at 0.7379).
USD/JPY:
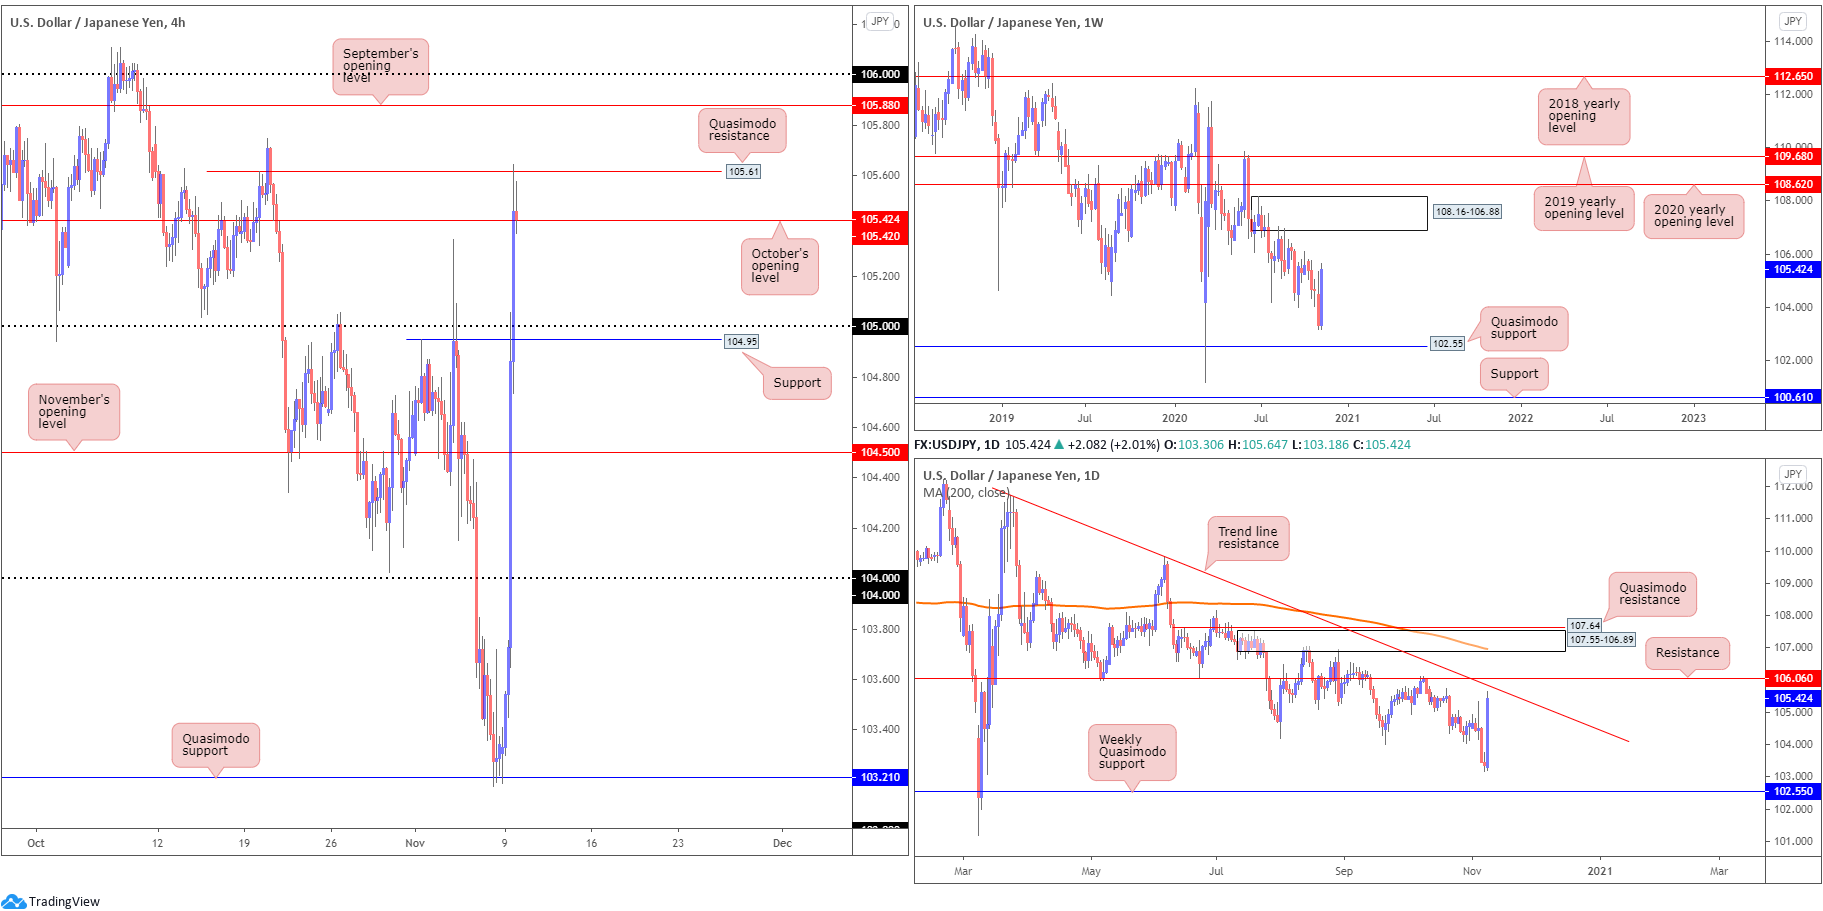
The US dollar surged by more than 2% against the Japanese yen Monday, reinforced by healthy risk appetite and broad USD strength. As we write, H4 tests Quasimodo resistance at 105.61, with sellers also attempting to find some grip below October’s opening value at 105.42. Should sellers succeed, the 105 handle calls for attention, closely shadowed by support at 104.95 (previous Quasimodo resistance).
Longer-term action on the weekly timeframe has supply at 108.16-106.88 on its radar to the upside, with Quasimodo support priced in at 102.55 to the south of price. Price action on the daily timeframe, on the other hand, faces neighbouring trend line resistance, extended from the high 111.71, followed by resistance at 106.06.
Areas of consideration:
- H4 Quasimodo resistance at 105.61 and October’s opening value at 105.42 is an area sellers may be watching, though do be aware there is limited higher timeframe convergence present, according to our chart studies. Should sellers make a move, however, 105 is a support to be mindful of.
- The 106 handle and September’s opening value at 105.88, on the other hand, merges nicely with daily trend line resistance and resistance from 106.06.
USD/CAD:
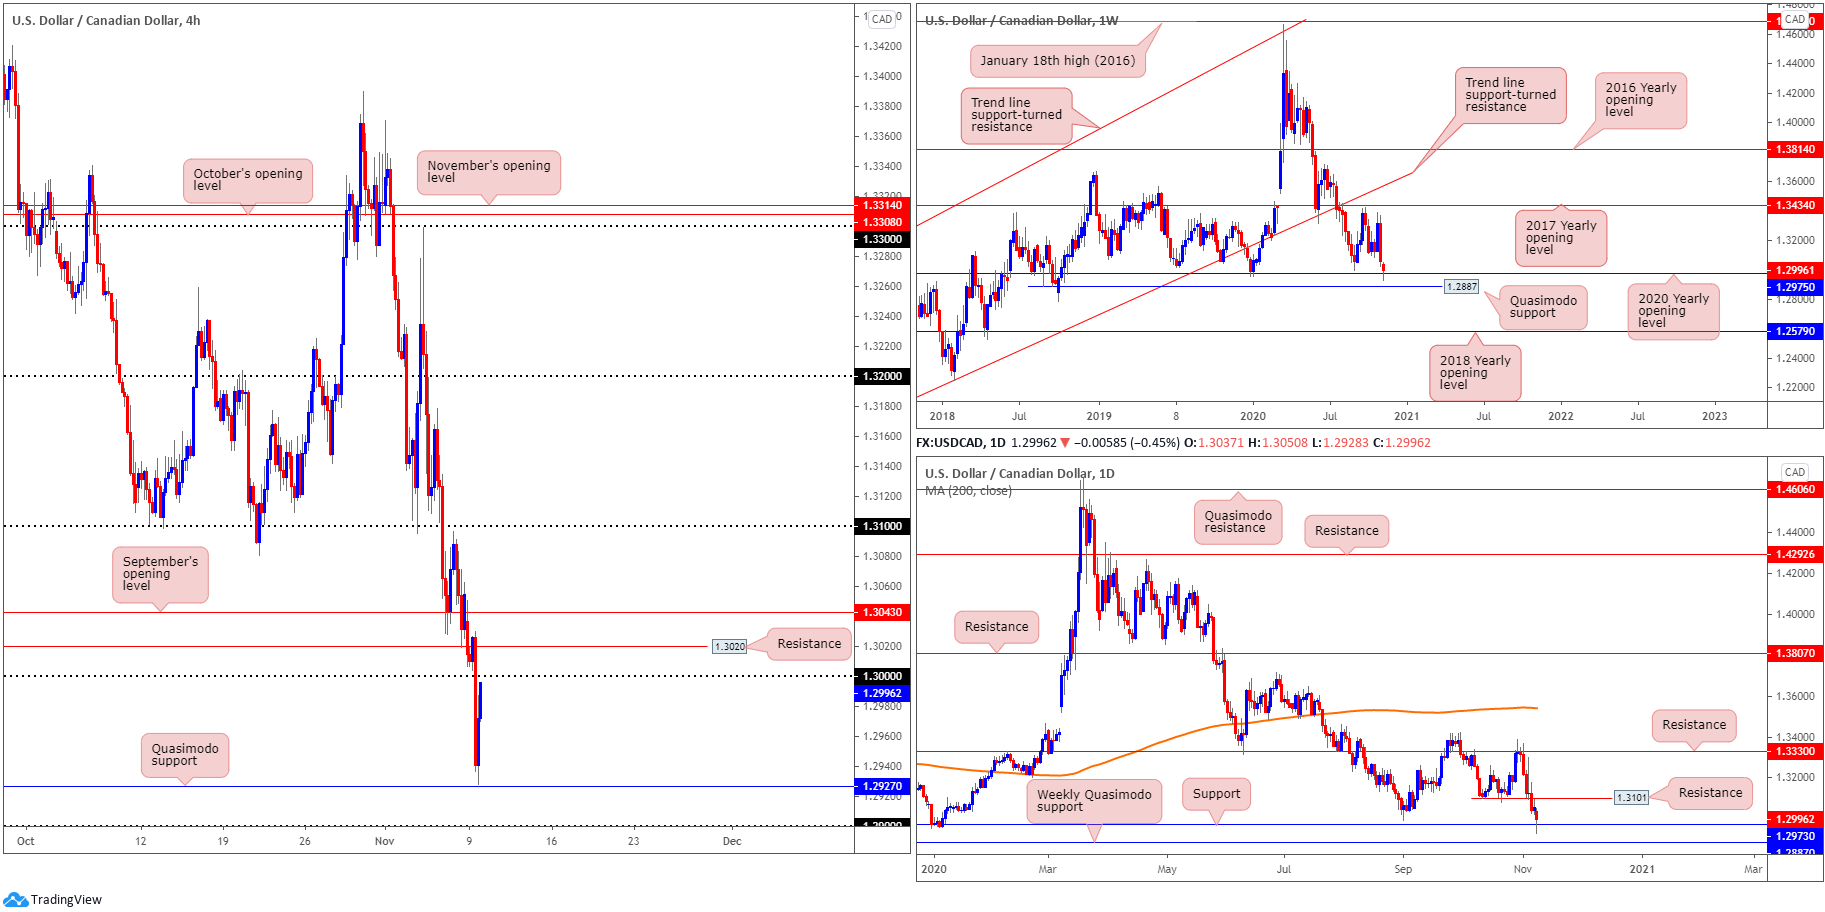
From the weekly timeframe this morning, price crossed swords with the 2020 yearly opening value at 1.2975, a level shadowed by a Quasimodo support priced in at 1.2887. A decisive rejection from the latter could eventually see the 2017 yearly opening value at 1.3434 enter the fray. However, given this market has traded lower since topping at 1.4667 in early 2020, breaking the aforementioned supports swings the pendulum in favour of further weakness towards the 2018 yearly opening value at 1.2579.
The daily timeframe has price action communicating with support at 1.2973, also secured just north of weekly Quasimodo support at 1.2887. Resistance can be found at 1.3101 on the daily scale, a previous Quasimodo support level.
Across the page on the H4 timeframe, after missing Quasimodo support by a hair at 1.2927 (ahead of the 1.29 handle), USD/CAD bulls staged an impressive recovery, with candles fast approaching the key figure 1.30. Traders may also want to acknowledge the resistance level sited just above at 1.3020 (a previous Quasimodo support).
Areas of consideration:
- From an intraday/swing trading perspective, a bearish response from H4 resistance at 1.3020 and the 1.30 handle is a possibility in the opening stages of Tuesday’s session.
- Against the backdrop of an intraday position, however, the weekly and daily timeframes are both engaging with support at 1.2975 and 1.2973, respectively (essentially marking the same area). For that reason, selling from 1.3020/1.30 could be short-lived.
- Following on from the higher timeframes, a breakout above September’s opening value at 1.3043 on the H4 could be something that interests buyers today, targeting 1.31.
USD/CHF:
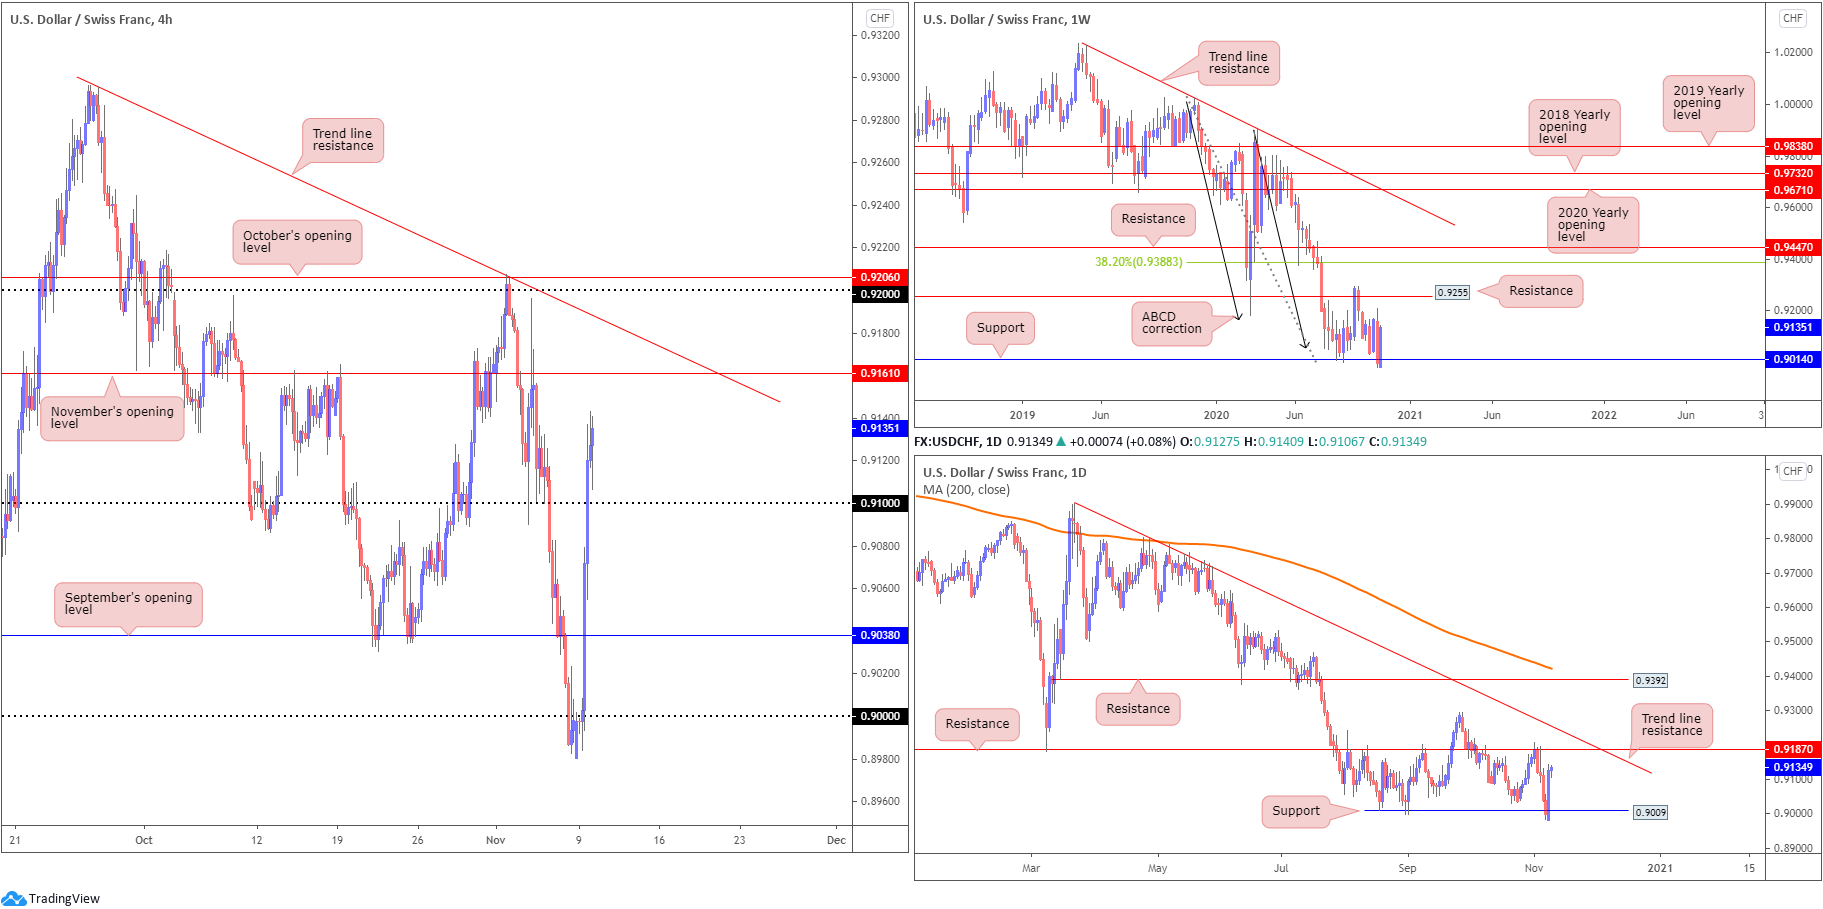
Up by nearly 1.5%, Monday witnessed healthy USD demand, lifting USD/CHF north of the 0.91 handle to within striking distance of November’s opening value at 0.9161 on the H4 scale. Further buying underlines trend line resistance, extended from the high 0.9295, with a break exposing the 0.92 handle and October’s opening value at 0.9206.
Further out on the weekly timeframe, traders will acknowledge we’re heavily bid off support at 0.9014, a level dovetailing closely with ABCD support at 0.9051 (black arrows). 0.9255 resistance (a prior Quasimodo support) is next in the firing range should buyers continue to support this market.
Quasimodo support on the daily timeframe at 0.9009, despite a noticeable breach, welcomed buyers on Monday, locating price within touching distance of resistance at 0.9187. Beyond here, traders will likely recognise nearby trend line resistance, taken from the high 0.9901.
Areas of consideration:
- Support derived from both the weekly and daily timeframes unlocks a possible test at November’s opening value from 0.9161 on the H4. A 0.91 retest, therefore, may be a welcomed sight for dip-buyers.
- Buyers in this market are likely to target 0.9206/0.9187 (October’s opening value/daily resistance); sellers may also welcome this zone should it make an entrance.
Dow Jones Industrial Average:
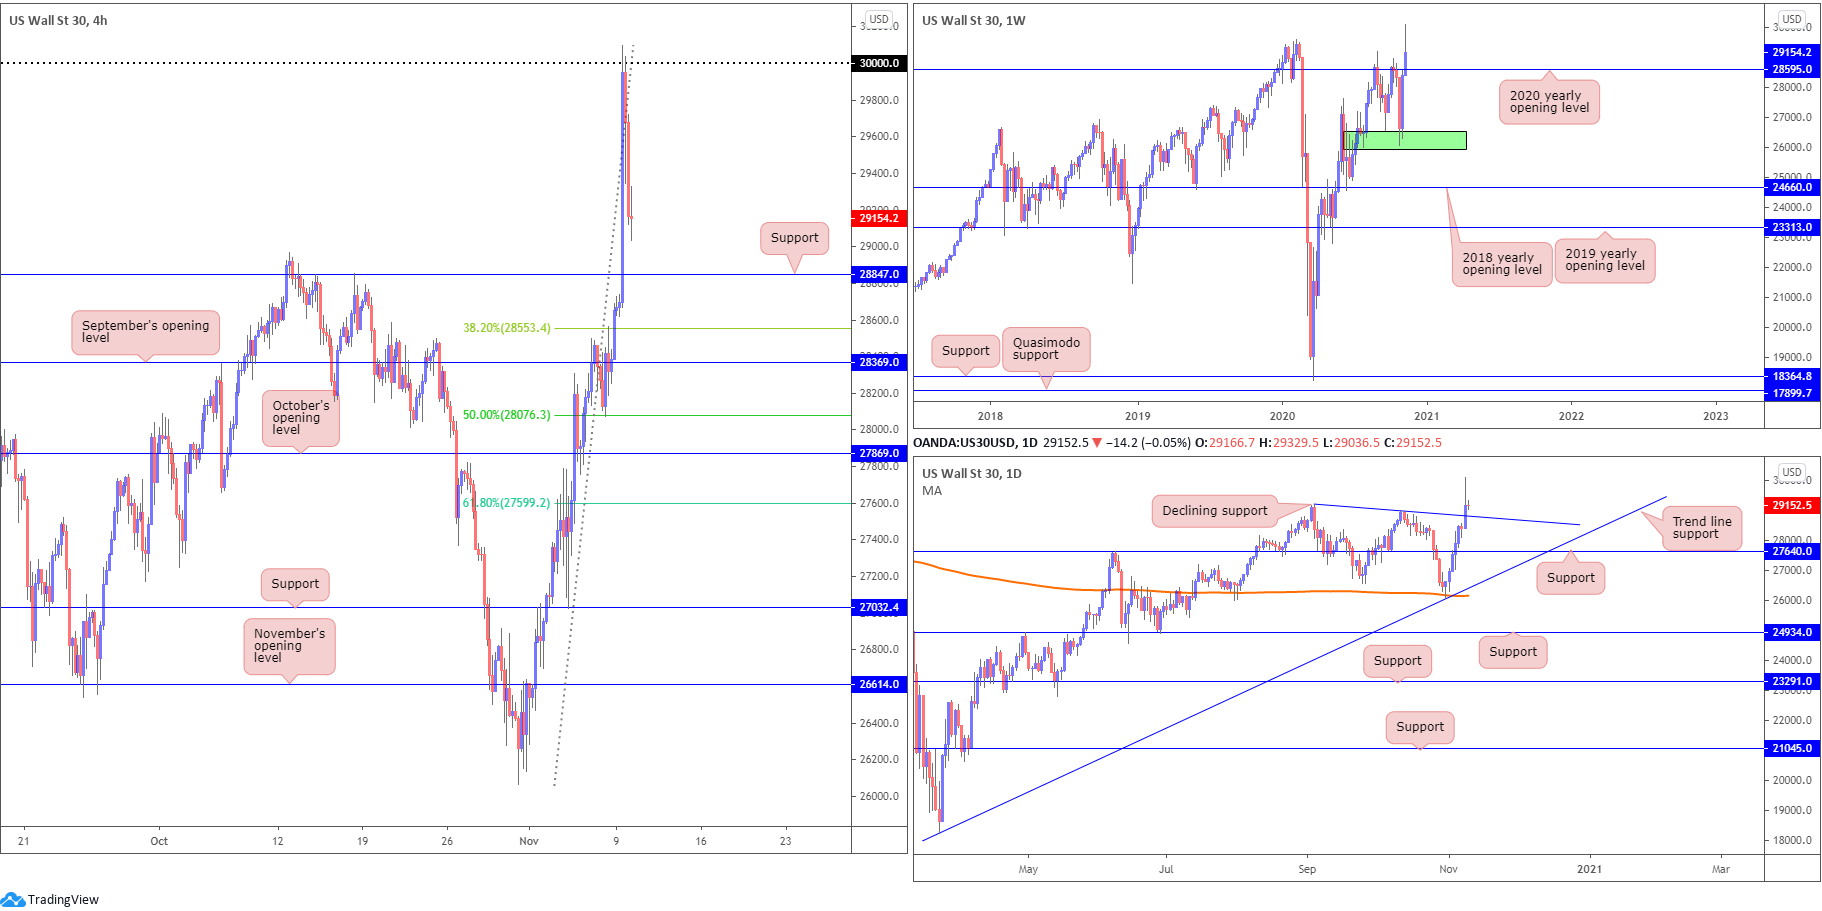
The Dow flirted with records on Monday amidst vaccine hopes. The Dow Jones Industrial Average added 834.57 points, or 2.95%, the S&P 500 traded higher by 41.06 points, or 1.17%, while the Nasdaq ended lower by 181.45 points, or 1.53%.
From the weekly timeframe, price hovers north of the 2020 yearly opening value at 28595, fading fresh all-time peaks at 30097. This follows last week’s 6.7% advance from demand at 25916-26523 (green). Price action on the daily timeframe has declining support in view, taken from the high 29193. Should a break of here come to pass, support at 27640 is seen.
Across the page on the H4 chart, price is seen closing in on support at 28847 after fading 30000. Beyond 28847, the 38.2% Fibonacci retracement ratio is seen at 28553, followed by September’s opening value at 28369.
Areas of consideration:
- Forming fresh all-time highs yesterday will likely excite buyers. As a result, dip-buying opportunities could form from H4 support at 28847 today. Failure to hold, buyers’ crosshairs may switch to the 38.2% H4 Fibonacci retracement ratio is seen at 28553 and September’s opening value at 28369.
XAU/USD (GOLD):
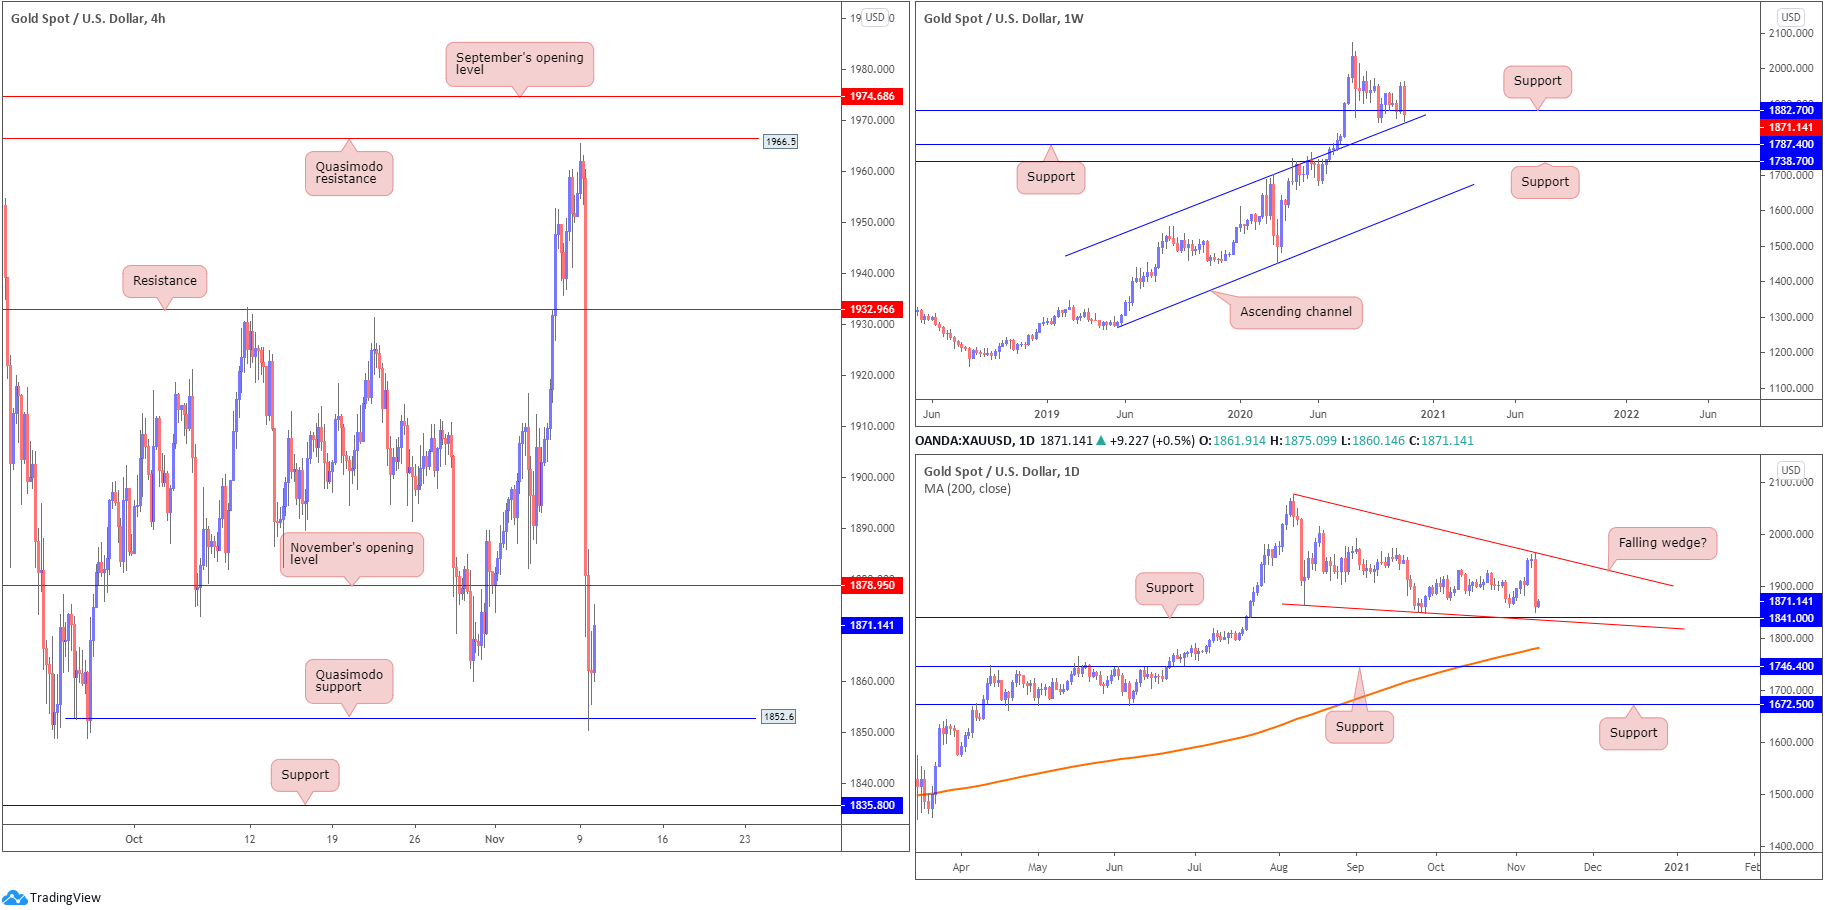
In dollar terms, spot gold shed more than 4.5% on Monday amid COVID-19 vaccine euphoria. Plunging through a number of key technical supports on the H4, the session finished marginally off session lows, aided by Quasimodo support at $1,852. This, as you can see, could lead to November’s opening value offering resistance today at $1,878, while continuation selling shines the spotlight on support coming in at $1,835.
Higher up on the curve, weekly price dipped a toe under support at $1,882, consequently nearing channel resistance-turned support, taken from the high $1,703. What’s interesting from a technical perspective is daily support drawn from $1,841 converges with the weekly channel support. Another feature worth highlighting on the daily chart is a possible falling wedge pattern between $2,075/$1,862.
Areas of consideration:
- While the possibility of an extended recovery from H4 Quasimodo support at $1,852 is there, most traders may wait and see if we print a H4 close above November’s opening value at $1,878 before taking action.
- Should H4 support at $1,835 nudge its way into the limelight, the pendulum swings in favour of buyers here in terms of technical confluence: daily support at $1,841 and weekly channel support.
The accuracy, completeness and timeliness of the information contained on this site cannot be guaranteed. IC Markets does not warranty, guarantee or make any representations, or assume any liability regarding financial results based on the use of the information in the site.
News, views, opinions, recommendations and other information obtained from sources outside of www.icmarkets.com.au, used in this site are believed to be reliable, but we cannot guarantee their accuracy or completeness. All such information is subject to change at any time without notice. IC Markets assumes no responsibility for the content of any linked site.
The fact that such links may exist does not indicate approval or endorsement of any material contained on any linked site. IC Markets is not liable for any harm caused by the transmission, through accessing the services or information on this site, of a computer virus, or other computer code or programming device that might be used to access, delete, damage, disable, disrupt or otherwise impede in any manner, the operation of the site or of any user’s software, hardware, data or property


