
Key risk events today:
Limited.
(Previous analysis as well as outside sources – italics).
EUR/USD:
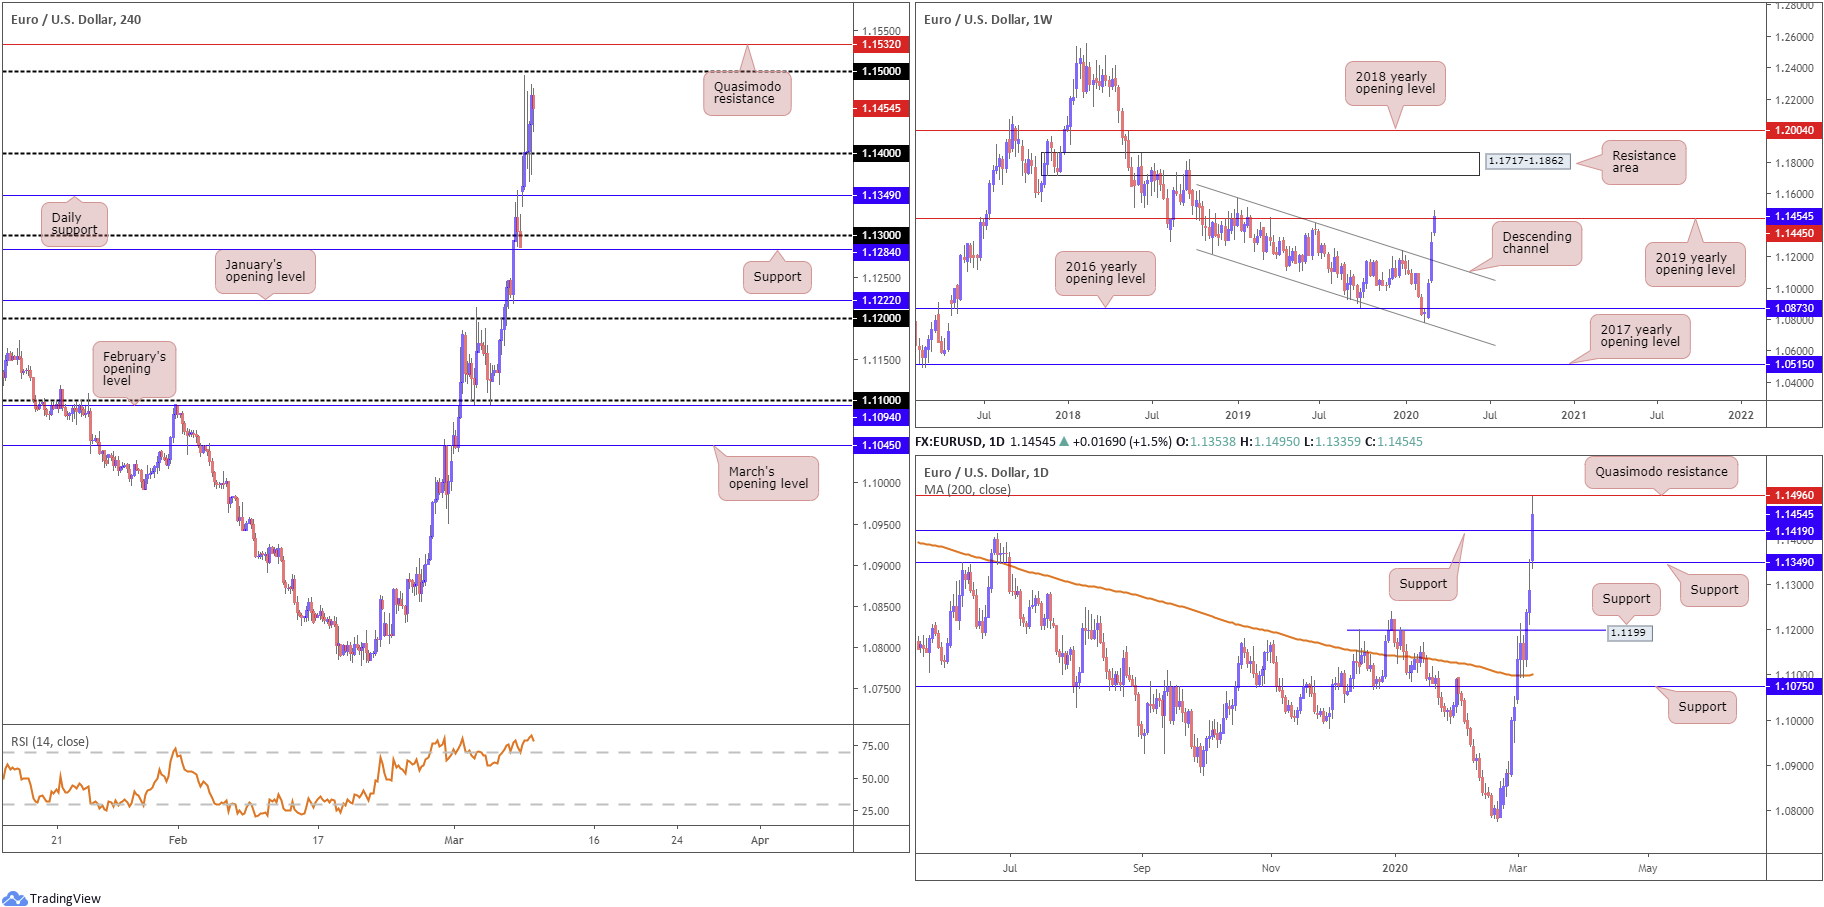
Europe’s single currency firmed Monday, benefitting from continued decline in US Treasuries and the dollar’s demise. the DXY cracked 95.00, levels not seen since October 2018. 1.14 was taken to the upside in early trade, with the latter pencilling in support for the remainder of the day. 1.15 now lies in wait on the H4 timeframe, offering possible resistance, followed closely by a Quasimodo formation at 1.1532, extended from early January. The relative strength index (RSI) is seen trading within overbought territory off peaks at 85.00.
The story on the bigger picture has the pair tackling the 2019 yearly opening level from 1.1445 on the weekly timeframe – a noted port of resistance, boasting incredibly strong history. This followed last week’s action slicing through long-term weekly channel resistance, extended from the high 1.1569. With respect to the primary trend, the breakout above the mentioned channel resistance may see the beginning of a long-term trend change take place.
Daily flow jumped through two notable Quasimodo resistances at 1.1349 and 1.1419 yesterday, leading to a test of Quasimodo resistance at 1.1496, which is seen capping upside for the time being. A continued dip will likely explore the possibility of forming support off 1.1419, with a break likely headed for 1.1349.
Areas of consideration:
Longer-term flow has weekly price flirting with the 2019 yearly opening level at 1.1445, indicating a pullback could be in store. A similar picture is seen on the daily timeframe off Quasimodo resistance at 1.1496, though support is likely to develop off 1.1419.
In light of the higher-timeframe’s perspective, the combination of Quasimodo resistance on the H4 at 1.1532 and the round number 1.15 could be an area of interest today, offering a base to fade buying, targeting 1.14ish. Conservative traders may opt to wait for additional confirmation before pulling the trigger; however, this is trader dependent.
GBP/USD:
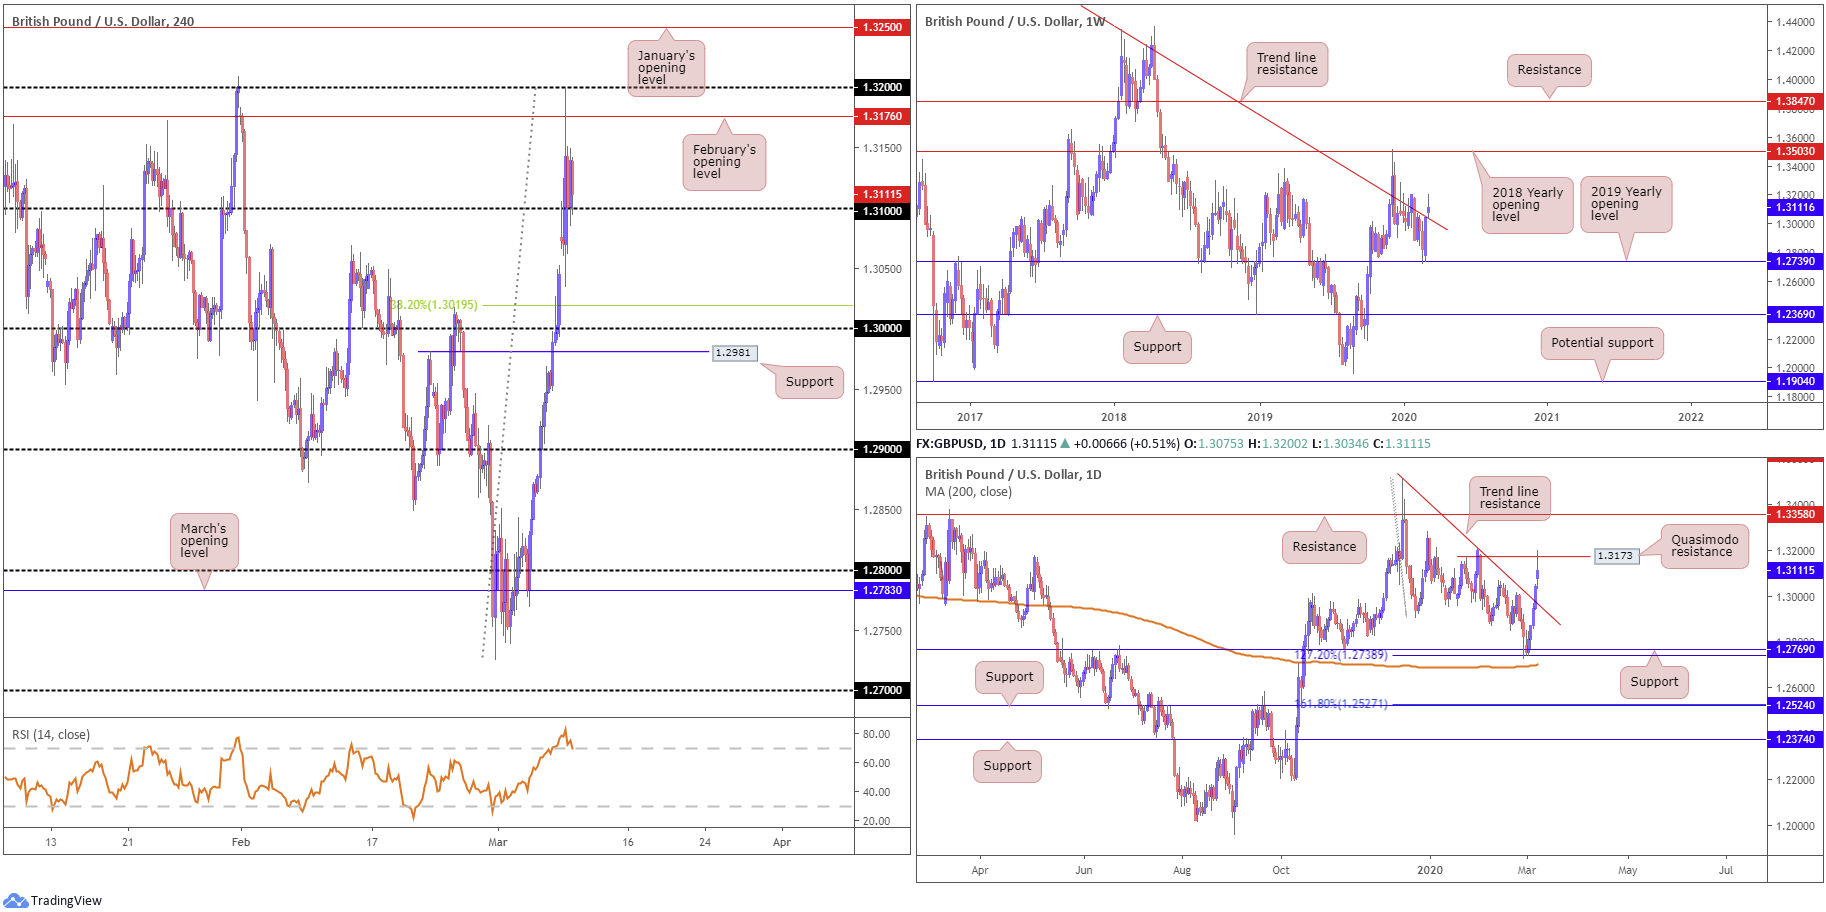
In absence of Brexit-related headlines, sterling’s strength Monday was funded by prevailing USD weakness. GBP/USD gained traction amid the early part of Monday’s hours, welcoming a to-the-point rejection off 1.32 which was likely supported by additional technical presence off February’s opening level at 1.3176, based on the H4. With the relative strength index (RSI) fading 85.00, the candles settled around 1.31. A breakdown south today could lead to a test at 1.3070ish (three-week tops), closely followed by the 38.2% Fibonacci retracement ratio at 1.3020 and the widely watched key figure 1.30.
Interestingly, weekly price nudged above long-standing trend line resistance, pencilled in from the high 1.5930. The breach may ignite buy-stop liquidity, pushing for moves towards the 2018 yearly opening level at 1.3503.
Activity on the daily timeframe penetrated trend line resistance, extended from the high 1.3514, on Friday, closing a touch off its highs. Follow-through buying Monday saw Quasimodo resistance enter the fold at 1.3173, a level that’s holding ground.
Areas of consideration:
The break of the current weekly trend line resistance is significant, yet it is not the first time we’ve been in these waters and retreated to bearish ground. Therefore, traders may be taking this with a pinch of salt.
With daily price fading Quasimodo resistance at 1.3173, a move through 1.31 may be seen today, triggering sell-stop liquidity and arousing sellers. As stated above, downside targets south of 1.31 are seen at 1.3070, 1.3020 and 1.30.
AUD/USD:
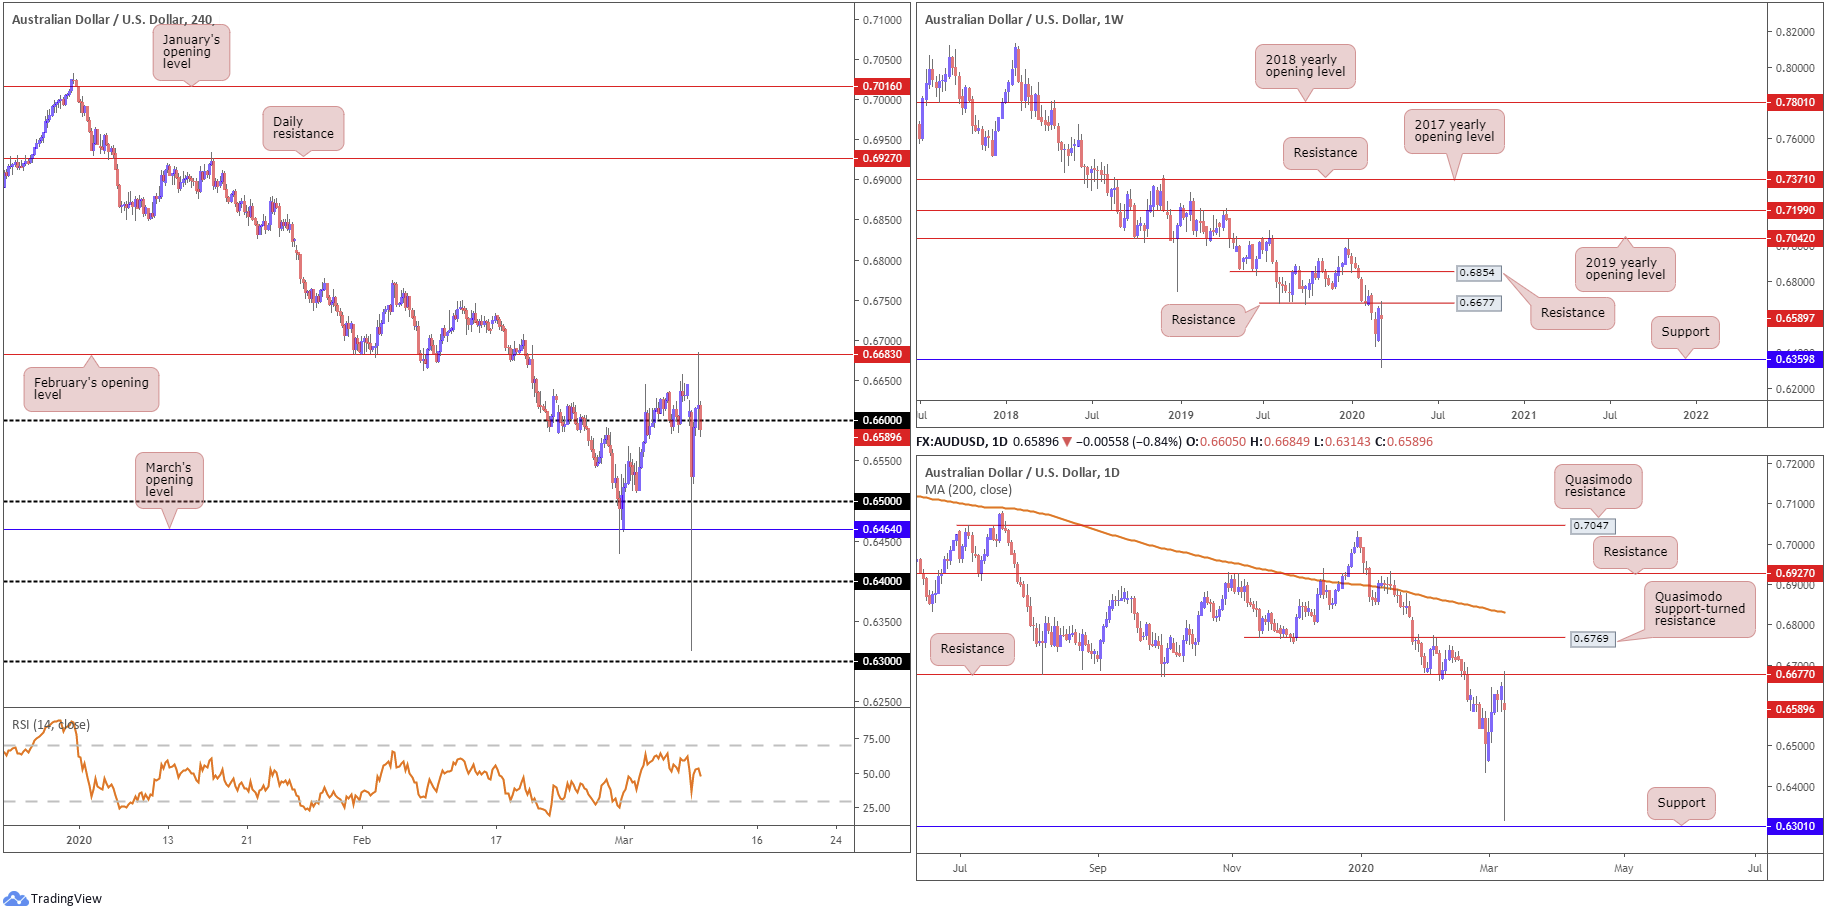
AUD/USD regained poise after a hefty decline in early trade Monday, what some analysts are labelling a ‘flash crash’. The move came within touching distance of 0.63 before rotating to the upside and testing February’s opening level at 0.6683, a daily range of more than 350 points. As of current price, traders seek ground beneath 0.66, with eyes likely fixed on 0.65.
On a wider perspective, weekly action stabbed support at 0.6359 and retested resistance at 0.6677, which is also visible resistance on the daily scale. Support on the daily timeframe, nonetheless, is seen around 0.6301.
Areas of consideration:
The blend of February’s opening level at 0.6683 and weekly resistance at 0.6677 was a noted area in Monday’s technical briefing. With the H4 candles searching lower levels south of 0.66, traders short 0.6683/0.6677 are likely looking to reduce risk to breakeven, with the expectation of further gains to 0.65.
USD/JPY:
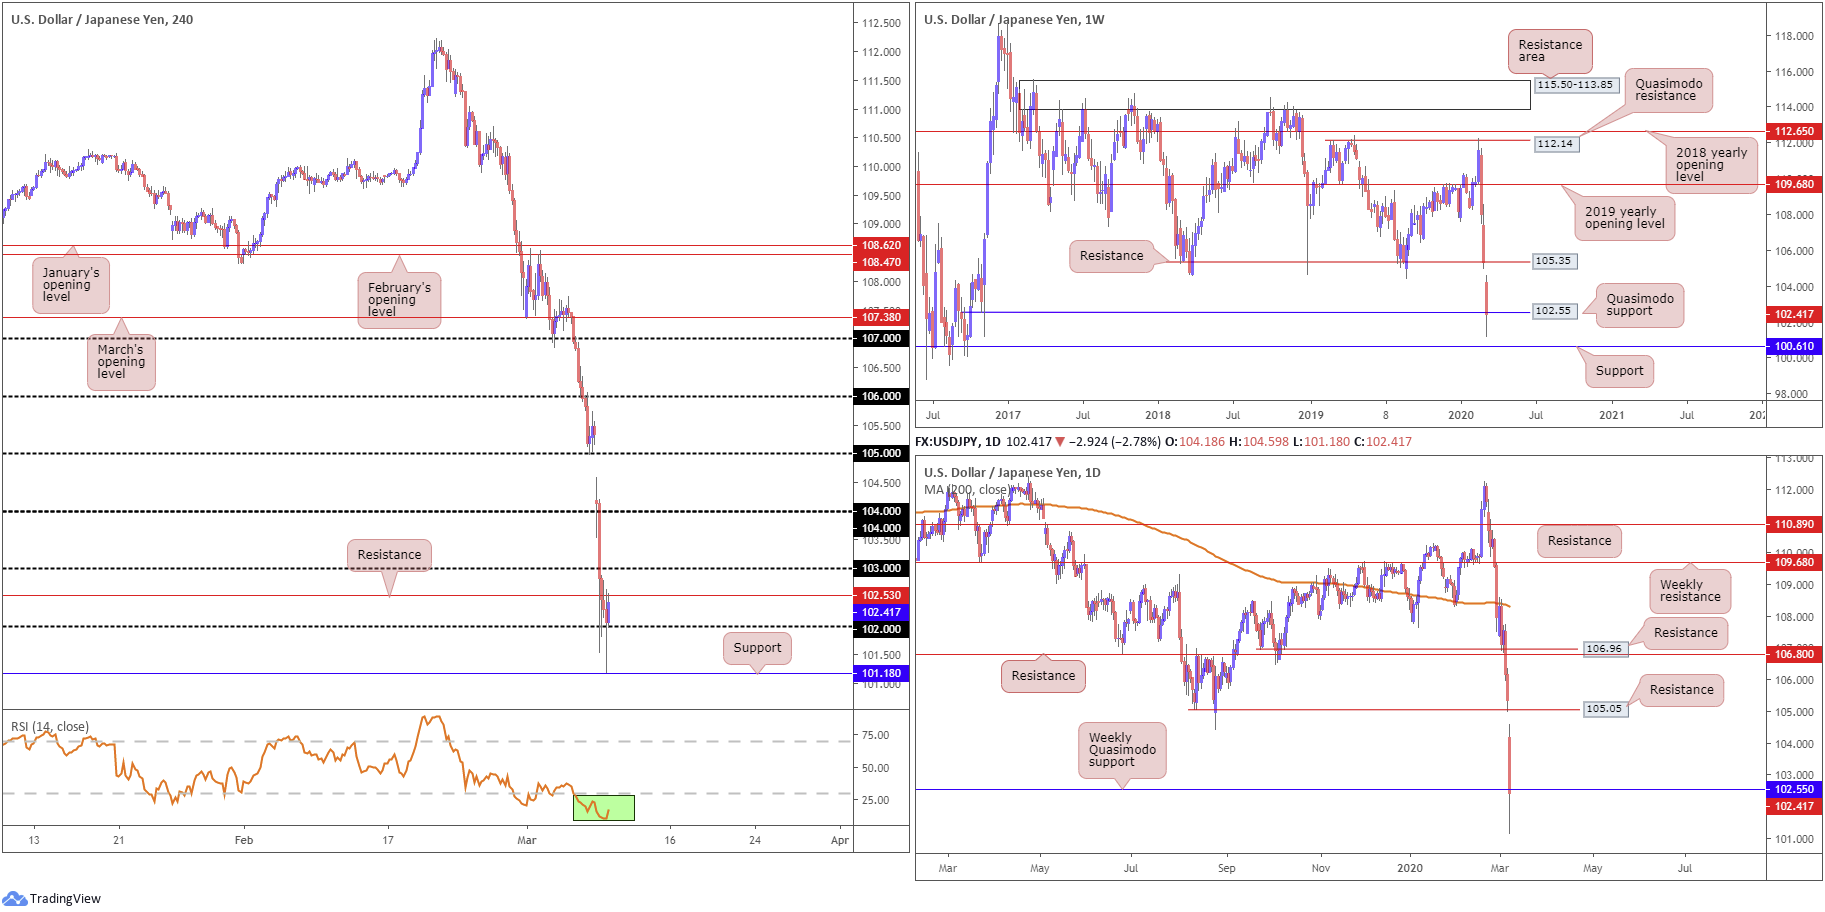
Sellers strengthened their grip Monday, plummeting to lows of 101.18, levels not seen since November 2016. Risk-off flows continued to dominate amid heightened concerns over the coronavirus outbreak and its impact on the global economy, consequently increasing demand for safe-haven assets, such as the Japanese yen. H4 price ran through a number of big figures, though currently holds 102, bolstered by earlier support around 101.18. Resistance at 102.53, a previous Quasimodo support level, currently caps upside, with the relative strength index (RSI) seen dipping its toes deep in oversold terrain (green).
Further afield, weekly movement is grasping Quasimodo support at 102.55, positioned north of support at 100.61. To the upside resistance now stands at 105.35, a previous Quasimodo support. A similar picture is visible on the daily timeframe, rebounding from weekly Quasimodo support at 102.55, yet resistance on this scale falls in around 105.05, another previous Quasimodo support.
Areas of consideration:
In order to confirm a recovery off weekly support, traders likely have their crosshairs fixed on a H4 close north of 103. This possibly frees the runway north at least until we reach 104, with a break drawing in 105 and then daily resistance 105.05.
A H4 close above 103 will likely be sufficient for some traders to enter long; others may require a retest at 103 to occur before pulling the trigger.
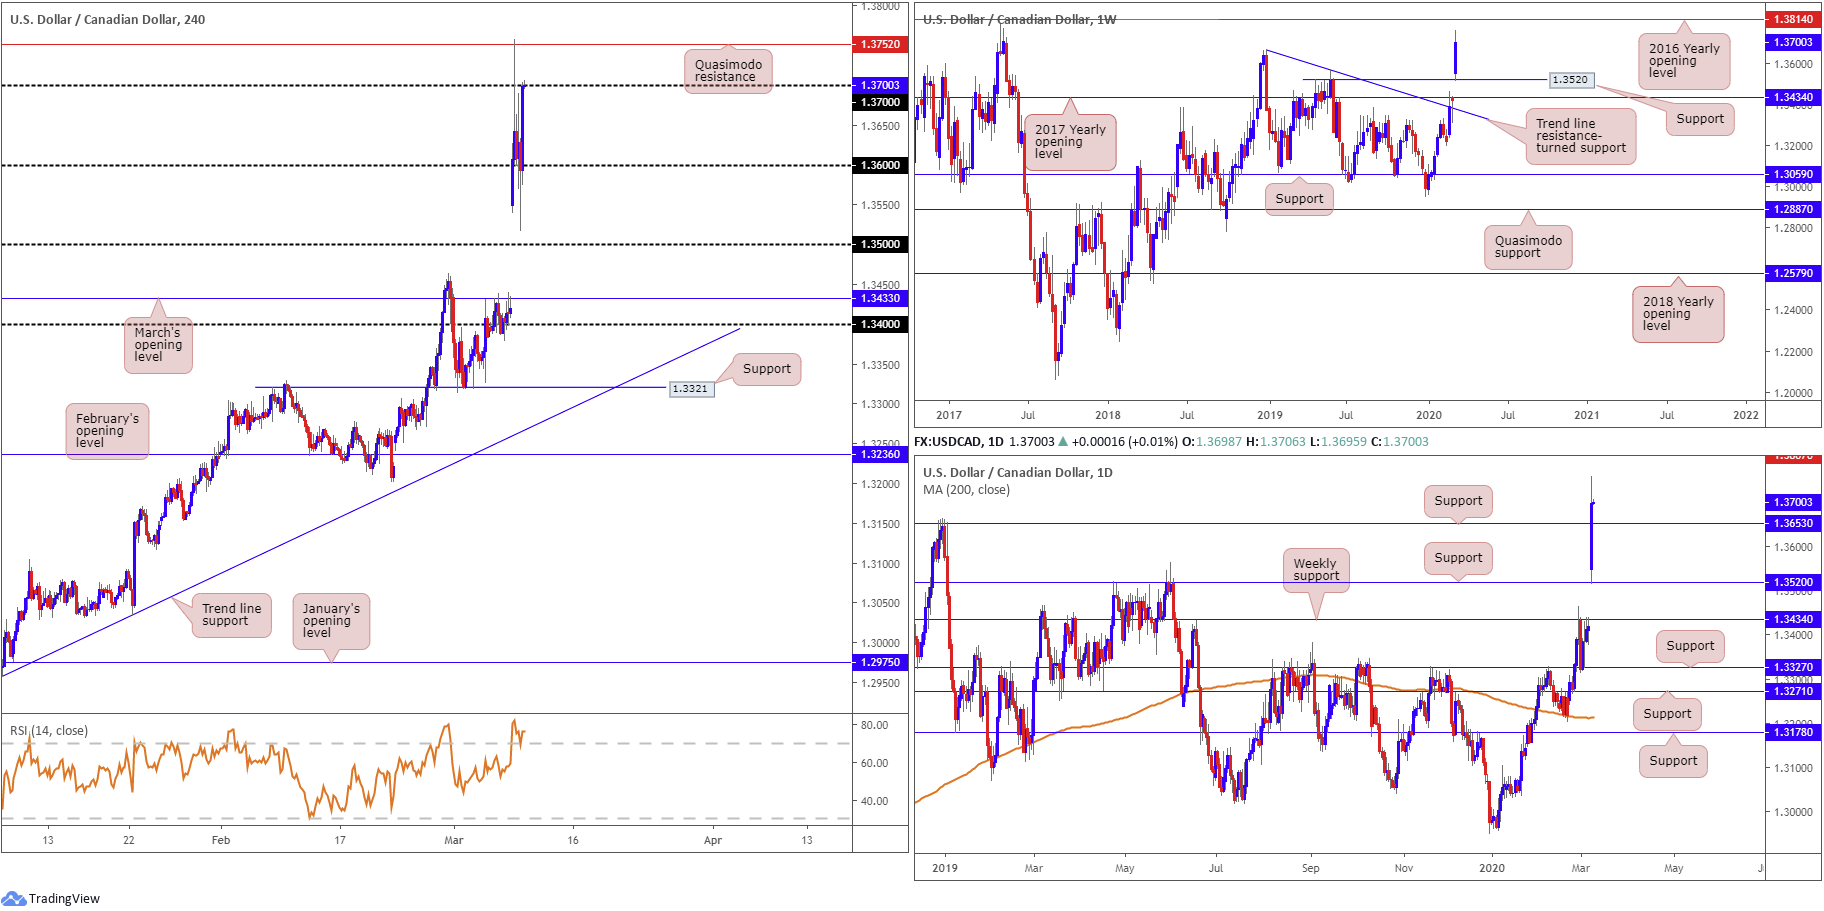
USD/CAD:
Energy markets exhibited their largest price declines since the Iraq Gulf war amid the OPEC breakdown on Monday. After failing to reach an agreement on oil production cuts with Russia on Friday, Saudi Arabia will be boosting its output to above 10mln BPD from this month’s 9.7mln BPD.
USD/CAD surged more than 120 points to kick off the week, gapping sharply north of 1.35 and testing multi-year highs at 1.3758, essentially shaking hands with H4 Quasimodo resistance at 1.3752. As of writing, following a failed attempt to dethrone 1.36 to the downside, 1.37 re-entered view. Indicator-based traders may also wish to note the relative strength index (RSI) currently tests overbought territory.
Higher-timeframe movement has weekly price eyeing the 2016 yearly opening level at 1.3814 after thrashing Quasimodo resistance at 1.3520, now a serving support. Daily price, after jumping through resistance at 1.3653, eyes resistance standing at 1.3807.
Areas of consideration:
Room seen to climb higher on the bigger picture places a question mark on 1.37 as possible resistance today. The same can be said for H4 Quasimodo resistance at 1.3752, despite holding in the early hours of yesterday’s trade. Buy-stop liquidity above 1.37 likely helped attract sellers Monday, though with this now likely limited, further buying through the said H4 levels is conceivable. Therefore, longs above 1.3752, targeting the 1.38 handle, closely followed by daily resistance at 1.3807 and then weekly resistance at 1.3814, is an option.
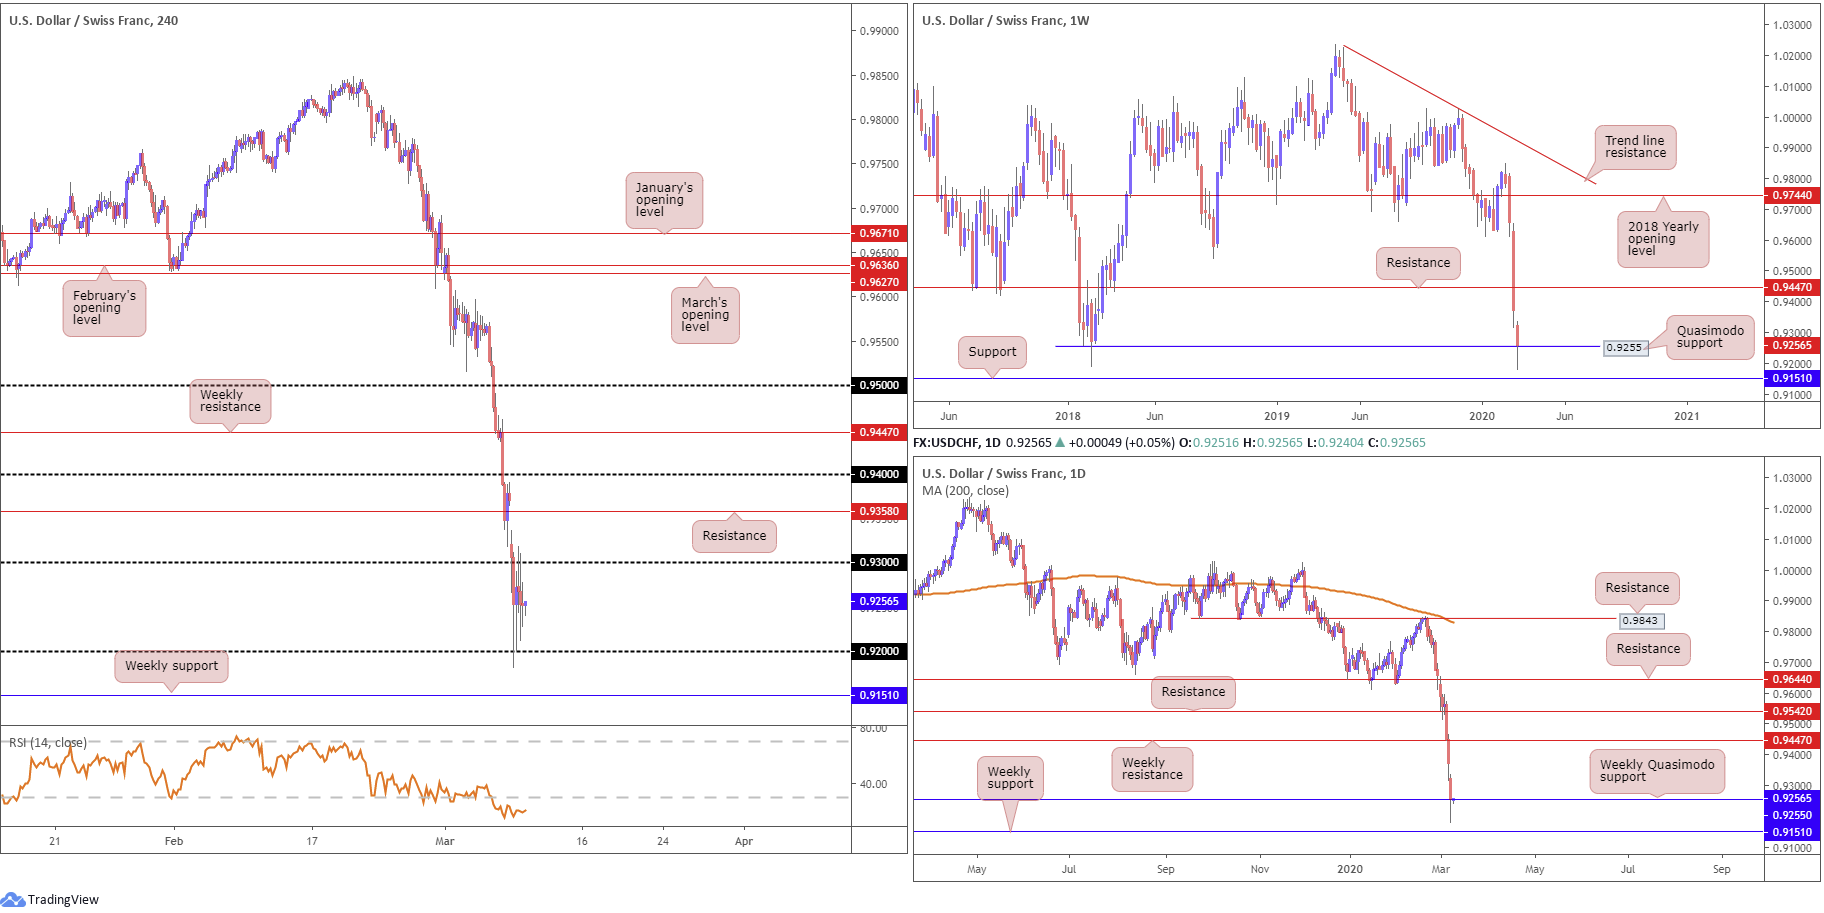
USD/CHF:
The safe-haven Swiss franc found demand amid the coronavirus-led global flight to safety on Monday. This, alongside yield on the 10-year US Treasury note dropping to all-time lows of 0.36% and the US dollar index exploring ground south of 95.00, led USD/CHF to lows at 0.9182.
The weekly timeframe reveals price action nervously trading around Quasimodo support at 0.9255, with a break of this formation shining the spotlight on support coming in at 0.9151. A recovery on this timeframe could extend as far north as resistance from 0.9447.
0.92 is holding on the H4 timeframe as is 0.93 as resistance, with the candles beginning to shape what appears to be a consolidation. A decisive break of 0.92 will draw in buyers from weekly support at 0.9151, whereas a break north of 0.93 has resistance plotted at 0.9358.
Areas of consideration:
A whipsaw through 0.92, tripping sell-stop liquidity, to weekly support at 0.9151, followed by a H4 close back above 0.92 will likely be viewed as a buy signal. Entry on the close of the breakout candle is an option, targeting 0.93 as an initial take-profit target.
A similar scenario, in which H4 action breaks 0.93 to the upside, might take shape, targeting 0.9358. followed by 0.94.
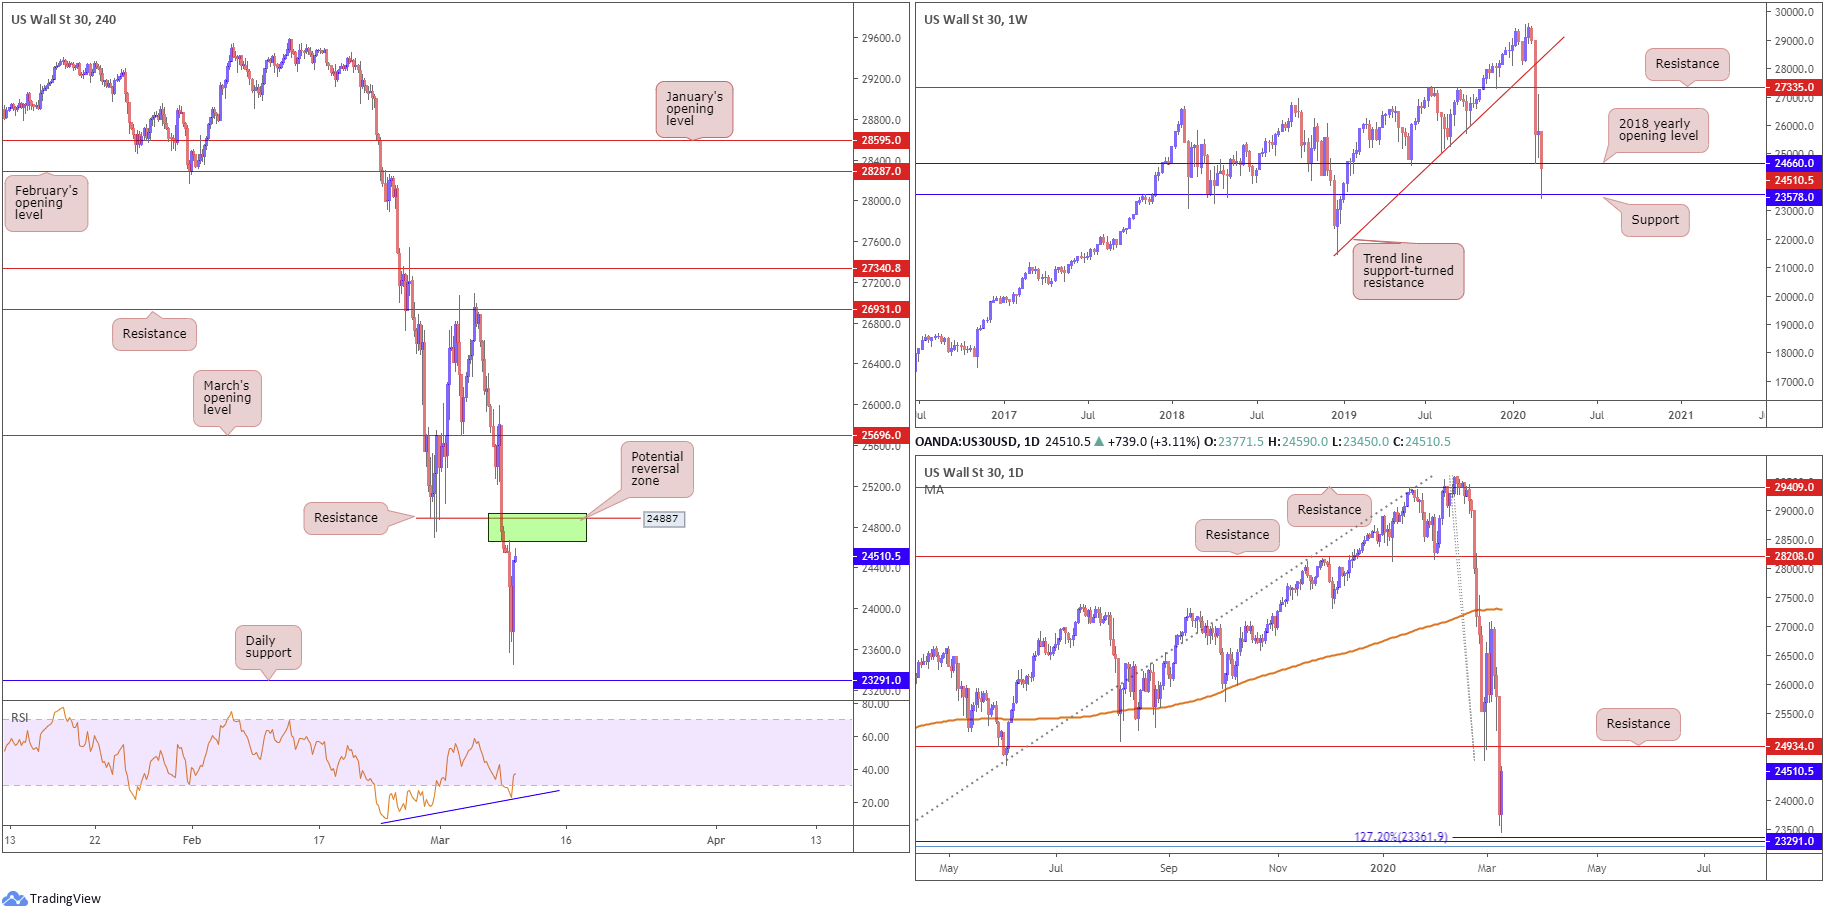
Dow Jones Industrial Average:
Major US benchmarks plunged Monday, wavering close to the first bear market in more than a decade as a price war for oil and fallout from the coronavirus concerns investors. The Dow Jones Industrial Average lost 2013.76 points, or 7.79%; the S&P 500 also declined 225.81 points, or 7.60% and the tech-heavy Nasdaq 100 ended lower by 582.31 points, or 6.83%.
Technical developments has weekly price fading support at 23578, after slicing through the 2018 yearly opening level at 24660. Daily price, on the other hand, bottomed just north of support coming in at 23291, which boasts a 127.7% Fib ext. point at 23361 and a 78.6% Fib retracement at 23205. Resistance falls in close by at 24934.
Across the page on the H4 timeframe, daily support mentioned above at 23291 represents a key fixture on this scale, though resistance can be seen around 24887, a previous Quasimodo support level. Also of note is the relative strength index (RSI) seen producing bullish divergence out of oversold territory.
Areas of consideration:
24887 is likely watched resistance on the H4 timeframe this morning, due to its convergence with daily resistance at 24934. What’s also notable is the 2018 yearly opening level at 24660 could serve as resistance.
Conservative traders interested in shorts between 24934/24660 (green H4 zone) will likely seek at least additional candle confirmation before pulling the trigger, due to recent volatility.
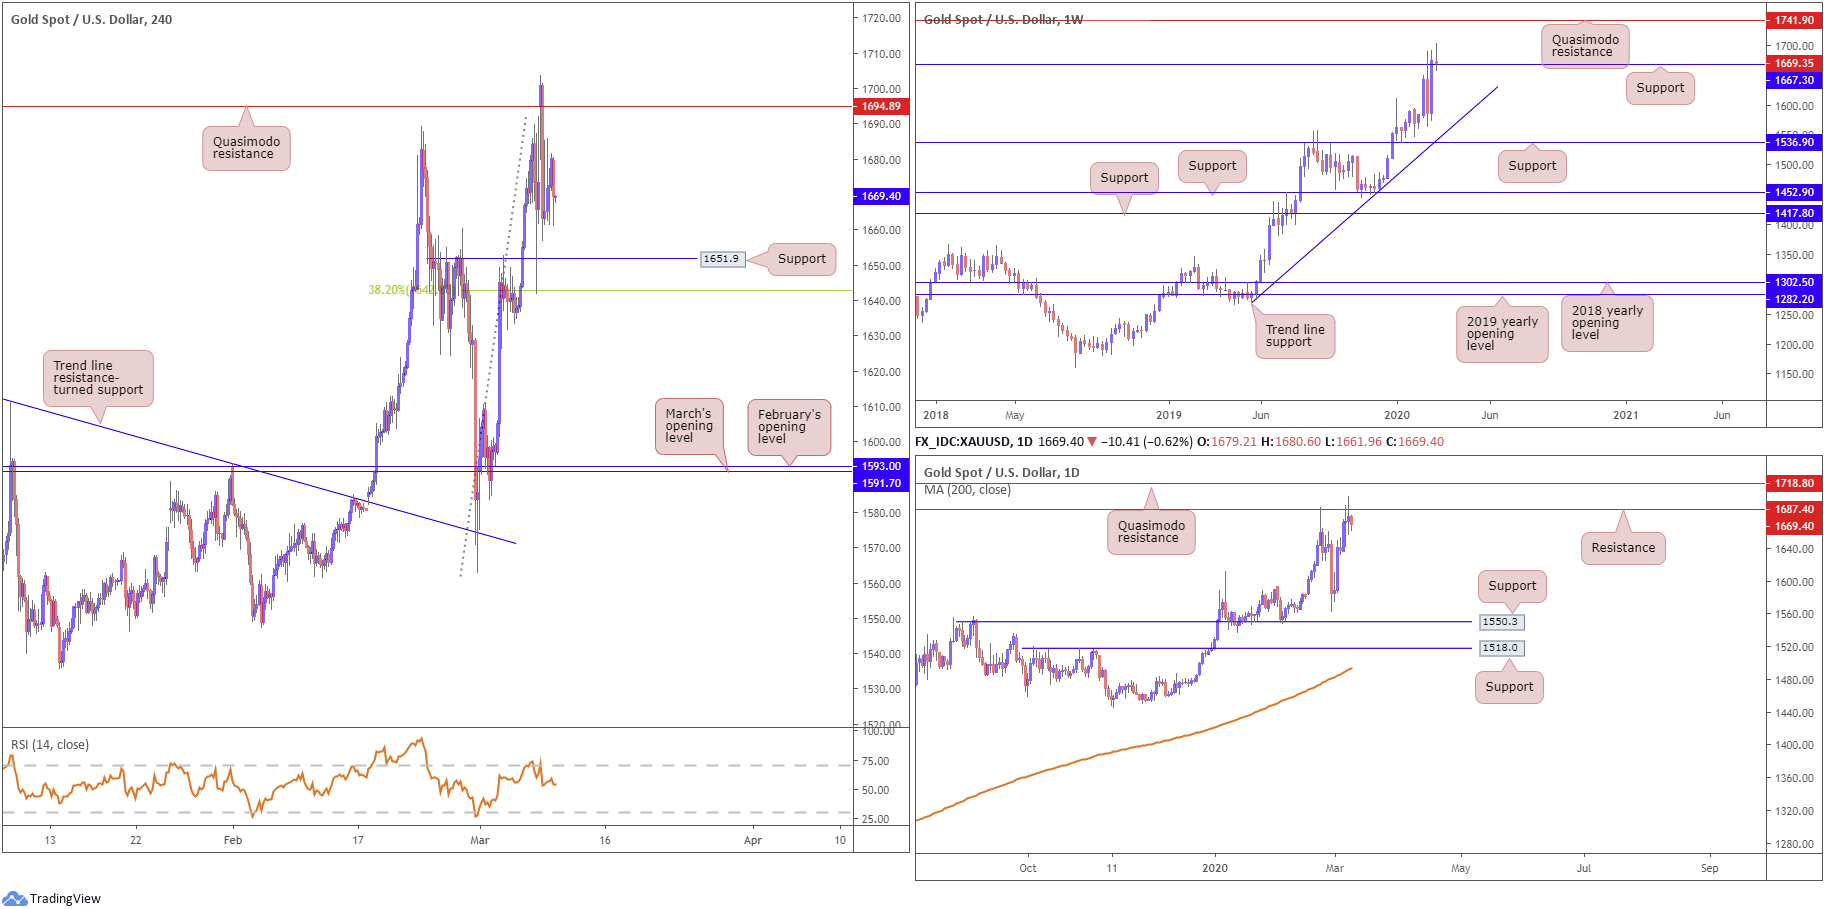
XAU/USD (GOLD):
A tumultuous day had Treasury yields collapse to all-time lows, oil prices fall near 30% and the US dollar index drive to lows beyond 95.00. The price of gold, in $ terms, nonetheless, echoed a reasonably subdued state.
Technical headlines has weekly price testing support at 1667.3, after failing to sustain gains past 1703.6. Continued demand for bullion this week may welcome Quasimodo resistance at 1741.9 into the fight, whereas a breach of 1667.3 might highlight trend line support, taken from the low 1269.6.
Resistance on the daily timeframe at 1687.4 remains in play, with price fading the level in the shape of a long-legged doji indecision candle Friday and again on Monday. A close above the said level adds conviction to a run higher, targeting a daily Quasimodo resistance plotted at 1718.8.
H4 Quasimodo resistance at 1694.9 entered view Monday, guiding candle action lower, surpassing H4 support at 1651.9 and testing a 38.2% Fib retracement at 1643.2. A rotation lower, one that overwhelms current H4 supports, could lead to an approach forming to March and February’s opening levels at 1591.7 and 1593.0, respectively. In respect to the relative strength index (RSI) we’re seen trading off overbought levels right now, closing in on 50.00.
Areas of consideration:
Although we effectively cleared weekly resistance at 1667.3, price has failed to print a decisive close north of the base. Therefore, entering long based on this, particularly as daily resistance at 1687.4 remains in motion, is chancy, according to the chart studies. A daily close north of 1687.4, of course, would add conviction to the upside.
To take advantage of any downside in this market, traders may consider waiting for the current H4 supports to give way, consequently unlocking the door for bearish scenarios to around 1590ish.
To take advantage of upside, a daily close north of 1687.4, as stated above, adds conviction, though remain aware of daily Quasimodo resistance at 1718.0.
The accuracy, completeness and timeliness of the information contained on this site cannot be guaranteed. IC Markets does not warranty, guarantee or make any representations, or assume any liability regarding financial results based on the use of the information in the site.
News, views, opinions, recommendations and other information obtained from sources outside of www.icmarkets.com.au, used in this site are believed to be reliable, but we cannot guarantee their accuracy or completeness. All such information is subject to change at any time without notice. IC Markets assumes no responsibility for the content of any linked site.
The fact that such links may exist does not indicate approval or endorsement of any material contained on any linked site. IC Markets is not liable for any harm caused by the transmission, through accessing the services or information on this site, of a computer virus, or other computer code or programming device that might be used to access, delete, damage, disable, disrupt or otherwise impede in any manner, the operation of the site or of any user’s software, hardware, data or property.


