EUR/USD:
Weekly Timeframe: The current situation on the weekly timeframe shows the buyers and sellers battling for position deep within a weekly demand area coming in at 1.0760-1.0988. A break below this zone would likely see further downside towards another weekly demand area positioned at 1.0499-1.0740.
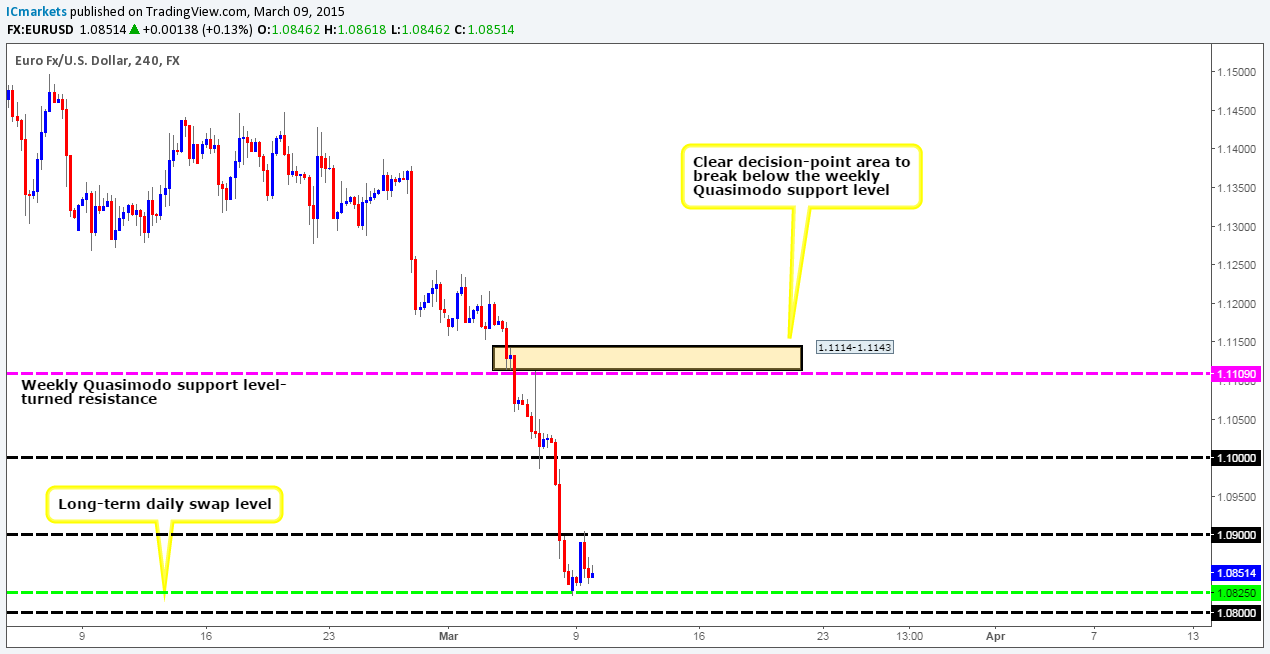
Daily Timeframe: At the time of writing, price is seen resting on a major daily swap level visible at 1.0825, which is surrounded by a daily demand area seen at 1.0760-1.0872 (located deep within the aforementioned weekly demand area).
4hr Timeframe: Recent developments from the 4hr timeframe show that the EUR/USD market opened at 1.0828, and saw a rally higher from the long-term daily swap level mentioned above at 1.0825. This move consequently forced the market to test the 1.0900 barrier, which, as you can see, was clearly enough to support a counterattack back down to the 1.0837 mark.
Taking a quick peek at the 30 minute timeframe showed us that most of the supply around (as far as we can see) 1.0900 has very likely been taken out, and that the path may well be clear for prices to challenge 1.1000. Therefore with this in mind, price may, at some point today retest the daily swap level, and give us a second chance to look for longs. In the event that we find a long entry here, we plan to take partial profits around 1.0900, and if price manages to break above and retest this level, we’d then look to ride this train up to 1.1000 to take full profit. The reason we require confirmation around this daily swap level (as mentioned yesterday) is simply because price could, and very likely will, fake lower down to the 1.0800 handle.
Nonetheless, supposing that price closes below and retests this daily level as resistance, this will likely suggest further downside is going to be seen on the Euro, as we believe, and this is only our opinion here, that this remains a key obstacle to a move below the major weekly demand area mentioned above at 1.0760-1.0988.

Current buy/sell orders:
- Buy orders: watching the 1.0825 mark for lower timeframe confirmation (Predicative stop-loss orders seen at: dependent on where one confirms this level).
- Sell orders: Flat (Predicative stop-loss orders seen at: N/A).
GBP/USD:
Weekly Timeframe: At the time of writing, the weekly timeframe shows buying pressure being seen from just above a weekly Quasimodo support level coming in at 1.5007. Assuming that the buyers can continue with this tempo, weekly resistance is not expected to come into the market until around the weekly swap level seen above at 1.5272.
Daily Timeframe: Yesterday’s trading day was clearly a good one for anyone long Cable, as price rebounded nicely from a daily demand area at 1.4987-1.5601, which, if you look back to the weekly chart, you’ll notice that this area sits on top of the aforementioned weekly Quasimodo support level.
4hr Timeframe: From the 4hr timeframe, we can see that the 4hr demand area (located deep within the aforementioned daily demand) at 1.4987-1.5020 was clearly a great zone to be looking for longs. Unfortunately, like the Euro, price did not show any confirmation on the lower timeframes before rallying higher, so we missed this move entirely.
However, we might, just might be given a second chance to enter long. As you can probably see, the recent rally broke above the psychological threshold 1.5100, and is currently retesting this level as support. If we manage to find a lower timeframe confirmation signal to enter long here, we’ll attempt to trail the GBP up to a 4hr swap area seen at 1.5163-1.5188, and possibly higher depending on how price action behaves around this zone.

Current buy/sell orders:
- Buy orders: 1.5100 [Tentative – confirmation required] (Predicative stop-loss orders are seen at: dependent on where one confirms this level).
- Sell orders: Flat (Predicative stop-loss orders are seen at: N/A).
AUD/USD:
Weekly Timeframe: For the past five weeks, price has been trading around the upper limits of a weekly demand area seen at 0.7449-0.7678, which, as you may be able to see, converges beautifully with a long-term weekly trendline extended from the low 0.4775 (2001). Should a rally be seen here, weekly resistance (as far as we can see) is not expected to come into the market until around the 0.8064 region.
Daily Timeframe: Overall, the daily timeframe has barely seen any change since the beginning of February, as buying and selling still remains capped between two daily swap levels coming in at 0.7691 and 0.7844. However, at this point in time, price is seen trading nearer the lower limits (0.7691) of this consolidation, so anyone looking to sell this pair may want to keep this, and the fact that price is trading above weekly demand (see above) at the moment noted down.
4hr Timeframe: The Aussie market opened at 0.7706, and rallied higher from a 4hr demand area (that boasts trendline confluence from the low 0.7625) at 0.7666-0.7703 (located around the 0.7691 daily swap level). However, as you can probably see, price found resistance around a 4hr swap area coming in at 0.7738-0.7750 (adapted from Monday’s analysis), and forced the market back down to the aforementioned 4hr demand area.
Taking all of the above into consideration, our team has come to a general consensus that no long positions will be initiated until price closes above the aforementioned 4hr swap area. Conversely, entering short into potential higher-timeframe opposition (see above) is of no interest to us. With that, opting to stand on the side lines here may very well be the best path for us to take today.

Current buy/sell orders:
- Buy orders: Flat (Predicative stop-loss orders seen at: N/A).
- Sell orders: Flat (Predicative stop-loss orders seen at: N/A).
USD/JPY:
Weekly Timeframe: Last week shows price closed (120.69) above the upper limits of a weekly symmetrical triangle formation (121.83/117.43). Assuming that the buyers can maintain their position here, we feel there’s a very good chance that price will likely hit the weekly Quasimodo resistance level coming in at 122.18 sometime soon.
Daily Timeframe: The USD/JPY pair saw further buying yesterday consequently seeing the market advance to a fresh high of 121.40, thus placing price within a stone’s throw away from daily supply coming in above at 122.61-121.54 (encapsulates the aforementioned weekly Quasimodo resistance level).
4hr Timeframe: Following the market open at 120.81, price was seen teasing the 121.00 handle which eventually broke out north, and as a result likely cleared the path north towards a 4hr supply area coming in at 121.83-121.52 (hanging just below the daily supply area mentioned above at 122.61-121.54).
Taking all of the above into account, our team’s main focus today will be watching for price to retest 121.00 (tentative buy orders are seen above at 121.02) as support. In the event that the market allows us to lock in a long entry here, it is in our plan to take full profits around the 4hr supply area at 121.83.121.52, since at that point we would then be trading very near to higher-timeframe resistances (see above).

Current buy/sell orders:
- Buy orders: 121.00 [Tentative – confirmation required] (Predicative stop-loss orders seen at: dependent on where one confirms this level).
- Sell orders: Flat (Predicative stop-loss orders seen at: N/A).
USD/CAD:
Weekly Timeframe: Overall, price action on the weekly timeframe remains relatively unchanged. The USD/CAD is still capped to the upside by a weekly Quasimodo resistance level visible at 1.2765. Should further selling be seen from here, weekly support (as far as we can see) is not expected to come into the market until around the 1.2260 region.
Daily Timeframe: Supportive pressure is still being seen from a weak-looking daily decision-point demand area at 1.2378-1.2468. if price manages to close above the high seen at 1.2662, we then feel there’s a very good chance that price will rally to test the aforementioned weekly Quasimodo resistance level once again, since most of the supply to the left appears to have already been spiked (consumed).
4hr Timeframe: The 4hr timeframe shows that the market opened at 1.2611, and began with a little buying into 4hr supply at 1.2662-1.2612 before closing below 1.2600. A few hours later, we (as we said we would in the previous analysis) took a short position on the 30 minute timeframe when price retested this level, which was, an hour later, closed at breakeven. Ever since then, price has been seen oscillating around the 1.2600 handle.
The aforementioned 4hr supply area is, in our opinion, a key obstacle to a move towards the weekly Quasimodo resistance level (1.2765), since, if you take a look back to the daily chart, you’ll notice the high 1.2662 that needs to be consumed in order for higher prices to ensue, is also the high of our 4hr supply area.
So, with all of the above in mind, our team has reported the following:
- If the sellers manage to hold out below 1.2600 today, and close below the low 1.2572, we’ll begin watching for lower timeframe price action to enter short down to the 1.2533 level.
- Assuming that price breaks above the current 4hr supply, we have no interest in buying up to 1.2700. Instead, we’ll be looking to sell any fakeout seen above 1.2700 into a beautiful 4hr supply area at 1.2771-1.2736 (Take note of the yellow area – the fakeout zone), which is sitting just below the weekly Quasimodo resistance level.

Current buy/sell orders:
- Buy orders: Flat (Predicative stop-loss orders seen at: N/A).
- Sell orders: Flat (Predicative stop-loss orders seen at: N/A).
USD/CHF:
Weekly Timeframe: The weekly timeframe shows that price printed a large full-bodied bullish candle last week, which managed to close above a long-term weekly swap level seen at 0.9746. This move has potentially opened the gates for further buying towards a weekly Quasimodo resistance level coming in at 0.9970.
Daily Timeframe: The daily timeframe on the other hand, reveals that the buyers and sellers are currently pulling for position around the underside of a daily swap (supply) area coming in at 0.9866-0.9918. This swap area is (as far as we can see) a key obstacle to a move towards the aforementioned weekly Quasimodo resistance level.
4hr Timeframe: Similar to the daily timeframe, the 4hr timeframe shows that ever since the market opened at 0.9868, price has been seen lingering just below the aforementioned daily swap (supply) area, with temporary support coming in just below around the 0.9823 mark. That being the case, price (in our opinion) can do one of two things, well three, if you count consolidation:
- Rally higher into the daily swap (supply) area, and close above the round number 0.9900. This, in effect, would be our cue to begin watching for price to retest this level as support.
- A sell off could be seen from the daily swap (supply) area down to 0.9800, which is something our team would be interested in taking part in if lower timeframe confirmation was seen.

Current buy/sell orders:
- Buy orders: Flat (Predicative stop-loss orders seen at: N/A).
- Sell orders: currently watching for lower timeframe confirming price action around the daily swap (supply) area at 0.9866-0.9918 (Predicative stop-loss orders seen at: dependent on where one confirms price).
DOW 30:
Weekly Timeframe: Last week’s trading action reveals that the 18098 high was clearly not strong enough to hold as support, which, as a result, saw the market sell off and close at 17869. Should further selling be seen from here this week, weekly support (as far as we can see) is not expected to come into the market until around the ignored weekly Quasimodo level at 17135.
Daily Timeframe: From the daily timeframe, we can see that price has rebounded from a daily demand area coming in at 17686-17836. Provided that the buyers can continue with this tempo, we feel there’s a good chance that price will hit a small daily supply area at 18160-18080 sometime soon.
4hr Timeframe: The 4hr timeframe shows that ever since the market opened at 17887, buying pressure has been seen from the 4hr demand at 17806-17862, which, if you look back to the daily chart, you’ll see that this area is located just above the aforementioned daily demand area. The recent buying has also likely engulfed any selling opposition around the 4hr swap level at 17952, and, as a result, has potentially cleared the path north up to the 18064 barrier.
To take advantage of this potential move, we see two possible options:
- Watch for price to retest 17952 as support, and buy with corresponding lower timeframe confirmation, targeting 18064 for full profits.
- In the event that 17952 gives way, price will likely drop down to the aforementioned 4hr demand area, where at which point, our team will begin watching for lower timeframe buying confirmation around the 17868 mark, targeting both 17952, and 18064.
The reason we recommend 18064 as a place to close the full position at is simply because this level is located right below a daily supply area mentioned above at 18160-18080.

Current buy/sell orders:
- Buy orders: 17952 [Tentative – confirmation required] (Predicative stop-loss orders seen at: dependent on where one confirms this level) 17868 [Tentative – confirmation required] (Predicative stop-loss orders seen at: 17797).
- Sell orders: Flat (Predicative stop-loss orders seen at: N/A).
XAU/USD (Gold):
Weekly Timeframe: From the weekly timeframe, we can see that Gold sold off last week which consequently saw price break (a few pips) below a weekly demand area at 1166.8-1195.0. Could this be all that’s needed to encourage further selling down to a weekly decision-point demand level at 1136.3? Let’s take a look at the lower timeframes to see what we can find…
Daily Timeframe: The current situation on the daily timeframe shows that price remains trading around the low 1166.8, which, you may recall, is the lower limit of the aforementioned weekly demand area. Although it’s visible from the weekly timeframe, the daily timeframe shows that below this low, there is, as far as we can see very little active demand to the left – check out that huge demand consumption tail seen at 1142.6! Therefore, a close below this all-important low would likely force the market further southbound towards the aforementioned weekly decision-point demand level.
4hr Timeframe: Recent developments on Gold show that price rebounded nicely from the descending channel support line extended from the low 1228.1. However, as you can probably see, the market found resistance just above the ignored 4hr Quasimodo level (1170.5) at 1175.2, which forced price back down to Monday’s opening number – 1166.9.
Taking the above into consideration, our team has decided that no sell trades will be initiated until price closes below the low seen marked with a red arrow at 1163.7, since this would likely open the gates for a decent profit target down to 4hr demand at 1142.6-1152.1. Conversely, if price manages to get above the high seen marked with a green arrow at 1175.2 today, we’ll be buyers from that point on at least until price reaches the daily swap level seen at 1182.0.

Current buy/sell orders:
- Buy orders: Flat (Predicative stop-loss orders seen at: N/A).
- Sell orders: Flat (Predicative stop-loss orders seen at: N/A).


