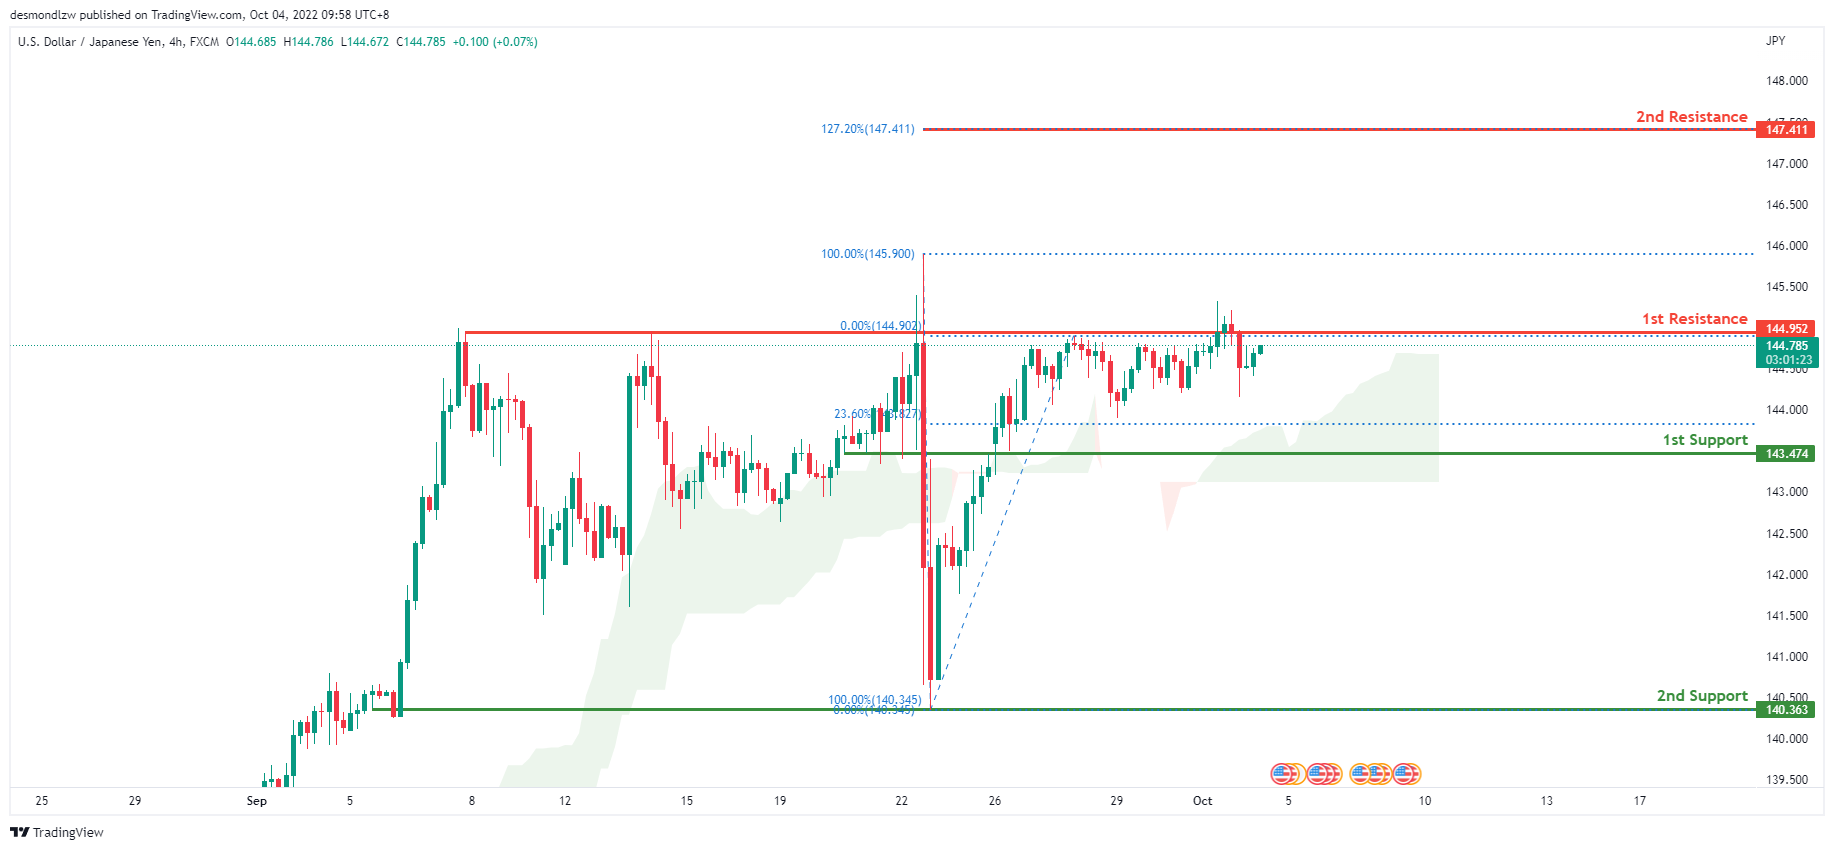
USD/JPY:
On the H4 chart, price is in a strong bullish trend. Furthermore, the price is above the ichimoku cloud, indicating that the market is bullish. Price broke through the 145 level overnight but failed to maintain the bullish momentum, closing below the 145 level. Price is expected to consolidate further around the first resistance level at 144.791, which is also the 145 key level and the 0% Fibonacci line.
Areas of consideration:
- H4 time frame, 1st resistance at 144.952
- H4 time frame, 1st support at 143.474
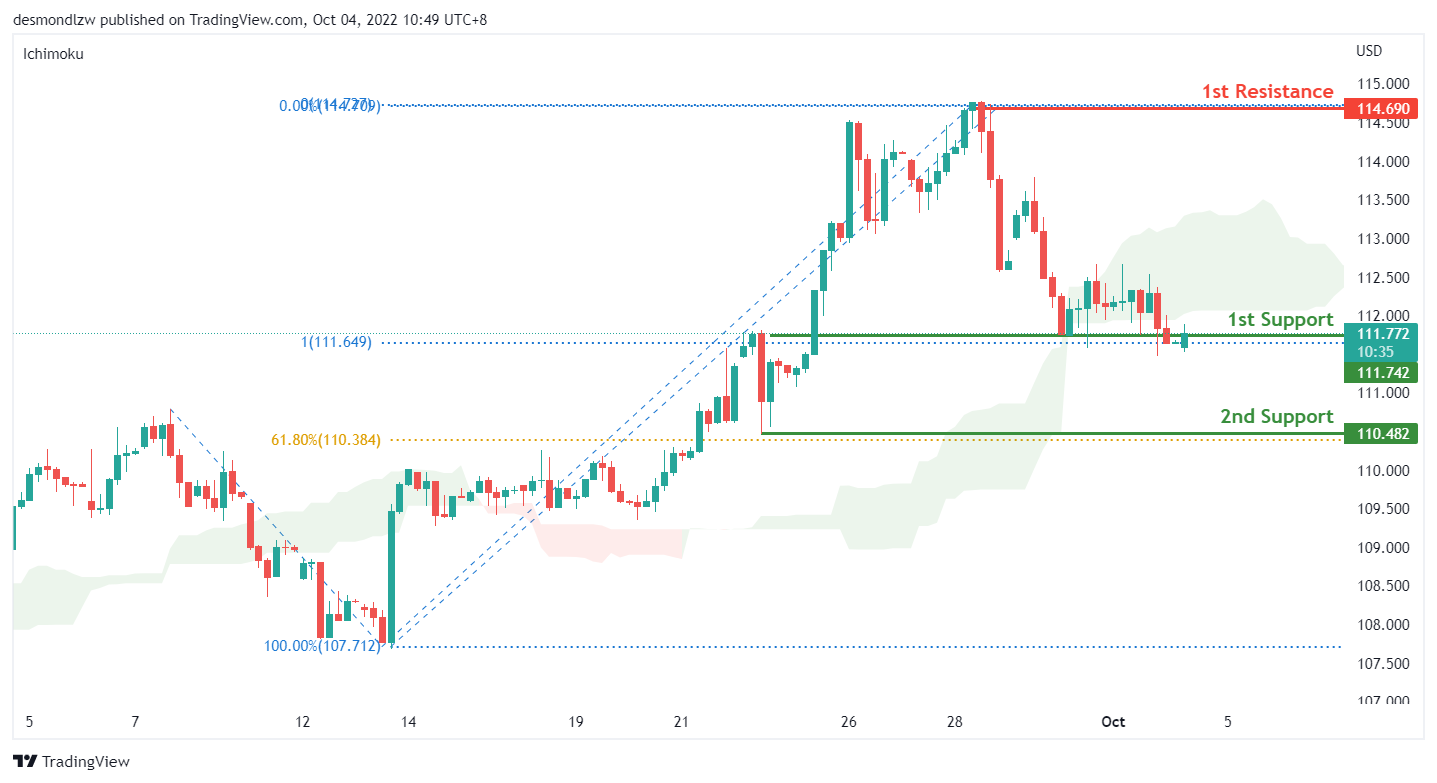
DXY:
On the H4, price has broken lower from the ichimoku cloud and trades at the 1st support of 111.74 which is inline with the 100% fibonacci extension level leading to a bearish bias. If price breaks this support it could trade lower to test the 2nd support of 110.48 which is in line with the 61.80% fibonacci retracement level and the previous swing low from September 2022.
Areas of consideration:
- H4 time frame, 1st resistance at 114.69
- H4 time frame, 1st support at 111.77
- H4 time frame, 2nd support 110.48
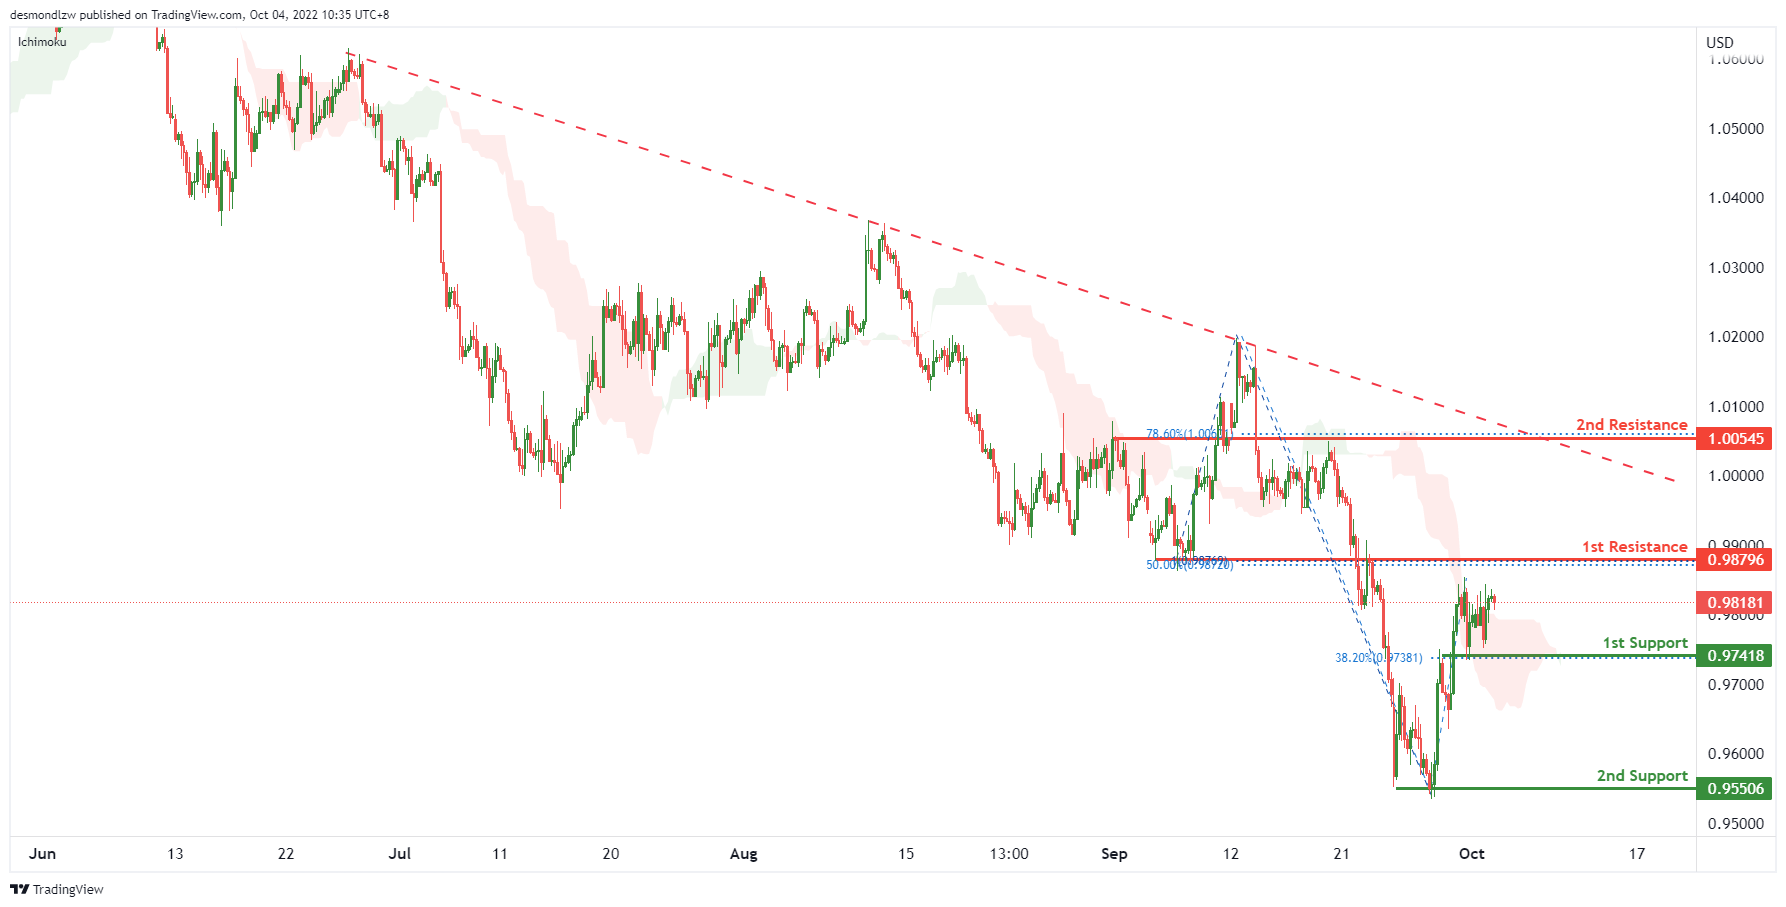
EUR/USD:
On the H4, price is moving within the descending trendline but in an ascending manner, with the price above ichimoku cloud,- we are slightly bullish biased. Price has bounced off the first support and is moving toward the first resistance at 0.98796 where the 100% projection and 50% retracement sits. If price breaks this level, it will test the second resistance at 1.00545, where the 78.6% fibonacci retracement sits. Alternatively, the overall bearish momentum could bring price back to test the first support at 0.97418 where the previous swing low and 38.2% retracement sits. If it breaks this level, we have a strong bearish confirmation to bring price down to 0.95506 where the swing low sits
Areas of consideration :
- H4 1st resistance at 0.98796
- H4 1st support at 0.97418
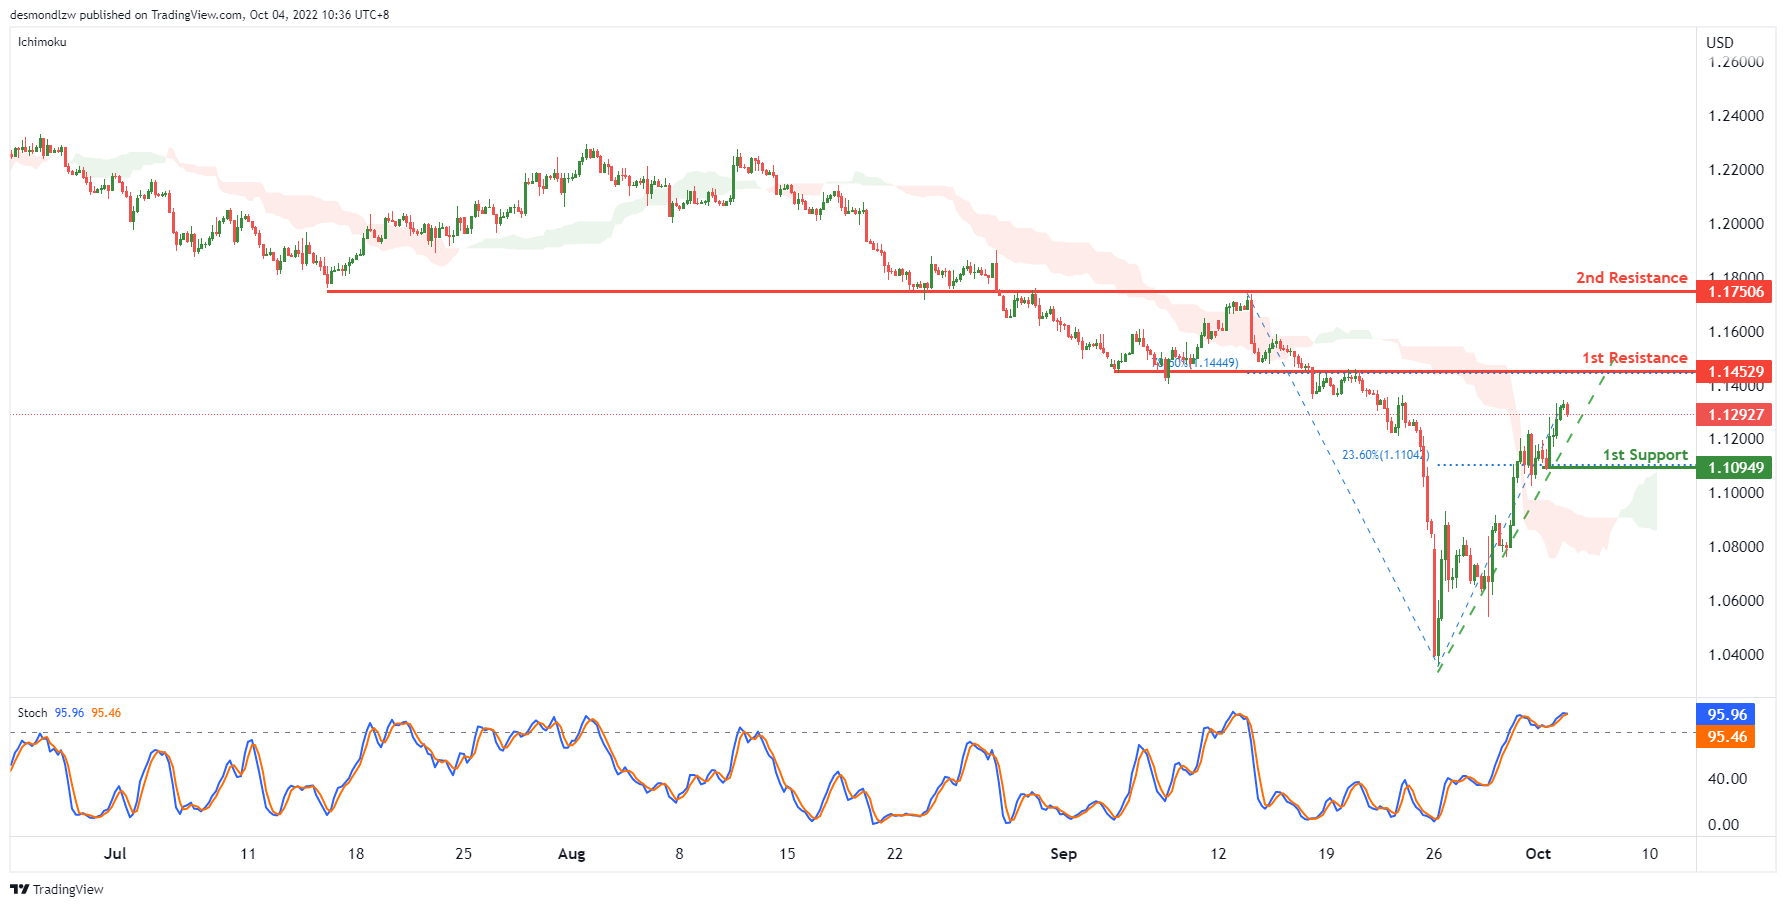
GBP/USD:
On the H4 time frame, prices have bounced off the support level and are moving in an ascending manner, we are slightly bullish. Price is moving toward the first resistance at 1.14529, where the 78.6% retracement and overlap resistance sits. If it breaks this level, its bullish momentum will bring price to second resistance at 1.17506 where the previous swing high and overlap resistance sit. Alternatively, price could pull back to test the first support at 1.10949, where the 23.6% retracement sits.
Areas of consideration:
- H4 1st resistance at 1.14529
- H4 1st support at 1.10949
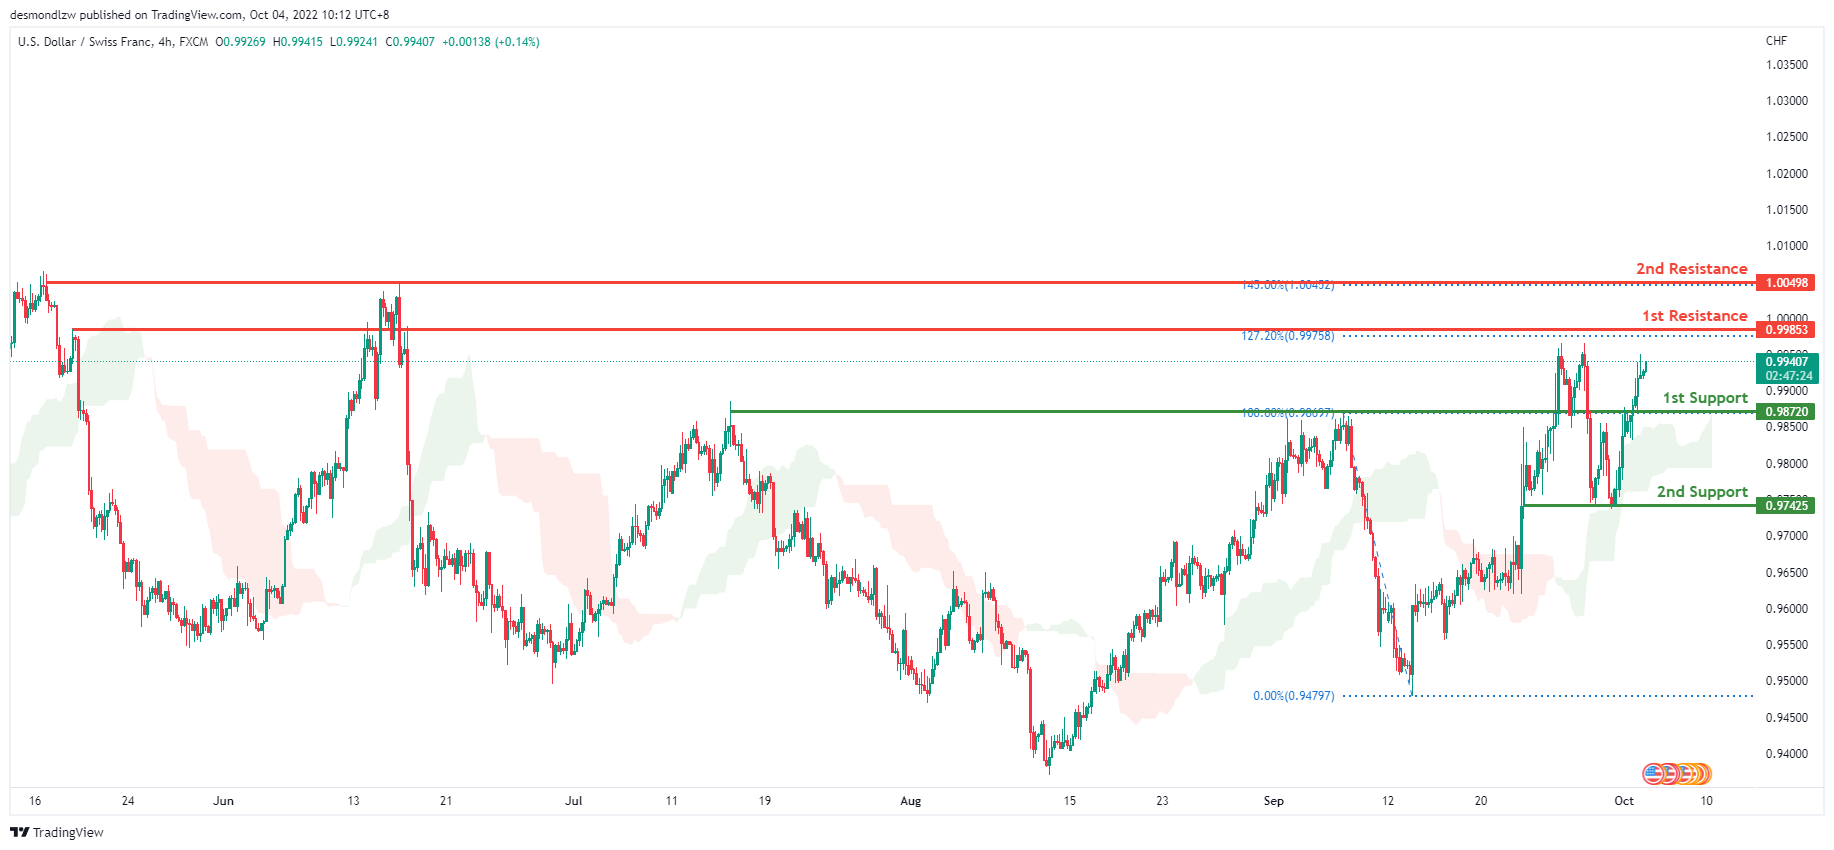
USD/CHF:
The price is in a strong bullish trend on the H4. In addition, price is above the Ichimoku cloud, indicating a bullish market. Price has reflected off the second support level at 0.97425, which contains the 38.2% and 50% Fibonacci lines. Price then proceeded to maintain its strong bullish momentum, breaking through the first support at 0.98720. Given the strong bullish momentum, price is expected to continue moving towards the first resistance level at 0.99853, where the 127.2% Fibonacci extension line is located.
Areas of consideration
- H4 1st support at 0.98720
- H4 1st resistance at 0.99853
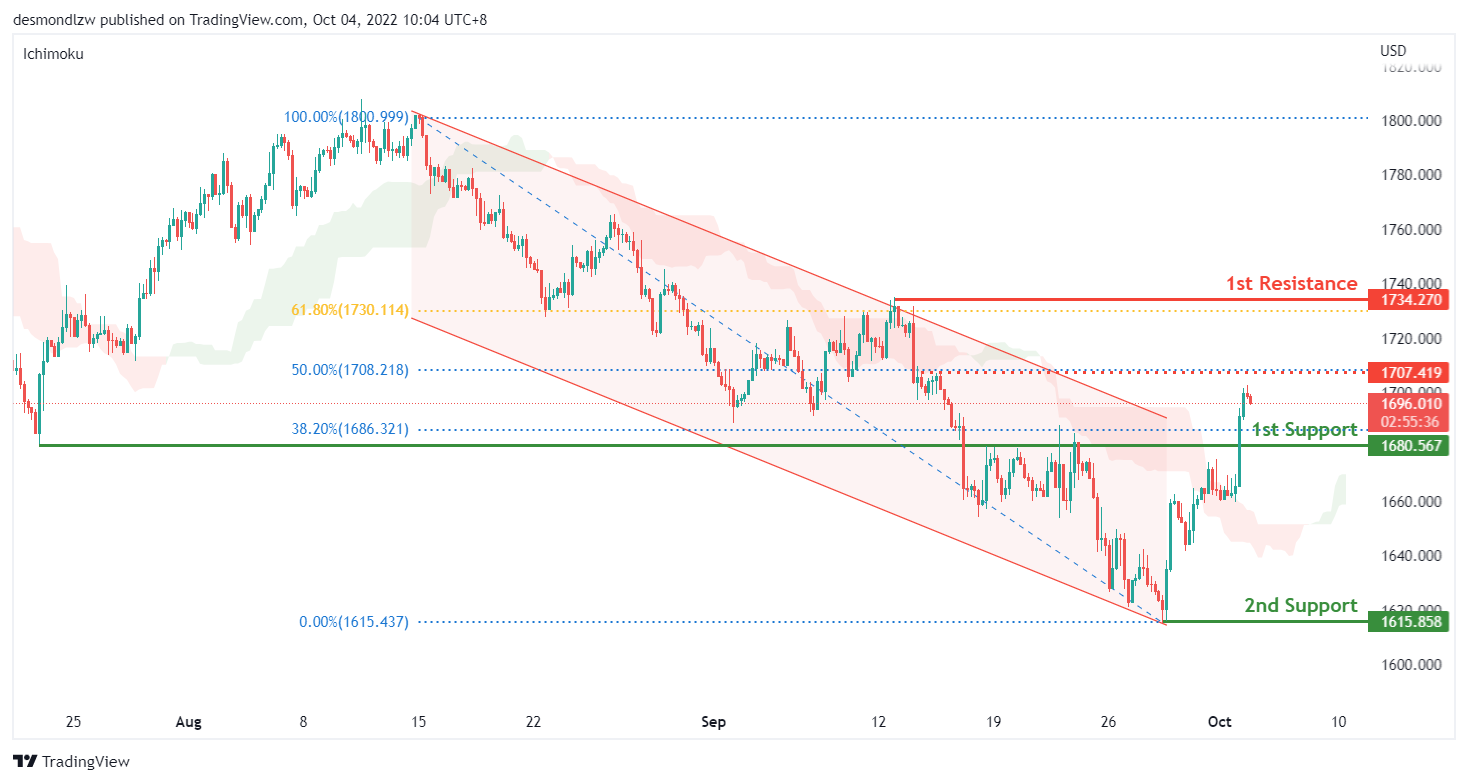
XAU/USD (GOLD):
On the H4, price is broke above the channel and the resistance turned support level of 1680.56, which is inline with the 38.2% fibonacci retracement level and swing low from July 2022. With price above the ichimoku cloud, we have a bullish bias that price could trade higher to the 1st resistance of 1734.27, which is in line with the 61.80% fibonacci retracement level. However, price may retrace towards the 1st support of 1680.56 first before trading higher with a risk level at 1707.41, which is the 50% fibonacci retracement level.
Areas of consideration:
- H4 time frame, 1st resistance at 1734.27
- H4 time frame, 1st support at 1680.56
- H4 time frame, 2nd support at 1615.85
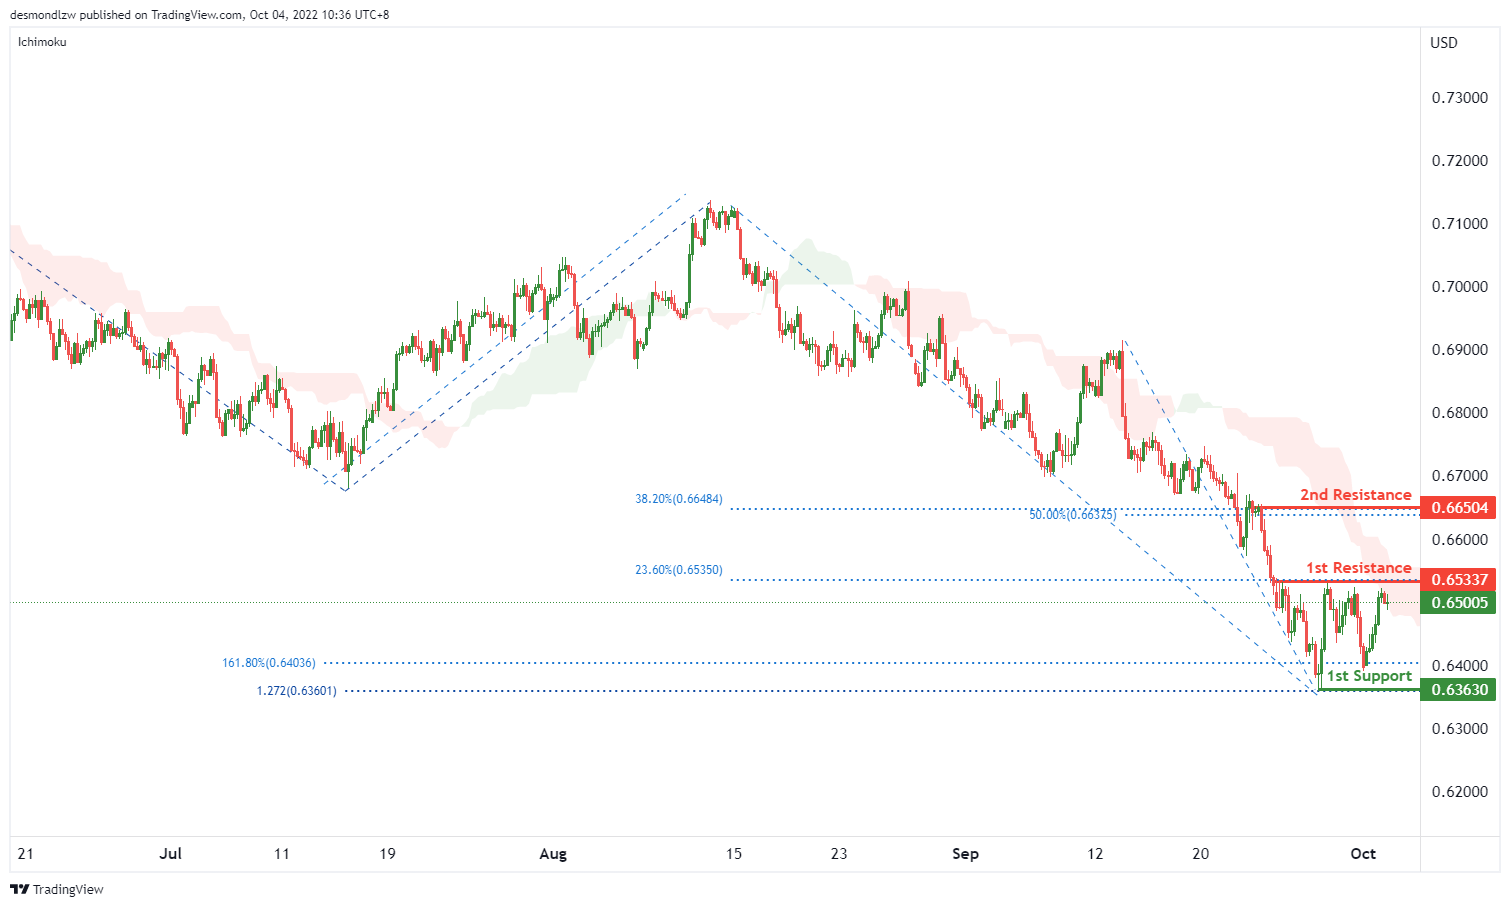
AUD/USD:
On the H4, with the price reversing from the 1st resistance, and the price is below ichimoku cloud, the price may drop form the 1st resistance at 0.65337, which is in line with the 23.6% fibonacci retracement to the 1st support at 0.63630, which is in line with the swing low, 161.8% fibonacci extension and 127.2% fibonacci projection. Alternatively, the price may break the 1st resistance,and rise to the 2nd resistance at 0.66504, where the pullback resistance, 50% and 38.2% fibonacci retracement are.
Areas of consideration
- H4, 1st resistance at 0.65337
- H4, 1st support at 0.63630
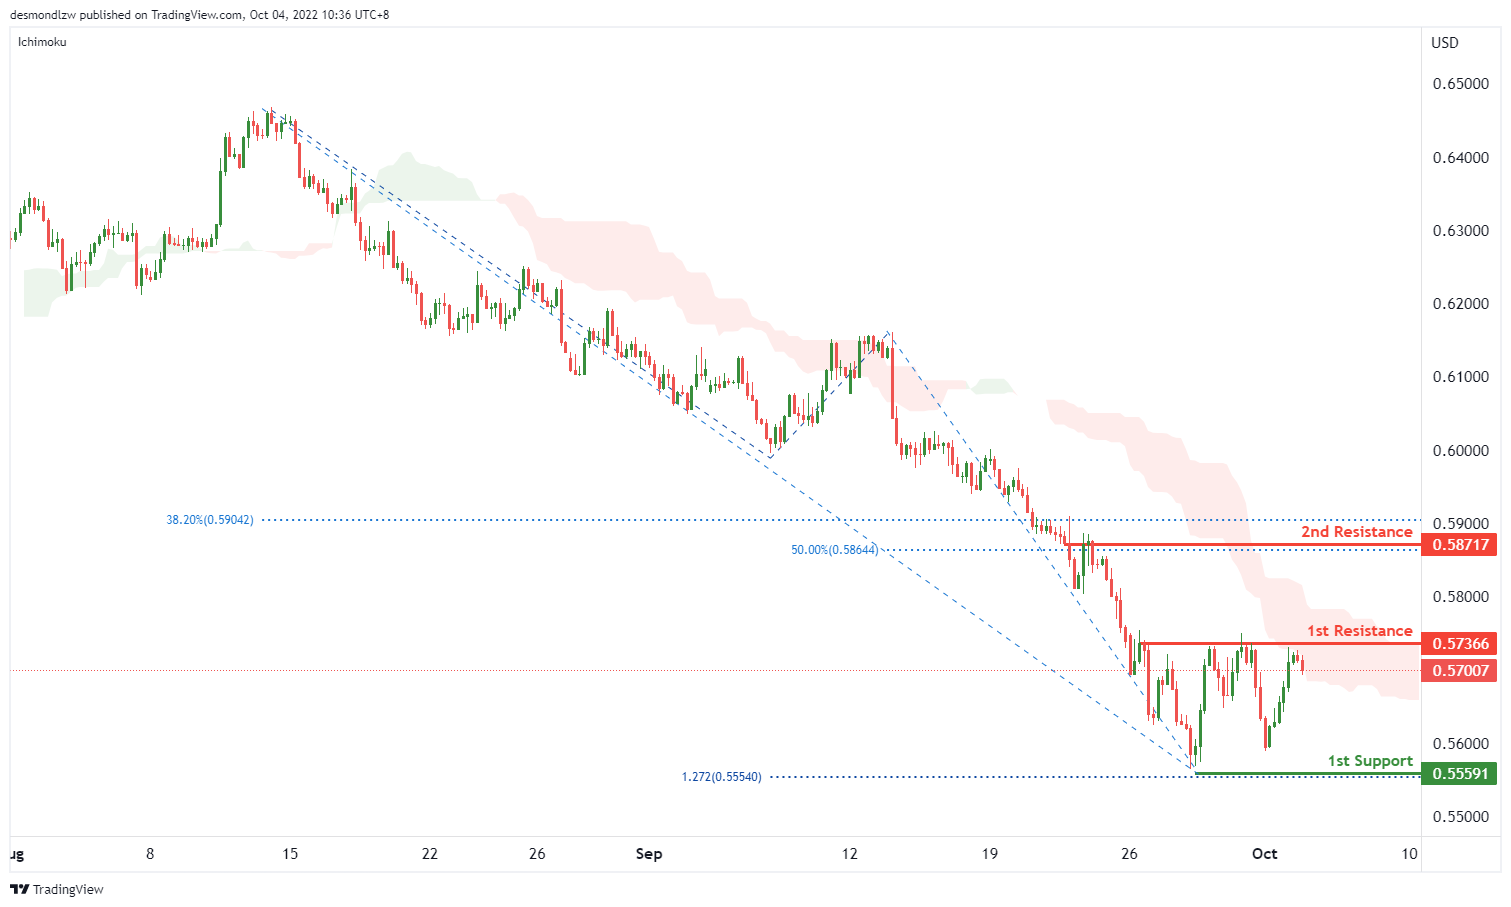
NZD/USD:
On the H4, with the price reversing from the 1st resistance, and the price is below ichimoku cloud, we have a bearish bias that the price may drop form the 1st resistance at 0.57366, where the swing highs are to the 1st support at 0.55591, where the swing low is. Alternatively, the price may break the 1st resistance and rise to the 2nd resistance at 0.58717, where the 38.2% and 50% fibonacci retracement are.
Areas of consideration:
- H4 time frame, 1st resistance at 0.57366
- H4 time frame, 1st support at 0.55591
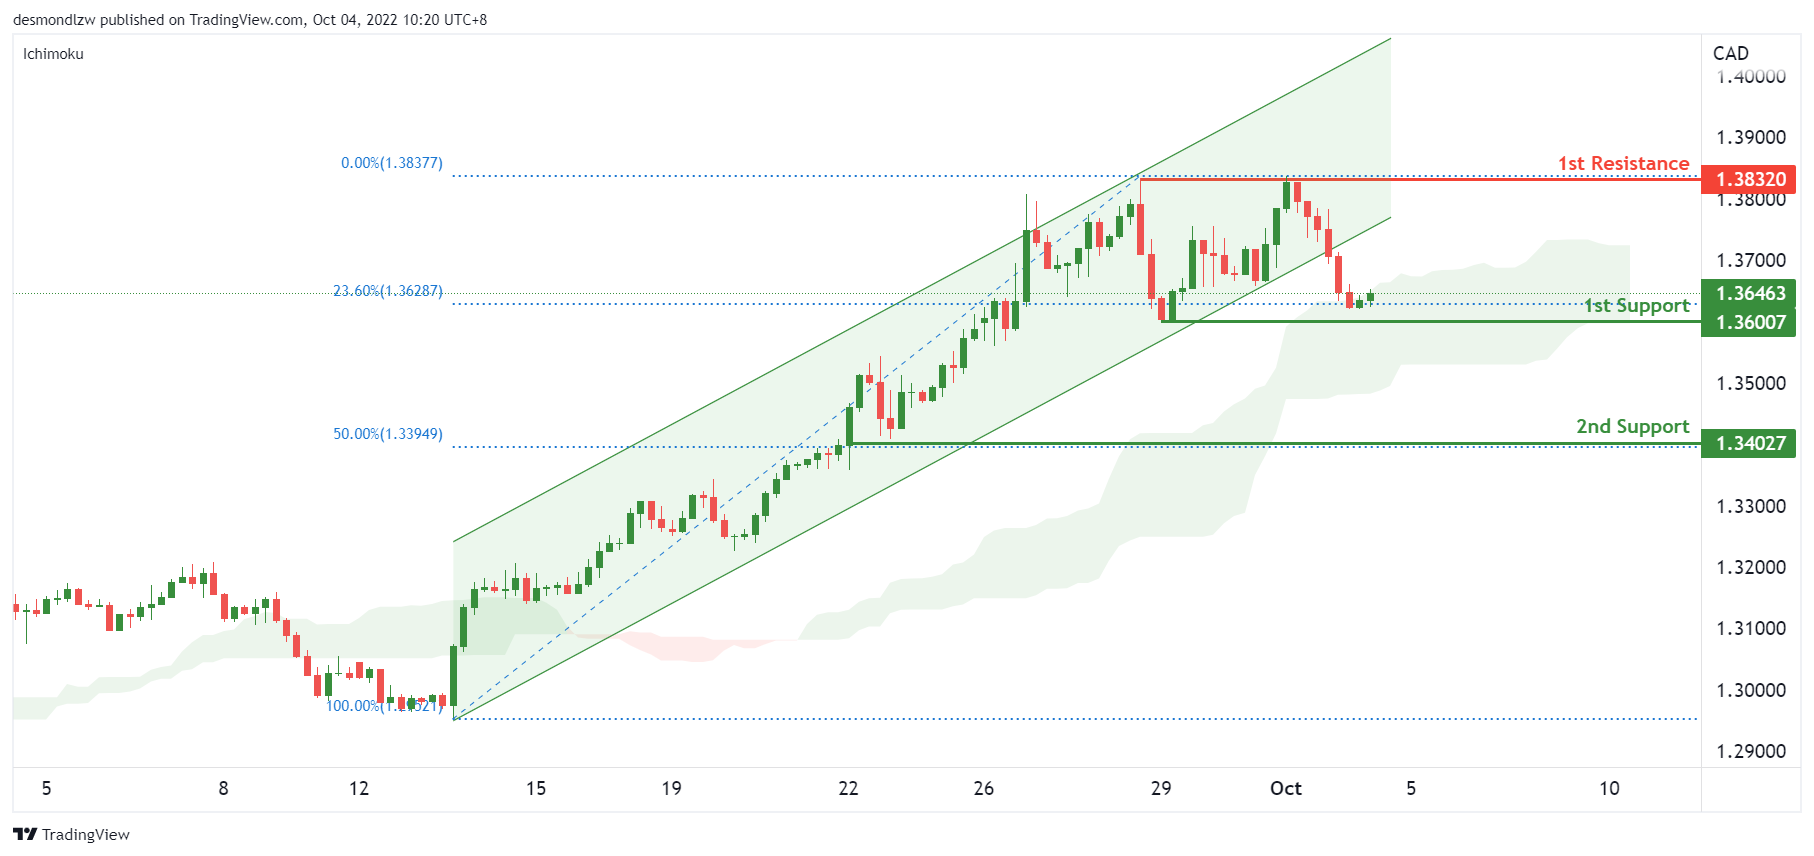
USD/CAD:
On the H4, the price broke lower from the ascending channel and is in the ichimoku cloud at the 1st support of 1.36 which is in line with the 23.60% fibonacci retracement level. We continue to have a bullish bias that price may rise to the 1st resistance at 1.3832, which is in line with the previous swing high from September 2020. Alternatively, price could fall to the 2nd support level of 1.34 which is in line with the 50% fibonacci retracement level.
Areas of consideration:
- H4 time frame, 1st resistance at 1.3832
- H4 time frame, 1st support at 1.36
- H4 time frame, 2nd support at 1.34
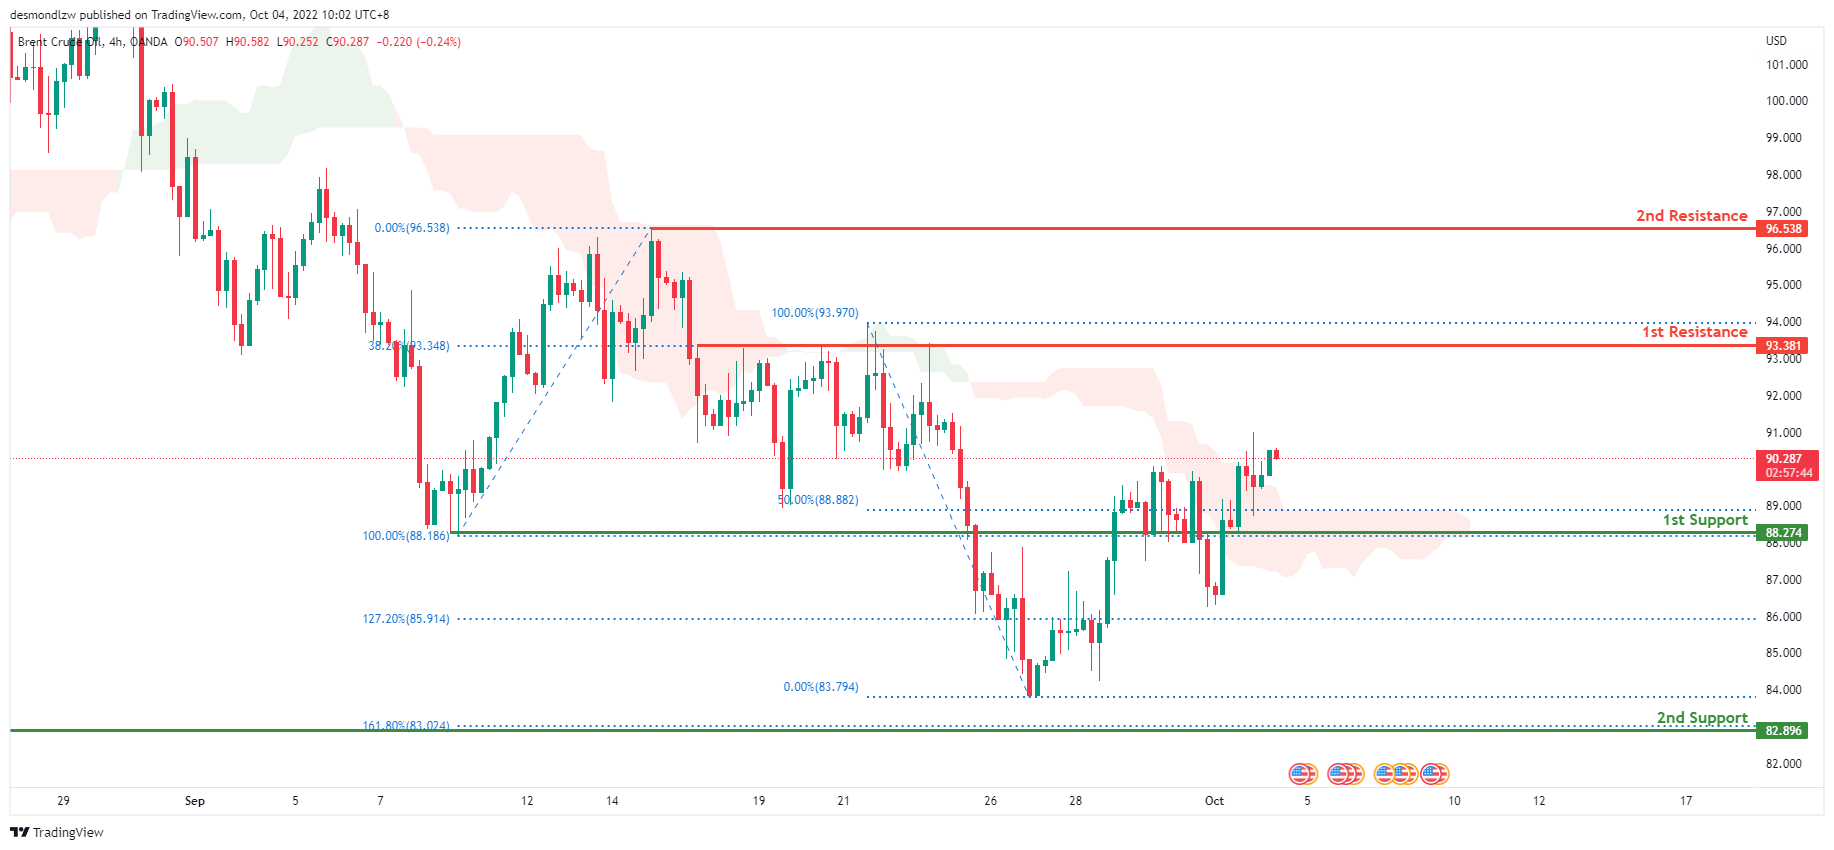
OIL:
Oil is in a bearish trend on the 4-hour chart. However, price is now above the Ichimoku cloud, indicating that the market is bullish at the moment. Price has broken through the first support level, which has a 100% Fibonacci extension and served as the previous swing low, at 88.788. Price is expected to move towards the first resistance level, which is the 38.2% Fibonacci extension line at 93.381, given the current strong bullish momentum.
Areas of consideration:
- H4 time frame, 1st resistance at 93.381
- H4 time frame, 1st support at 88.366
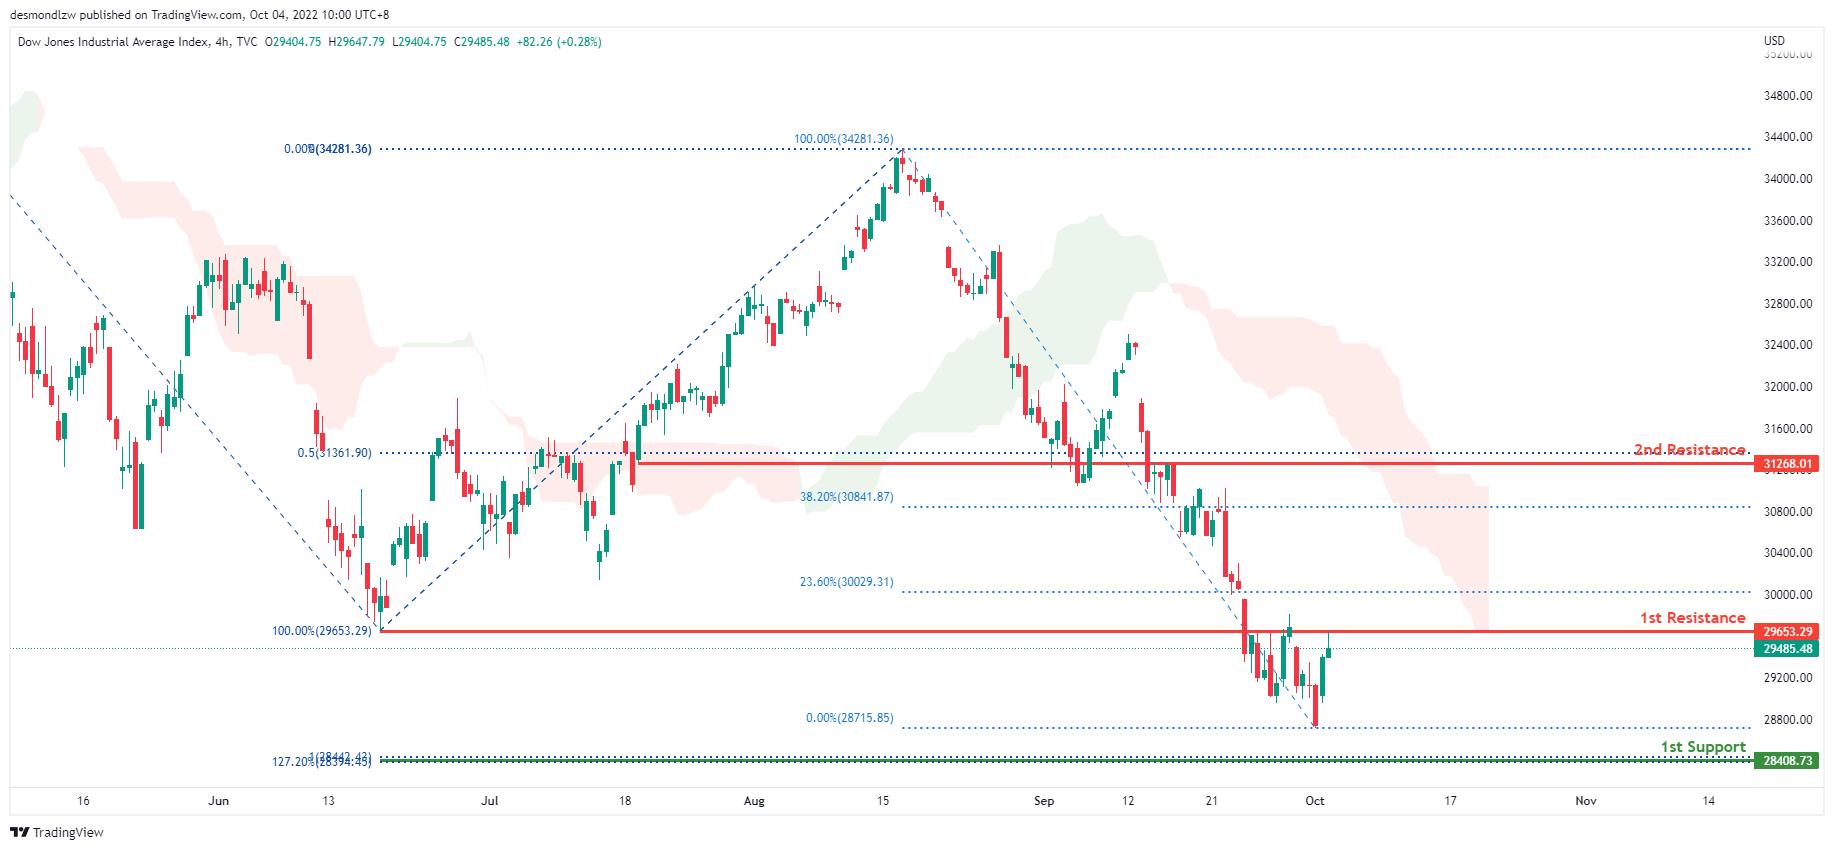
Dow Jones Industrial Average:
On the H4, the price is in a bearish trend. In addition, the price is below the ichimoku cloud, indicating a bearish market. Price has also broken through the first resistance level at 29653.29. This level contains the 100% Fibonacci line and the previous swing low. Overnight, price attempted but failed to break through the first resistance level. Price is expected to move towards the first support level at 28422.42, which contains the 100% Fibonacci projection line and the 127.2% Fibonacci extension line, given the current bearish momentum.
Areas of consideration:
- H4 time frame, 1st support at 28408.73
- H4 time frame, 1st resistance at 29653.29
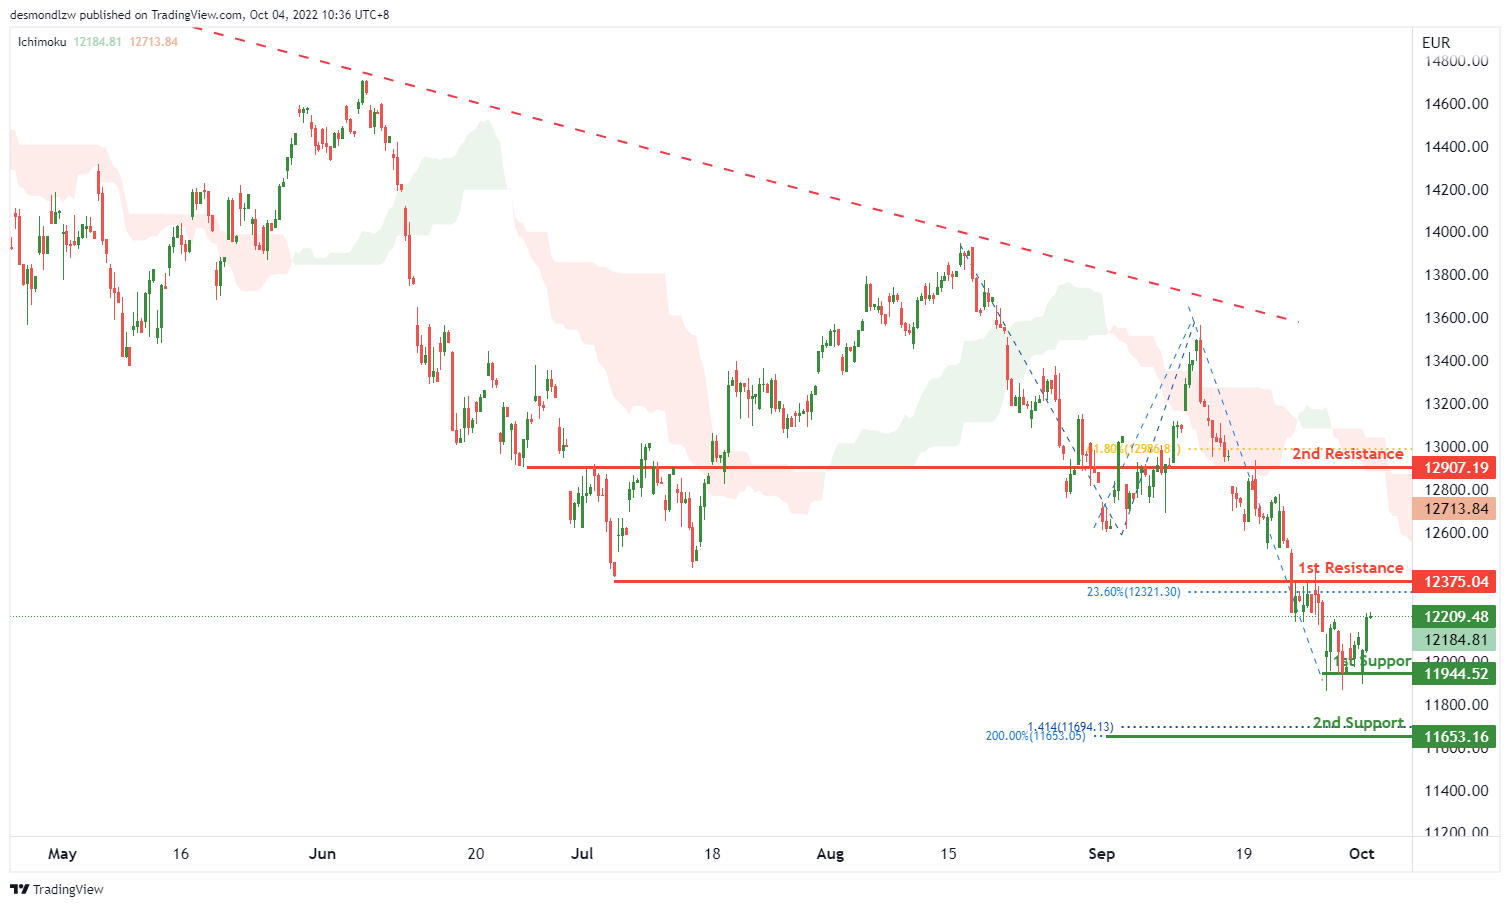
DAX:
On the H4, with the price bouncing from the 1st support at 11944.52, the price may test the 1st resistance at 12375.04, which is in line with the overlap resistance and 23.6% fibonacci retracement. If the 1st resistance is broken, the price may rise to the 2nd resistance at 12907.19, where the 61.8% fibonacci retracement is. Alternatively, the price may drop back to the 1st support, if the 1st support is broken, we can expect the price to drop to the 2nd support at 11653.16, where the 141.4% fibonacci projection and 200% fibonacci projection are.
Areas of consideration:
- H4 time frame, 1st resistance at 12375.04
- H4 time frame, 1st support at 11944.52
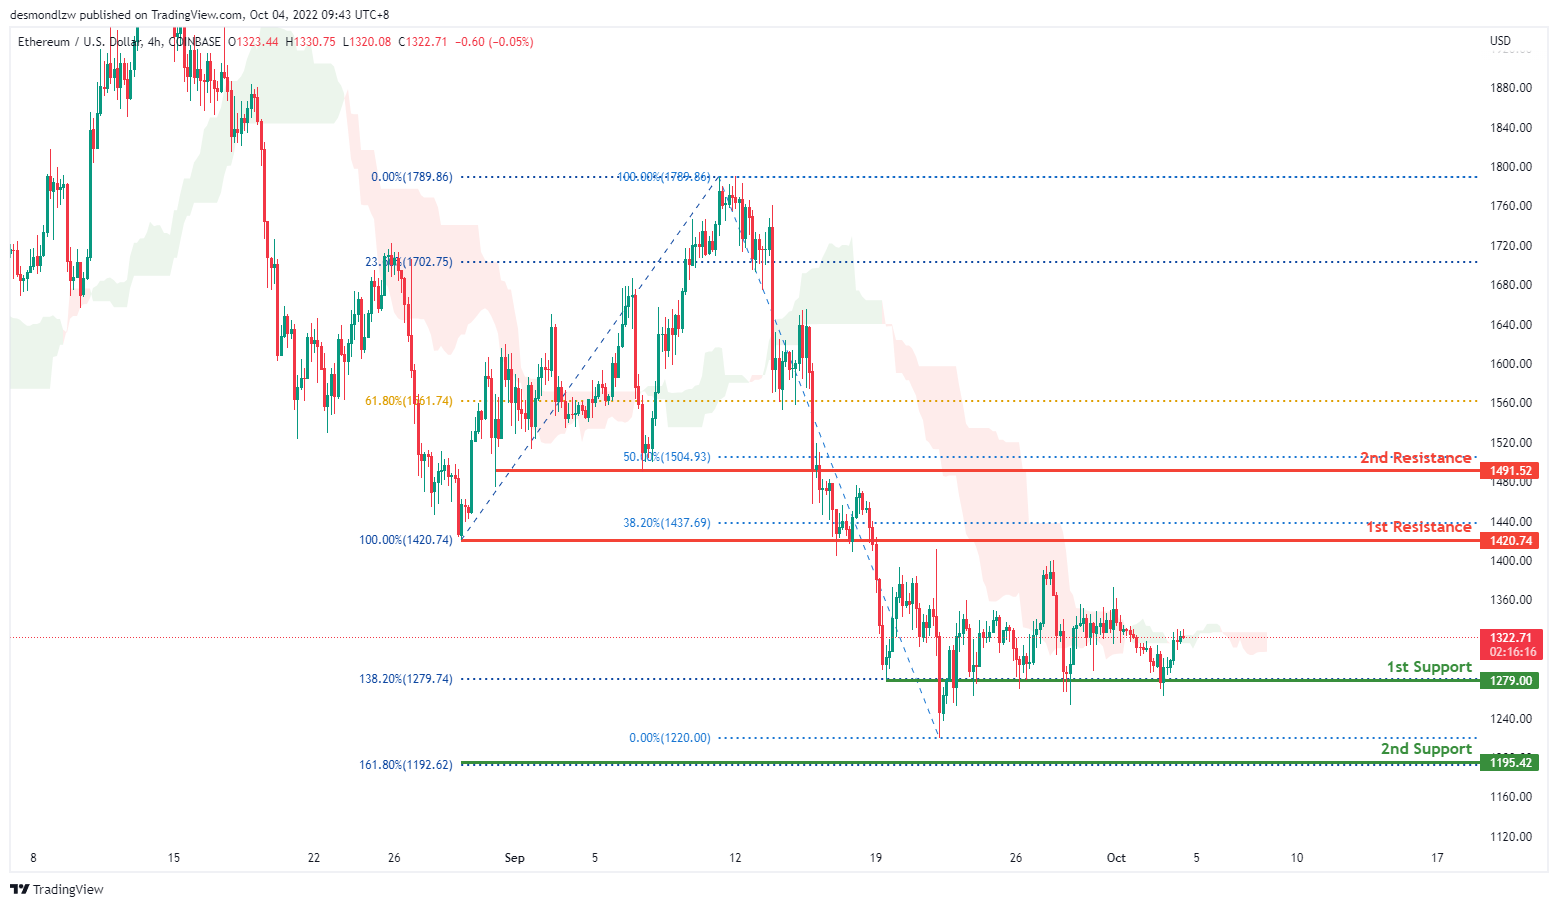
ETHUSD:
On the H4, the overall price of ETHUSD is very bearish. Price has been consolidating above the first support line at 1279.00 for the past two weeks, including Monday this week, which also happens to be the 138.2% Fibonacci line. Price has now closed above the Ichimoku cloud, indicating a possible trend change in the short term. Expect price to return to the first resistance line at 1420.74, which is the 100% Fibonacci and 38.2% Fibonacci line.
Areas of consideration:
- H4 time frame, 1st resistance of 1420.74
- H4 time frame, 1st support at 1279.00
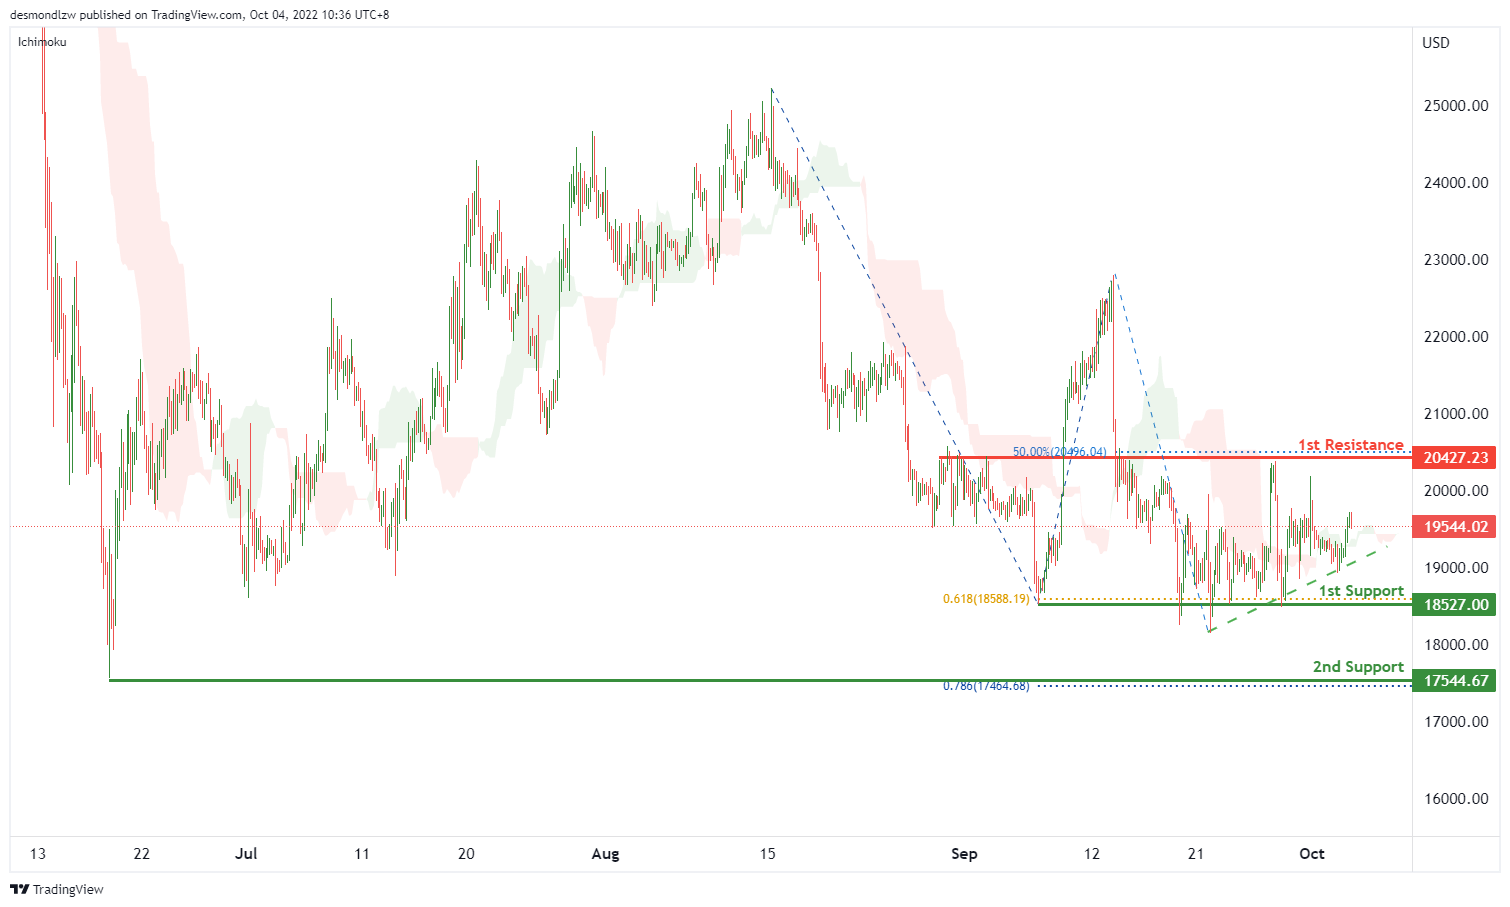
BTCUSD:
On the H4, price is consolidating and showing a short term ascending trendline. Currently the price is above the ichimoku cloud, the price may test the 1st resistance at 20427.23, where the overlap resistance and 50% fibonacci retracement are. Alternatively, the price may drop to the 1st support at 18527, which is in line with the swing lows and 61.8% fibonacci projection. If the 1st support is broken, the 2nd support could be at 17544.67, which is in line with the 78.6% fibonacci projection and swing low.
Areas of consideration:
- H4 time frame, 1st resistance at 20427.23
- H4 time frame, 1st support at 18527
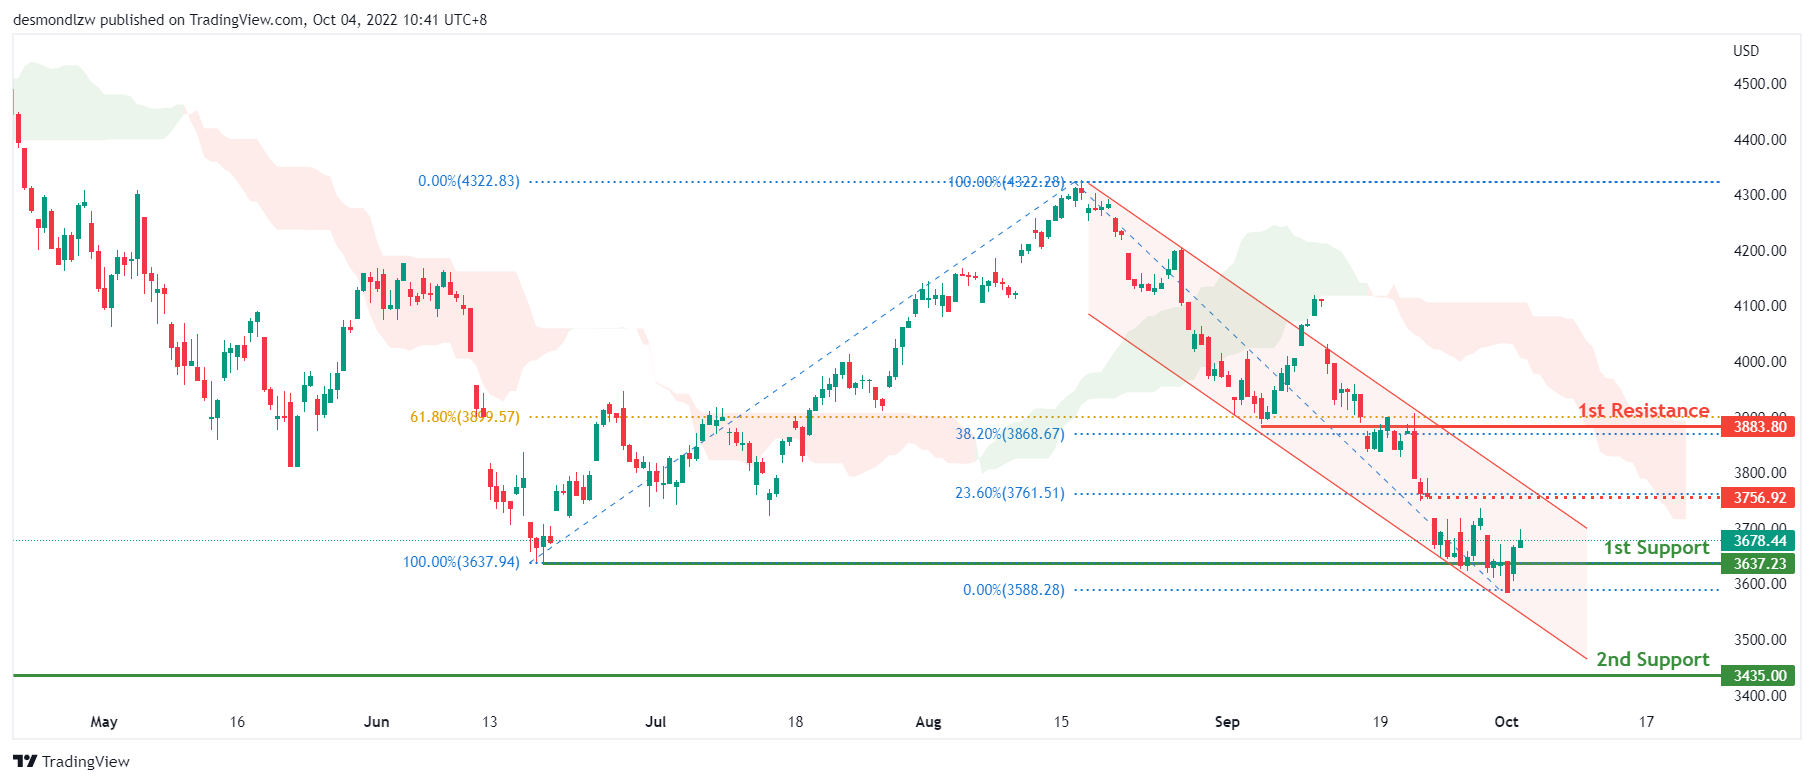
S&P 500:
On the H4, with the price trading higher from 1st support of 3637 which is in line with the previous swing low of June 2022 but still within the descending channel and below the ichimoku cloud, we continue to have a bearish bias. However, price could retrace to the risk level of 3757 which is in line with the 23.60% fibonacci retracement level before trading lower again.
Areas of consideration:
- H4 time frame, 1st resistance at 3883.80
- H4 time frame, 1st support at 3637.23
- H4 time frame, 2nd support at 3435
The accuracy, completeness and timeliness of the information contained on this site cannot be guaranteed. IC Markets does not warranty, guarantee or make any representations, or assume any liability regarding financial results based on the use of the information in the site.
News, views, opinions, recommendations and other information obtained from sources outside of www.icmarkets.com.au, used in this site are believed to be reliable, but we cannot guarantee their accuracy or completeness. All such information is subject to change at any time without notice. IC Markets assumes no responsibility for the content of any linked site.
The fact that such links may exist does not indicate approval or endorsement of any material contained on any linked site. IC Markets is not liable for any harm caused by the transmission, through accessing the services or information on this site, of a computer virus, or other computer code or programming device that might be used to access, delete, damage, disable, disrupt or otherwise impede in any manner, the operation of the site or of any user’s software, hardware, data or property.