
DXY:
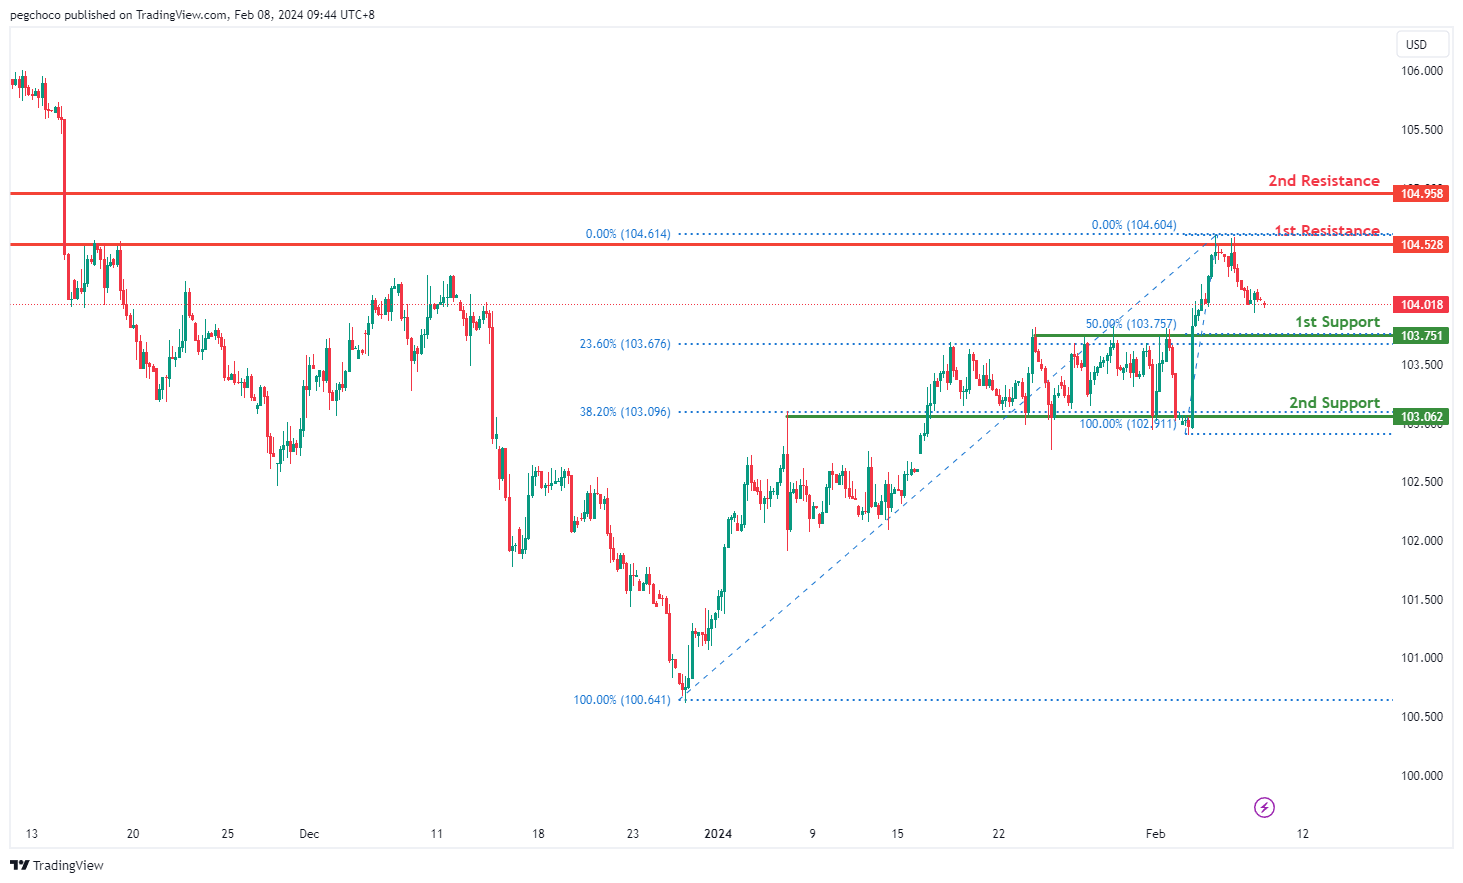
The DXY chart currently indicates a bearish overall momentum, suggesting a downward trend. There’s a potential for a bearish continuation towards the 1st support level.
The 1st support at 103.73 is identified as a pullback support, with the presence of both the 50% and 23.60% Fibonacci Retracement levels, indicating Fibonacci confluence and strengthening its significance as a support level.
Furthermore, the 2nd support level at 103.06 is also recognized as a pullback support, coinciding with the 23.60% Fibonacci Retracement, further reinforcing its potential as a support zone.
On the resistance side, the 1st resistance level at 104.52 is categorized as an overlap resistance, suggesting its historical significance as a potential barrier for upward movement.
Similarly, the 2nd resistance at 104.95 is considered a pullback resistance, indicating its potential role in impeding further upward momentum.
EUR/USD:
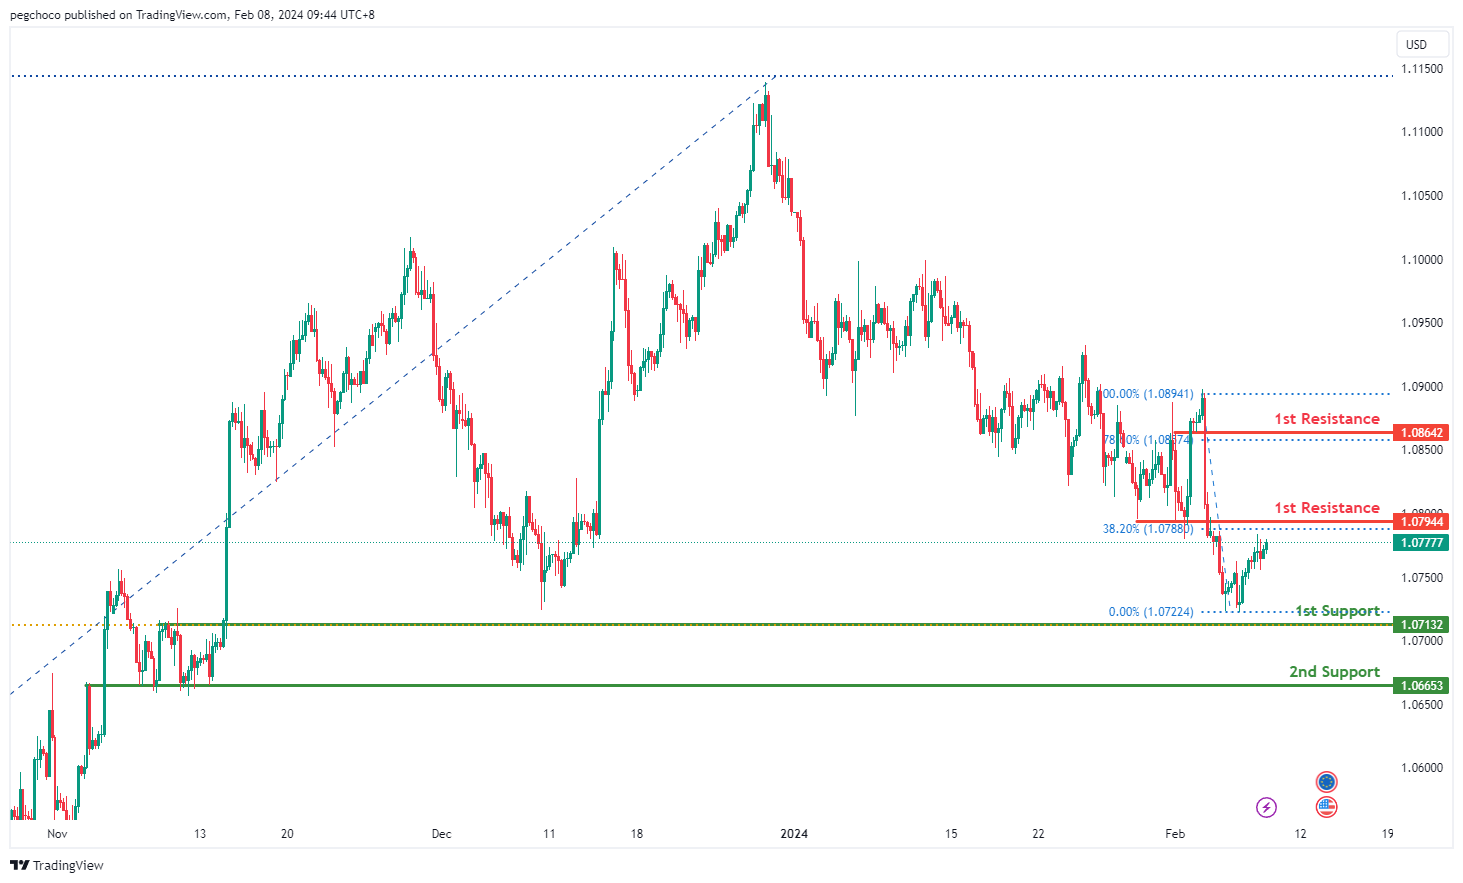
The EUR/USD chart currently demonstrates a bearish overall momentum, signaling a downward trend. There’s a potential for a bearish reaction off the 1st resistance level, leading to a drop towards the 1st support.
The 1st support at 1.0713 is identified as a pullback support, aligning with the 61.80% Fibonacci Retracement level, suggesting its significance as a potential support zone.
Additionally, the 2nd support level at 1.0665 is characterized as an overlap support, indicating its historical importance as a potential area where buying interest may emerge.
On the resistance side, the 1st resistance level at 1.0794 is categorized as an overlap resistance, coinciding with the 38.20% Fibonacci Retracement, suggesting its historical significance as a potential barrier for further upward movement.
Furthermore, the 2nd resistance at 1.0864 is identified as a pullback resistance, aligning with the 78.60% Fibonacci Retracement, indicating its potential role in impeding further upward momentum.
EUR/JPY:
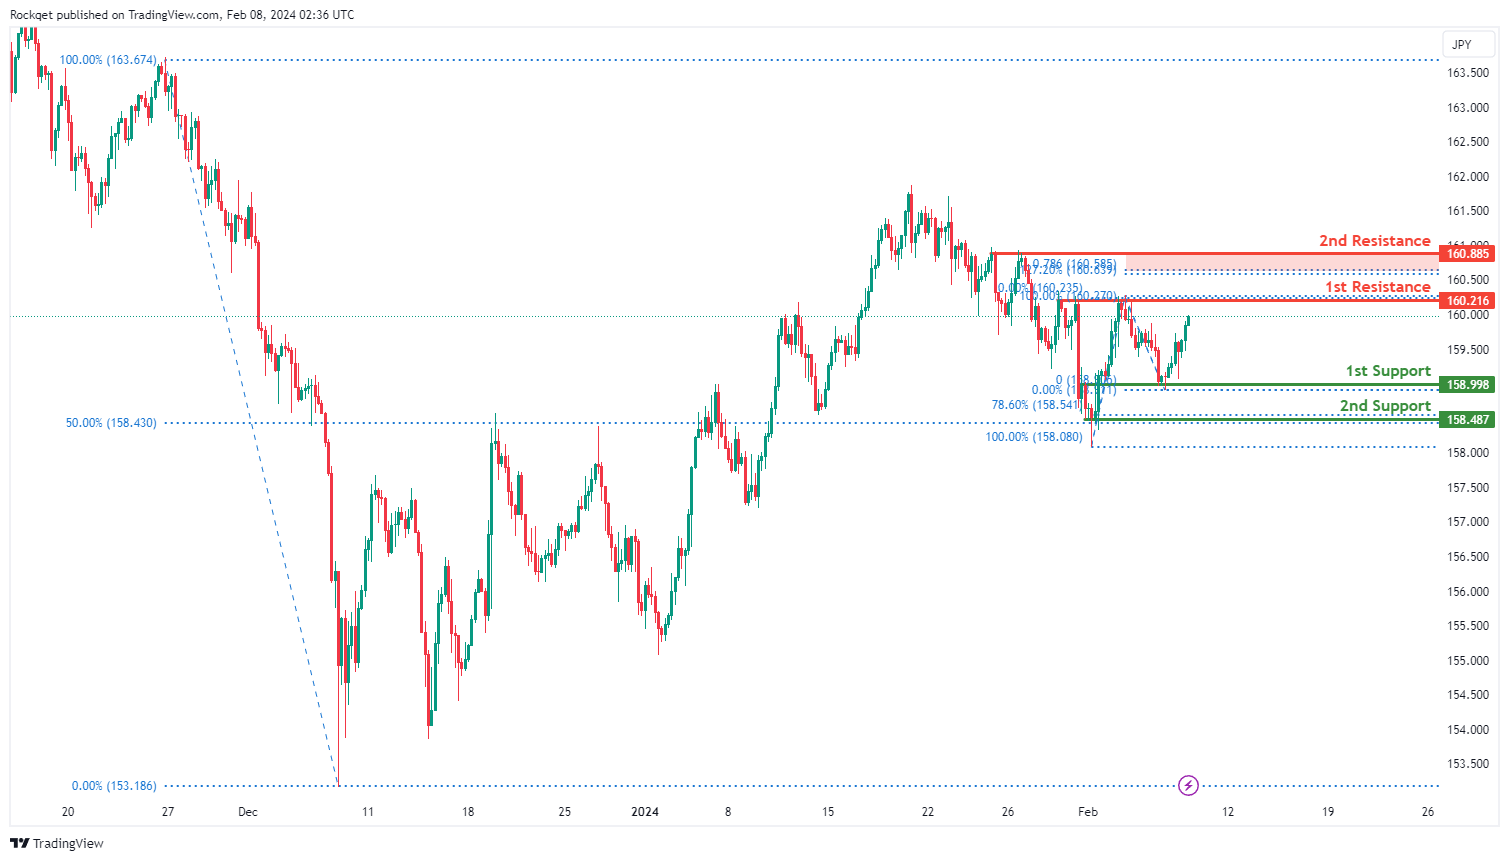
The EUR/JPY chart currently exhibits a bullish momentum, indicating an upward trend. Several factors contribute to this bullish sentiment, including pullback and swing low supports, as well as key Fibonacci retracement levels.
The 1st support level at 158.998 is significant due to its alignment with a pullback support and the 78.60% Fibonacci Retracement level. This suggests that historical buying interest has emerged at this level.
Additionally, the 2nd support at 158.487 coincides with a swing low support and the 50% Fibonacci Retracement, adding further strength to the potential support zone.
On the resistance side, the 1st resistance level at 160.216 is highlighted as a point of potential selling pressure, representing a pullback resistance.
Furthermore, the 2nd resistance at 160.885 serves as another barrier to bullish continuation, aligning with a pullback resistance and the 78.60% Fibonacci Projection
EUR/GBP:
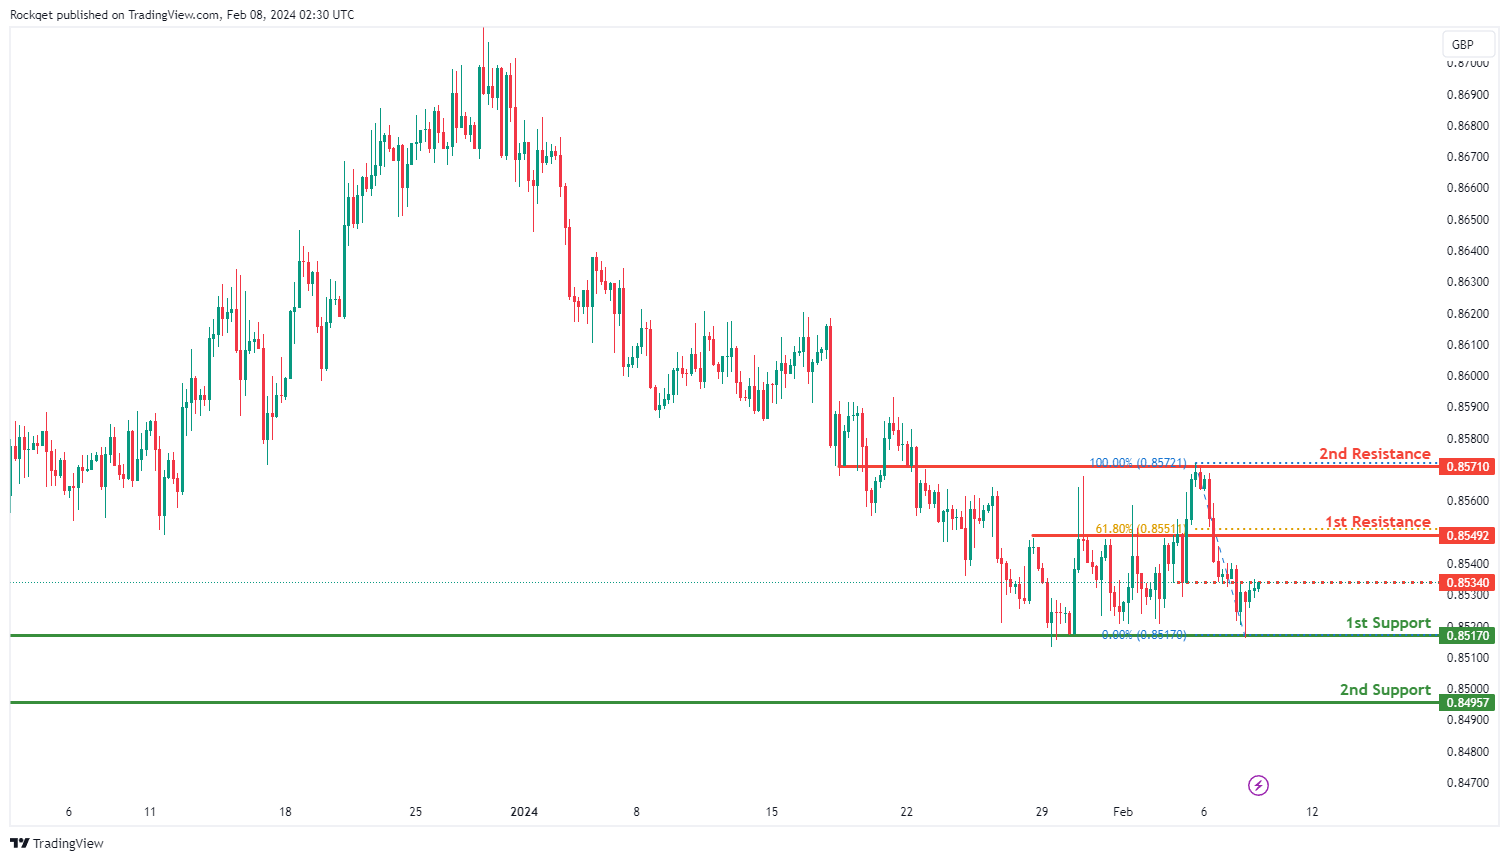
The EUR/GBP chart currently shows a weak bullish momentum with low confidence, suggesting a tentative upward movement. Despite the cautious sentiment, there are key levels that may influence price action.
The 1st support at 0.85170 is notable as it represents a multi-swing low support, indicating a level where buying interest has previously emerged.
Additionally, the 2nd support at 0.84957 is recognized as an overlap support, further reinforcing its significance as a potential area of price support.
On the resistance side, the 1st resistance at 0.85492 is identified as a key level where selling pressure may arise, aligning with an overlap resistance and the 61.80% Fibonacci Retracement. This level could serve as a barrier to bullish momentum.
Furthermore, the 2nd resistance at 0.85710 is another noteworthy level, characterized by an overlap resistance. An intermediate resistance level at 0.85340 is also identified, representing another point where selling interest may intensify.
GBP/USD:
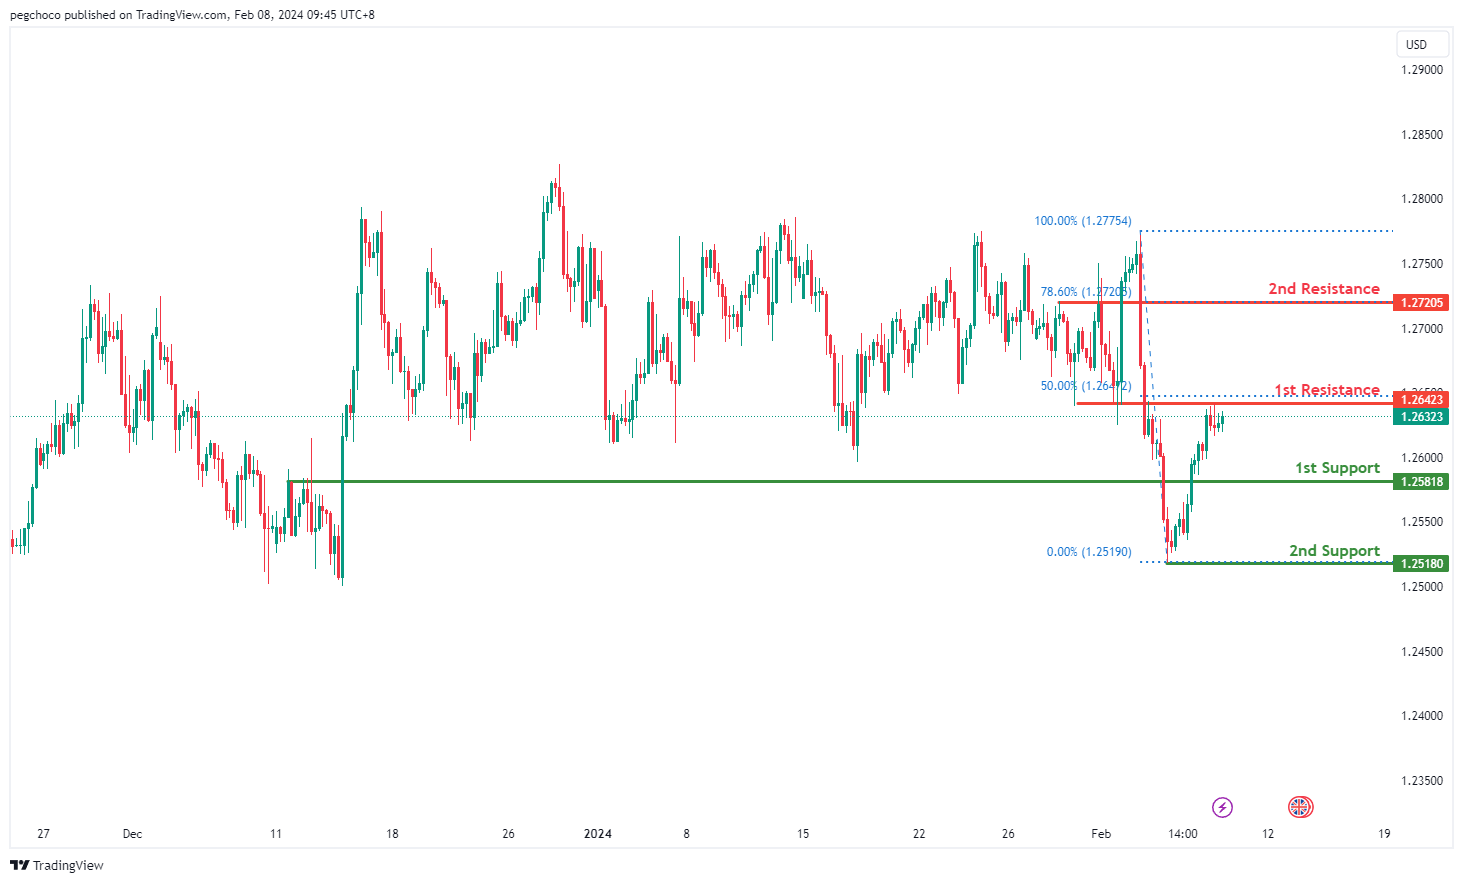
The GBP/USD chart currently indicates a bearish overall momentum, suggesting a downward trend. There’s a potential scenario where the price reacts bearishly off the 1st resistance level and declines towards the 1st support.
The 1st support level at 1.2581 is identified as a pullback support, indicating its significance as a potential area where buying interest could emerge.
Additionally, the 2nd support at 1.2518 is characterized as a swing low support, further reinforcing its importance as a potential support level.
On the resistance side, the 1st resistance level at 1.2642 is categorized as an overlap resistance, coinciding with the 50% Fibonacci Retracement, suggesting its historical significance as a potential barrier for further upward movement.
Furthermore, the 2nd resistance at 1.2720 is identified as a pullback resistance, aligning with the 78.60% Fibonacci Retracement, indicating its potential role in impeding further upward momentum.
GBP/JPY:
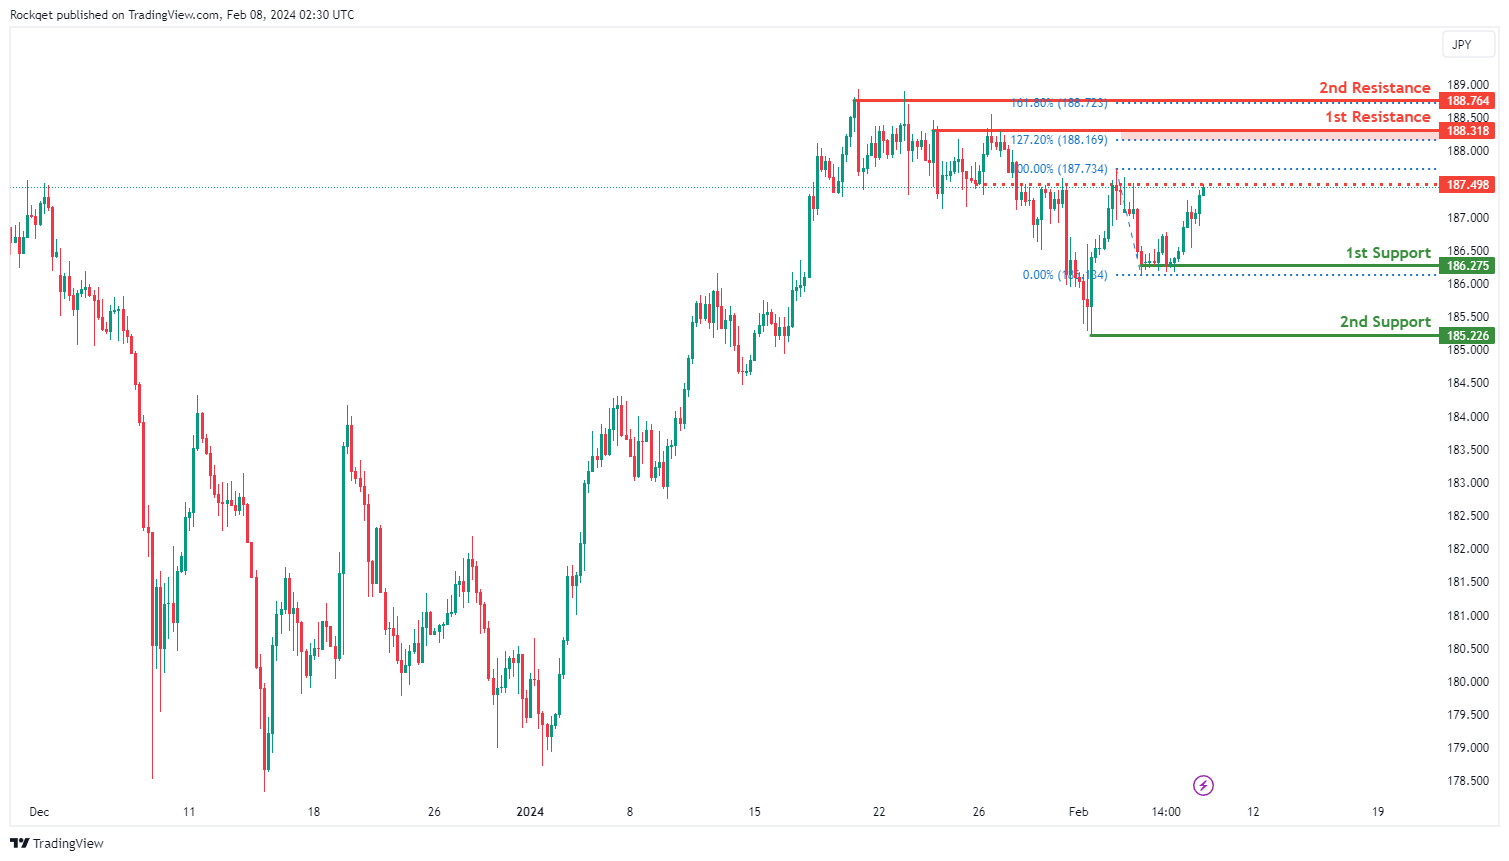
The GBP/JPY chart currently exhibits a bullish momentum, indicating a prevailing upward trend. Several key levels have been identified that could influence future price movements.
The 1st support level at 186.275 is significant as it represents a multi-swing low support, suggesting a strong historical level where buying interest has previously emerged.
Additionally, the 2nd support at 185.226 aligns with a swing low support, further reinforcing its potential as a level of price support.
On the resistance side, the 1st resistance at 188.318 is highlighted as a key level where selling pressure may intensify, coinciding with a pullback resistance and the 127.20% Fibonacci Extension. This level could act as a barrier to the bullish momentum.
Furthermore, the 2nd resistance at 188.764 represents a swing high resistance and aligns with the 161.80% Fibonacci Extension, adding further significance to this level. An intermediate resistance level at 187.50 is also identified, characterized by an overlap resistance.
USD/CHF:
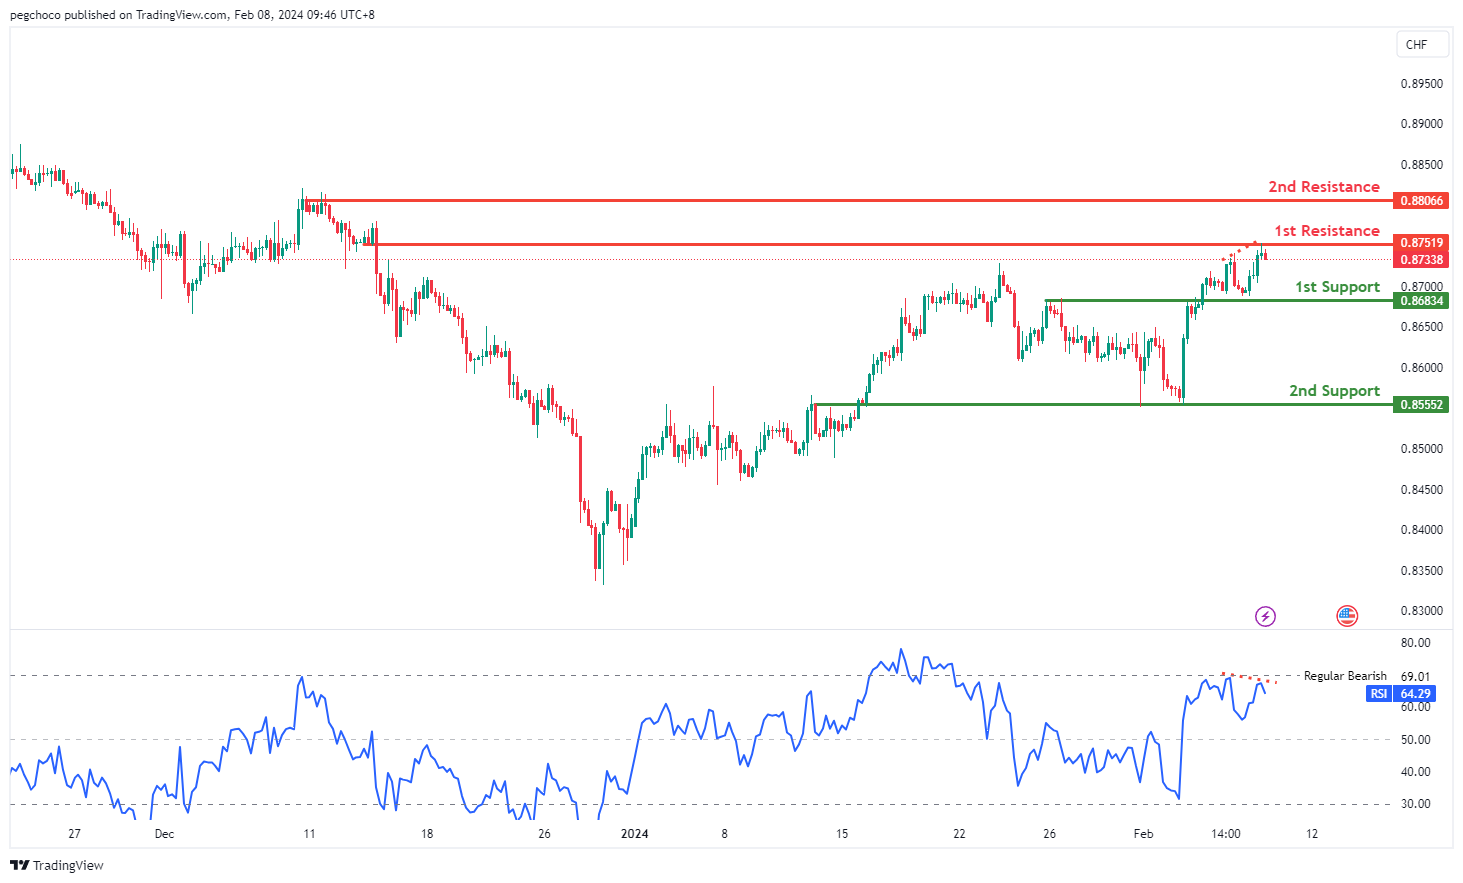
The USD/CHF chart currently demonstrates a bearish overall momentum, indicating a downward trend. There’s a possibility of a bearish reaction occurring at the 1st resistance level, leading to a decline towards the 1st support.
The 1st support level at 0.8683 is identified as an overlap support, suggesting its historical significance as a potential area where buying interest may emerge.
Similarly, the 2nd support at 0.8555 is characterized as another overlap support, further emphasizing its importance as a potential support zone.
On the resistance side, the 1st resistance level at 0.8751 is categorized as an overlap resistance, indicating its historical significance as a potential barrier for further upward movement.
Additionally, the 2nd resistance at 0.8806 is identified as a multi-swing high resistance, suggesting its role in impeding further upward momentum.
Moreover, the Relative Strength Index (RSI) is also displaying bearish divergence versus price, suggesting that a reversal might occur soon. This indicates a potential shift in momentum favoring further downward movement.
USD/JPY:
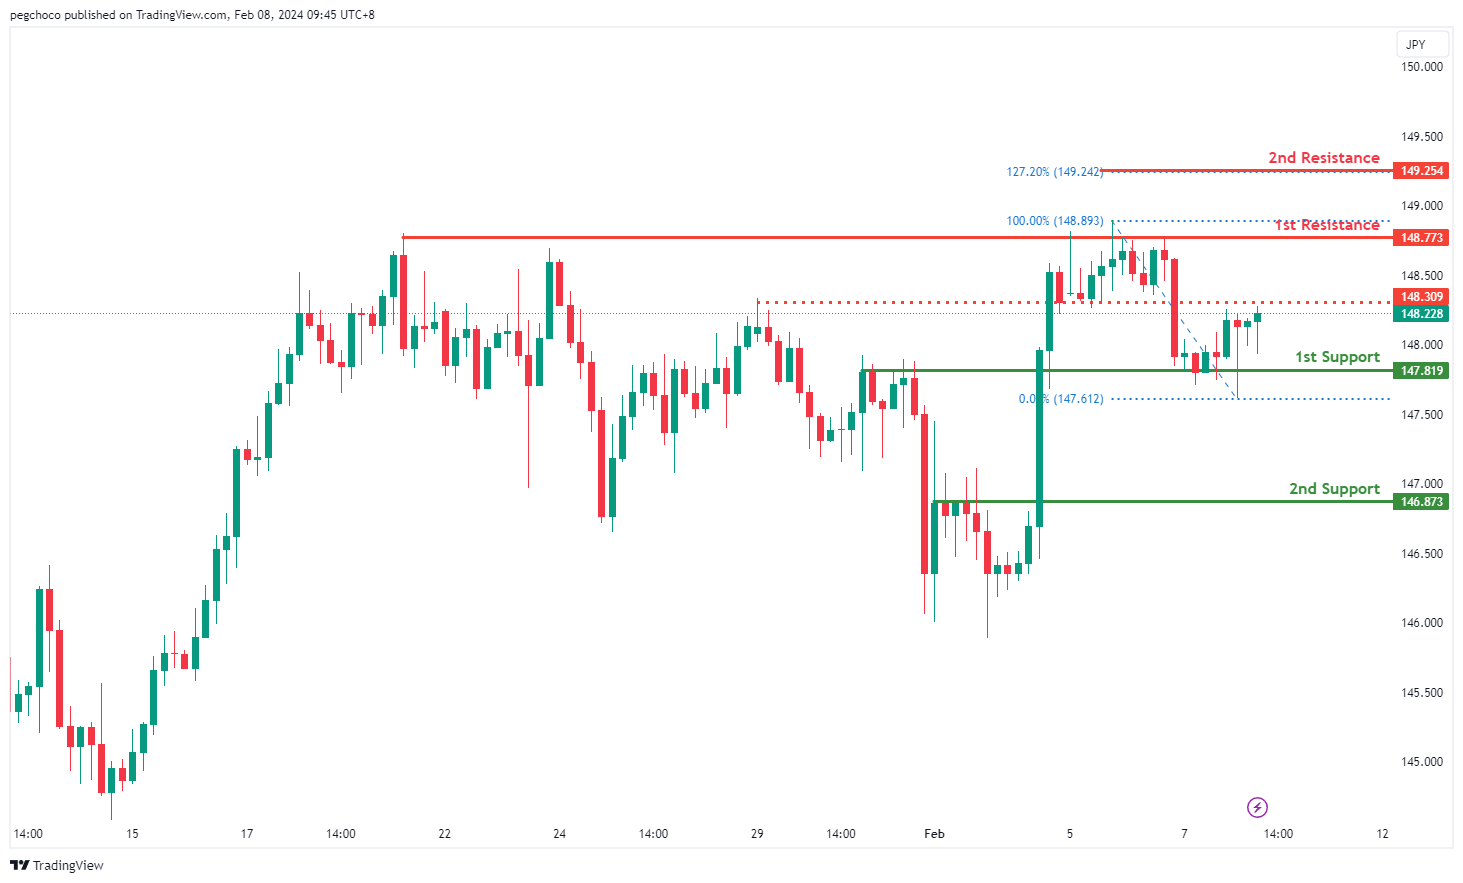
The USD/JPY chart currently indicates a bullish overall momentum, suggesting an upward trend. There’s a possibility of a bullish continuation towards the 1st resistance level.
The 1st support level at 147.81 is identified as an overlap support, indicating its historical significance as a potential area where buying interest may emerge.
Similarly, the 2nd support at 146.87 is characterized as a pullback support, reinforcing its importance as a level where buyers might step in.
On the resistance side, the 1st resistance level at 148.77 is categorized as a multi-swing high resistance, suggesting its historical significance as a barrier for further upward movement.
Additionally, the 2nd resistance level at 149.25 is identified based on the 127.20% Fibonacci Extension, indicating a potential area of resistance derived from Fibonacci analysis.
Moreover, the intermediate resistance at 148.30 is considered a pullback resistance, further adding to the potential barriers for upward movement.
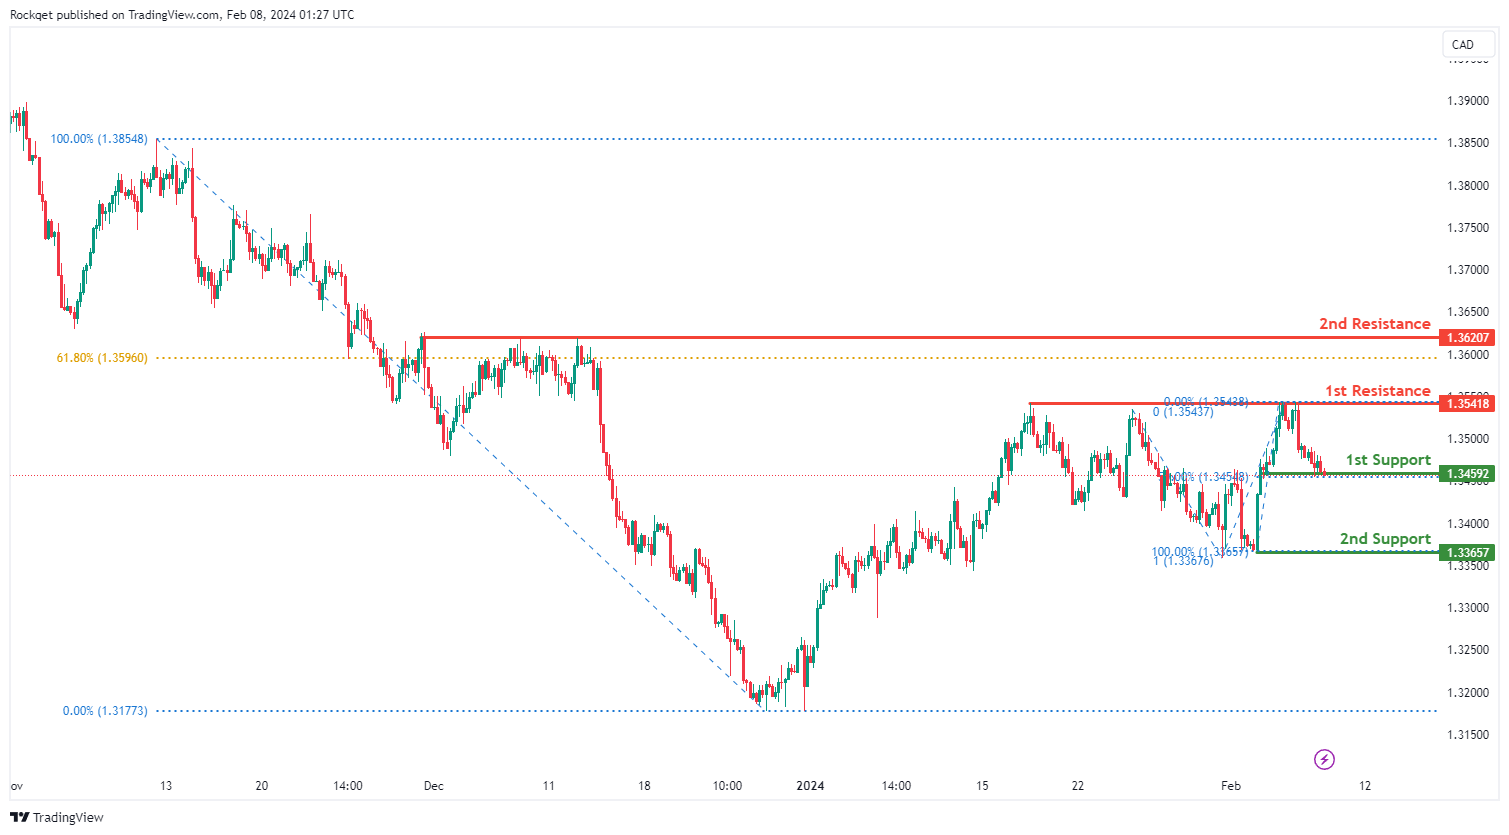
USD/CAD:
The USD/CAD chart currently exhibits an overall bearish momentum. In this context, there is a potential scenario for price to break bellow the 1st support and fall towards the 2nd support.
The 1st support level at 1.3459 is identified as a pullback support that aligns with the 50.00% Fibonacci Retracement level. Further below, the 2nd support level at 1.3365 is marked as a swing-low support that aligns with the 100.00% Fibonacci projection level, further emphasizing its importance as a potential support zone.
To the upside, the 1st resistance level at 1.3541 is identified as a pullback resistance. Higher up, the 2nd resistance level at 1.3620 is also noted as a pullback resistance that aligns close to the 61.80% Fibonacci Retracement level, further highlighting its importance as a potential resistance point.
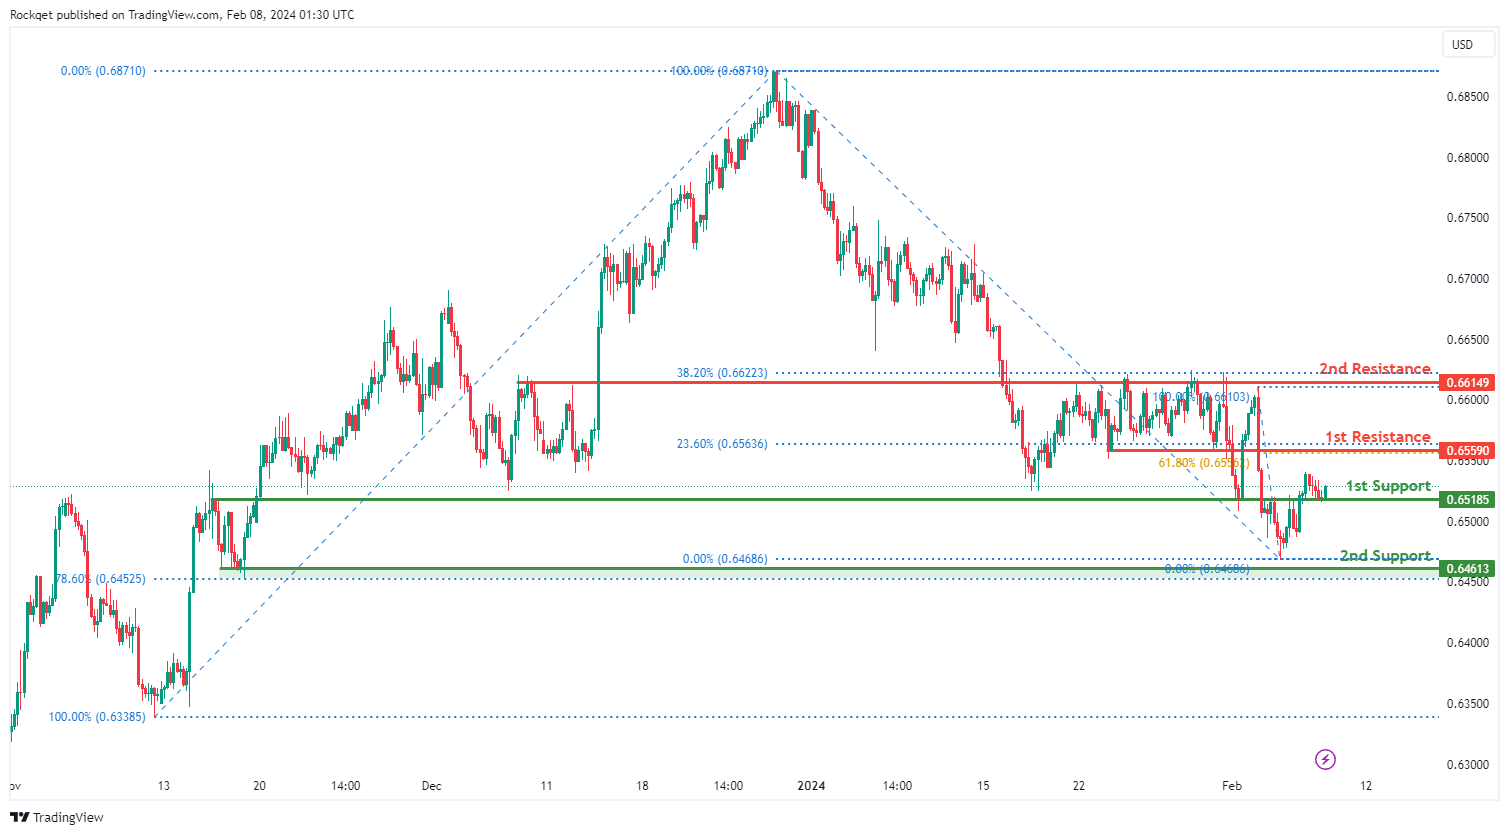
AUD/USD:
The AUD/USD chart currently exhibits an overall bullish momentum. In this context, there is a potential scenario for price to rise towards the 1st resistance.
The 1st resistance level at 0.6559 is identified as a pullback resistance that aligns with a confluence of Fibonacci levels i.e. the 23.60% and the 61.80% Retracement levels. Higher up, the 2nd resistance level at 0.6614 is also marked as a pullback resistance that aligns close to the 38.20% Fibonacci Retracement level, further highlighting its importance as a potential resistance point.
To the downside, the 1st support level at 0.6518 is identified as an overlap support. Further below, the 2nd support level at 0.6461 is noted as a pullback support that aligns close to the 78.60% Fibonacci Retracement level, further emphasizing its importance as a potential support zone.
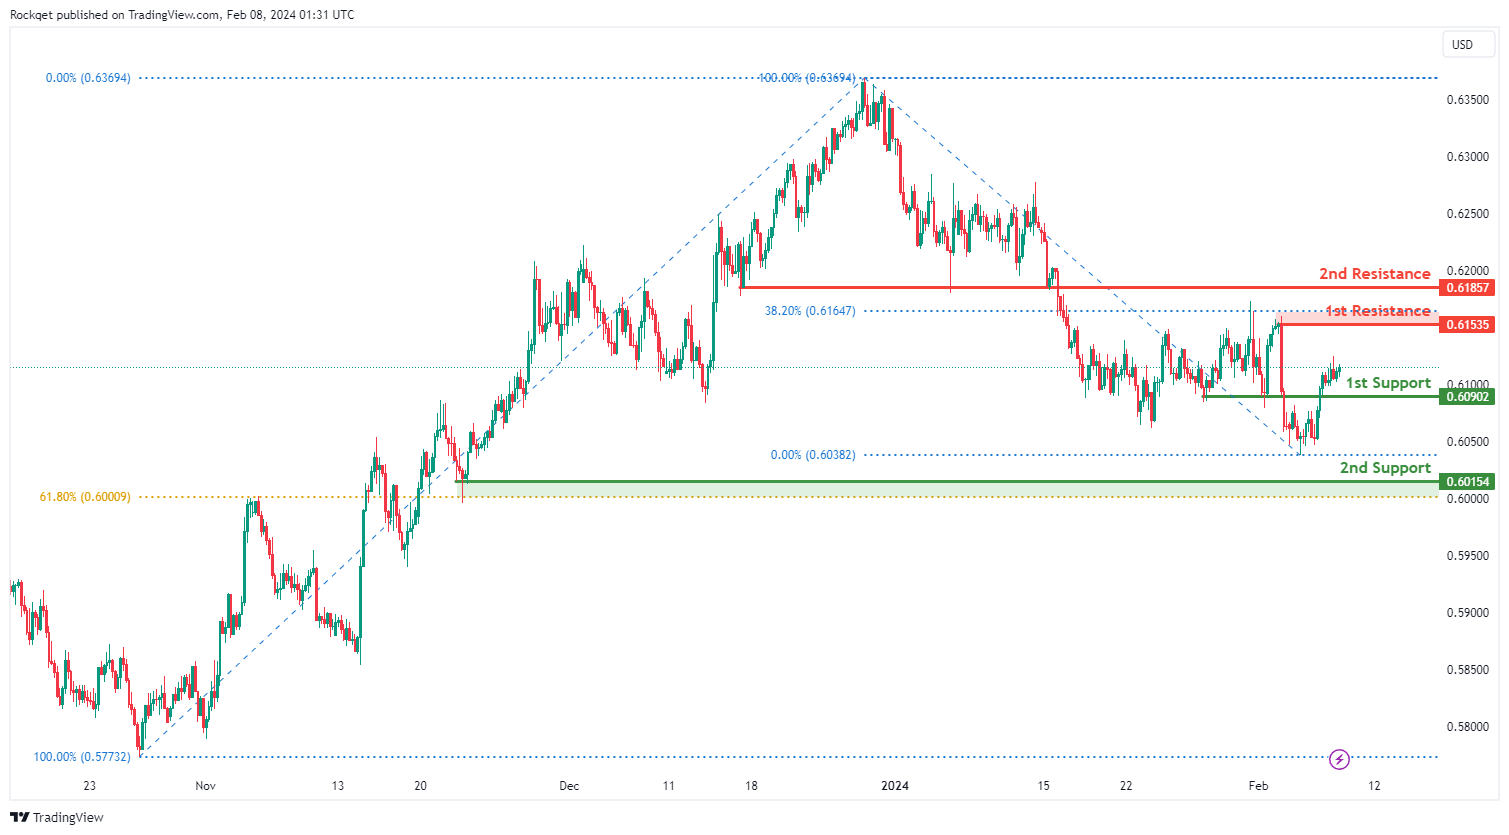
NZD/USD
The NZD/USD chart currently exhibits an overall bullish momentum. In this context, there is a potential scenario for price to rise towards the 1st resistance.
The 1st resistance level at 0.6153 is identified as a pullback resistance that aligns close to the 38.20% Fibonacci Retracement level. Higher up, the 2nd resistance level at 0.6185 is also marked as a pullback resistance, further highlighting its importance as a potential resistance point.
To the downside, the 1st support level at 0.6090 is identified as a pullback support. Further below, the 2nd support level at 0.6015 is also noted as a pullback support that aligns close to the 61.80% Fibonacci Retracement level, further emphasizing its importance as a potential support zone.
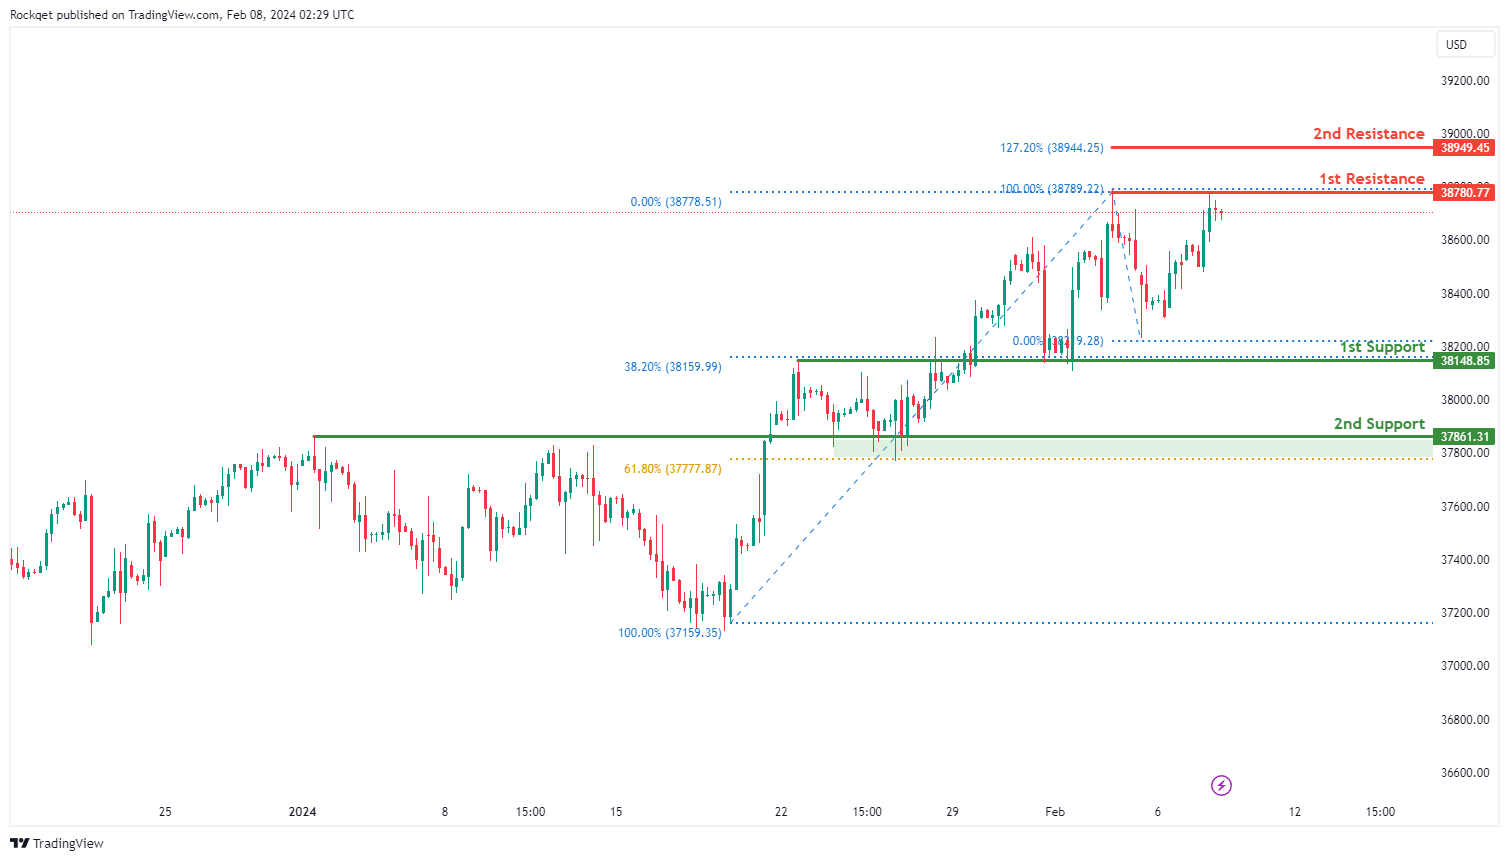
DJ30:
The DJ30 chart currently indicates a weak bearish momentum with low confidence, suggesting a tentative downward trend. Several key levels have been identified that could influence future price movements.
The 1st support level at 38,148.85 is significant as it represents an overlap support and coincides with the 38.20% Fibonacci Retracement, indicating a historical level where buying interest has previously emerged.
Additionally, the 2nd support at 37,861.31 aligns with an overlap support and the 61.80% Fibonacci Retracement, further reinforcing its potential as a level of price support.
On the resistance side, the 1st resistance at 38,780.77 is highlighted as a key level where selling pressure may intensify, representing a swing high resistance.
Furthermore, the 2nd resistance at 38,949.45 suggests a significant level of resistance, coinciding with the 127.20% Fibonacci Extension.
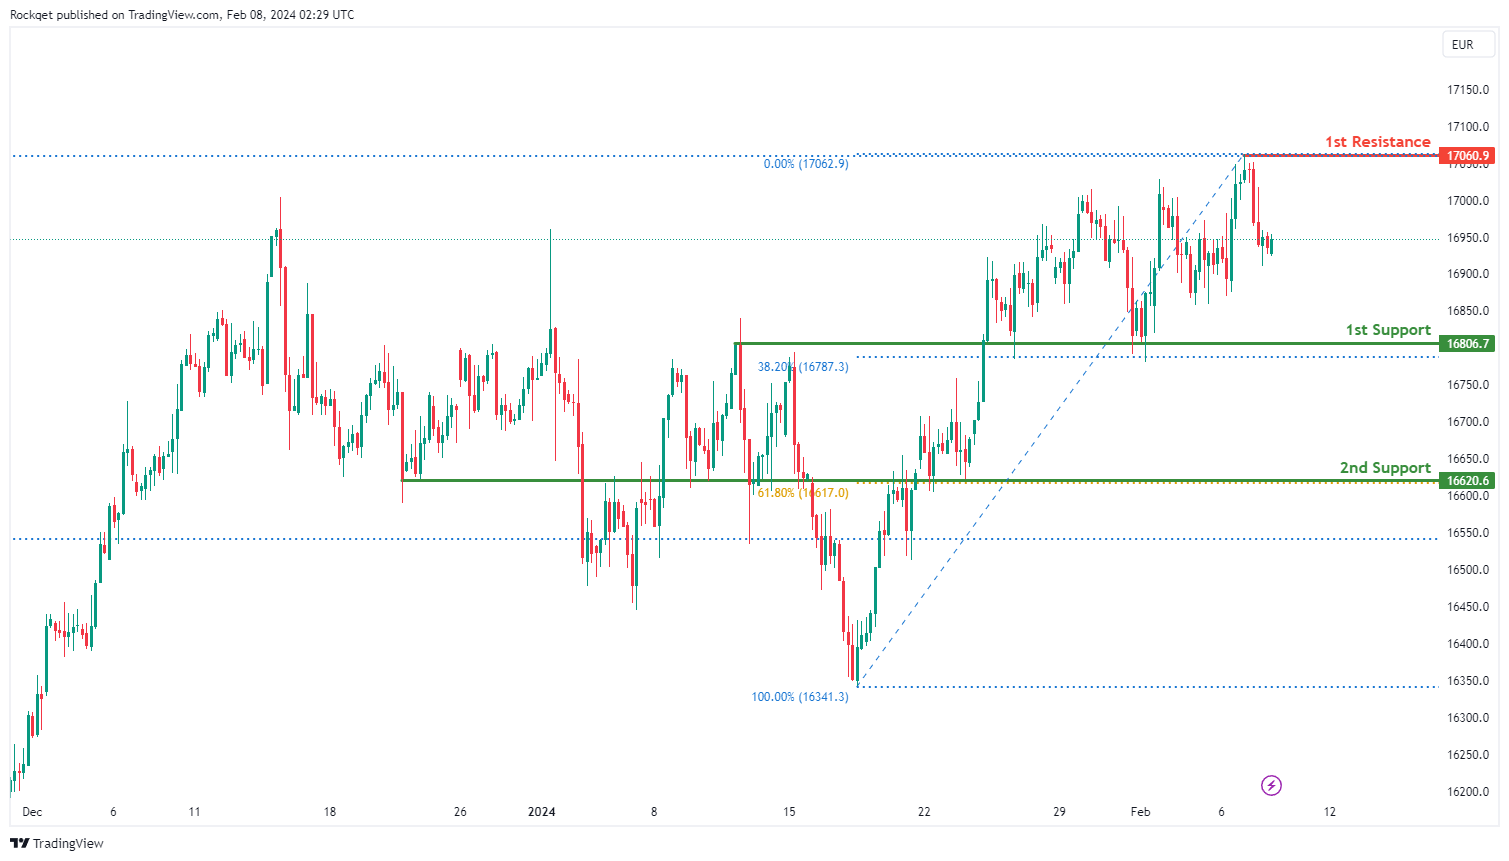
GER40:
The GER40 chart currently exhibits a bearish momentum, indicating a prevailing downward trend. Several factors contribute to this bearish sentiment, suggesting the potential for continued downward movement in the price.
The 1st support level at 16,806.7 is significant as it represents an overlap support and coincides with the 38.20% Fibonacci Retracement, indicating a historical level where buying interest has previously emerged.
Additionally, the 2nd support at 16,620.6 aligns with an overlap support and the 61.80% Fibonacci Retracement, adding further strength to the potential support zone.
On the resistance side, the 1st resistance at 17,060.9 is highlighted as a significant level where selling pressure may intensify, representing a swing high resistance. Furthermore, this level coincides with the 127.20% Fibonacci Extension, adding additional significance to this resistance level.
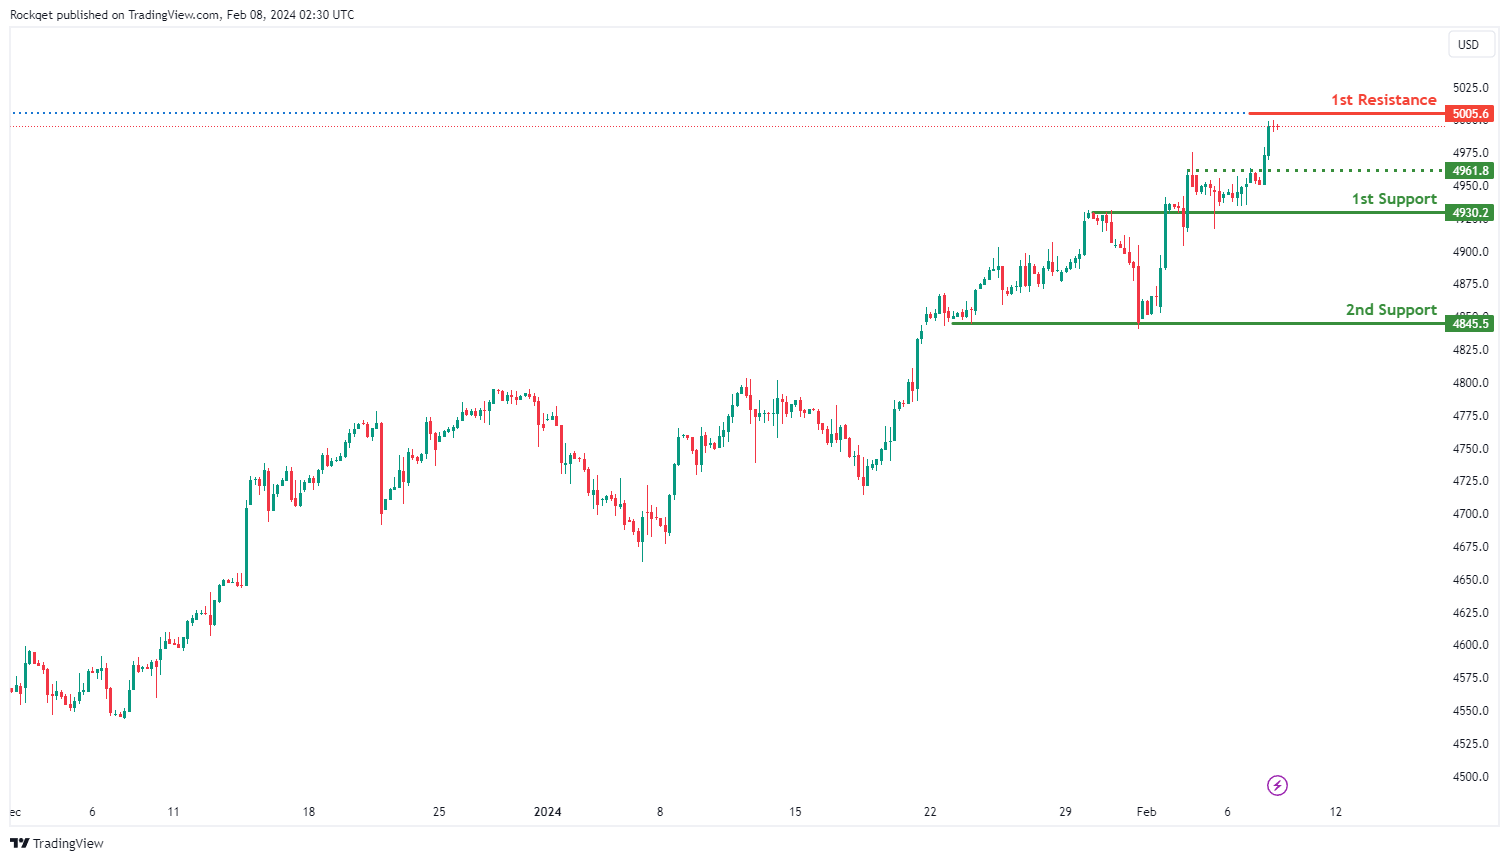
US500:
The US500 chart currently demonstrates a bullish overall momentum, indicating a prevailing upward trend. Multiple factors contribute to this bullish sentiment, supporting the potential for sustained upward movement in the price.
The 1st support level at 4930.2 is considered significant as it represents an overlap support and coincides with the 50% Fibonacci Retracement, indicating a historical level where buying interest has previously emerged.
Additionally, the 2nd support at 4845.5 is a swing low support, further strengthening the potential support zone.
An intermediate support level at 4961.8 is identified, aligning with a pullback support, providing additional reinforcement to the bullish scenario.
On the resistance side, the 1st resistance at 5005.6 is highlighted as a significant level where selling pressure may intensify. This resistance level corresponds to the 78.60% Fibonacci Projection, adding further significance to this resistance level.
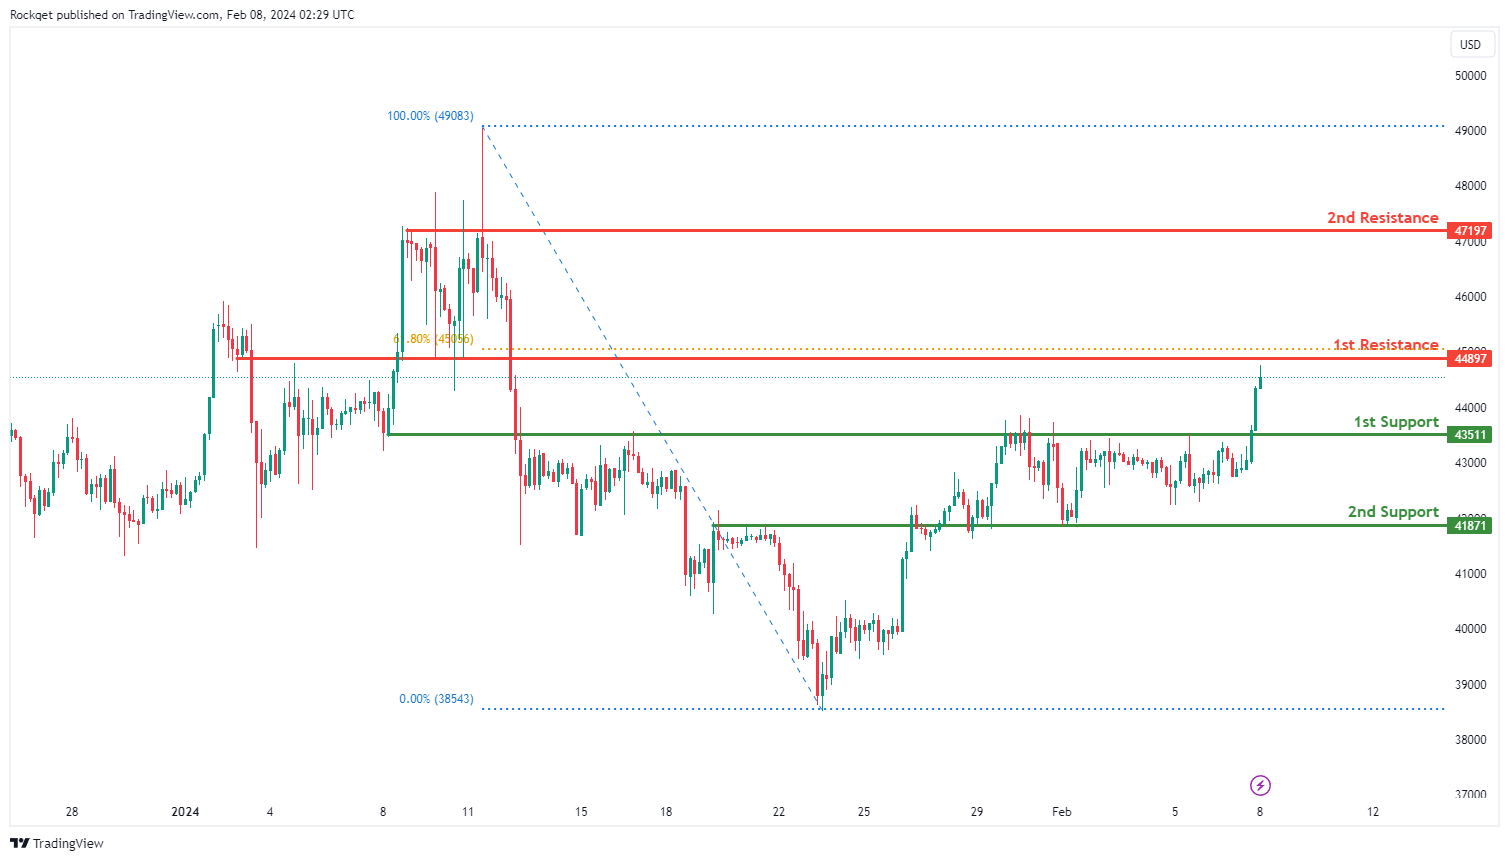
BTC/USD:
The BTC/USD chart currently exhibits a bullish overall momentum, suggesting a prevailing upward trend. Several factors contribute to this bullish sentiment, supporting the potential for continued upward movement in the price.
The 1st support level at 43511 is identified as an overlap support, indicating a historical level where buying interest has previously emerged.
Additionally, the 2nd support at 41871 reinforces the potential support zone as another overlap support.
On the resistance side, the 1st resistance at 44897 is highlighted as a significant level where selling pressure may intensify. This resistance level also aligns with the 61.80% Fibonacci Retracement, adding further significance to its potential as a barrier to the bullish momentum.
Furthermore, the 2nd resistance at 47197 is recognized as a multi-swing high resistance level, indicating a historically significant obstacle to price movement.
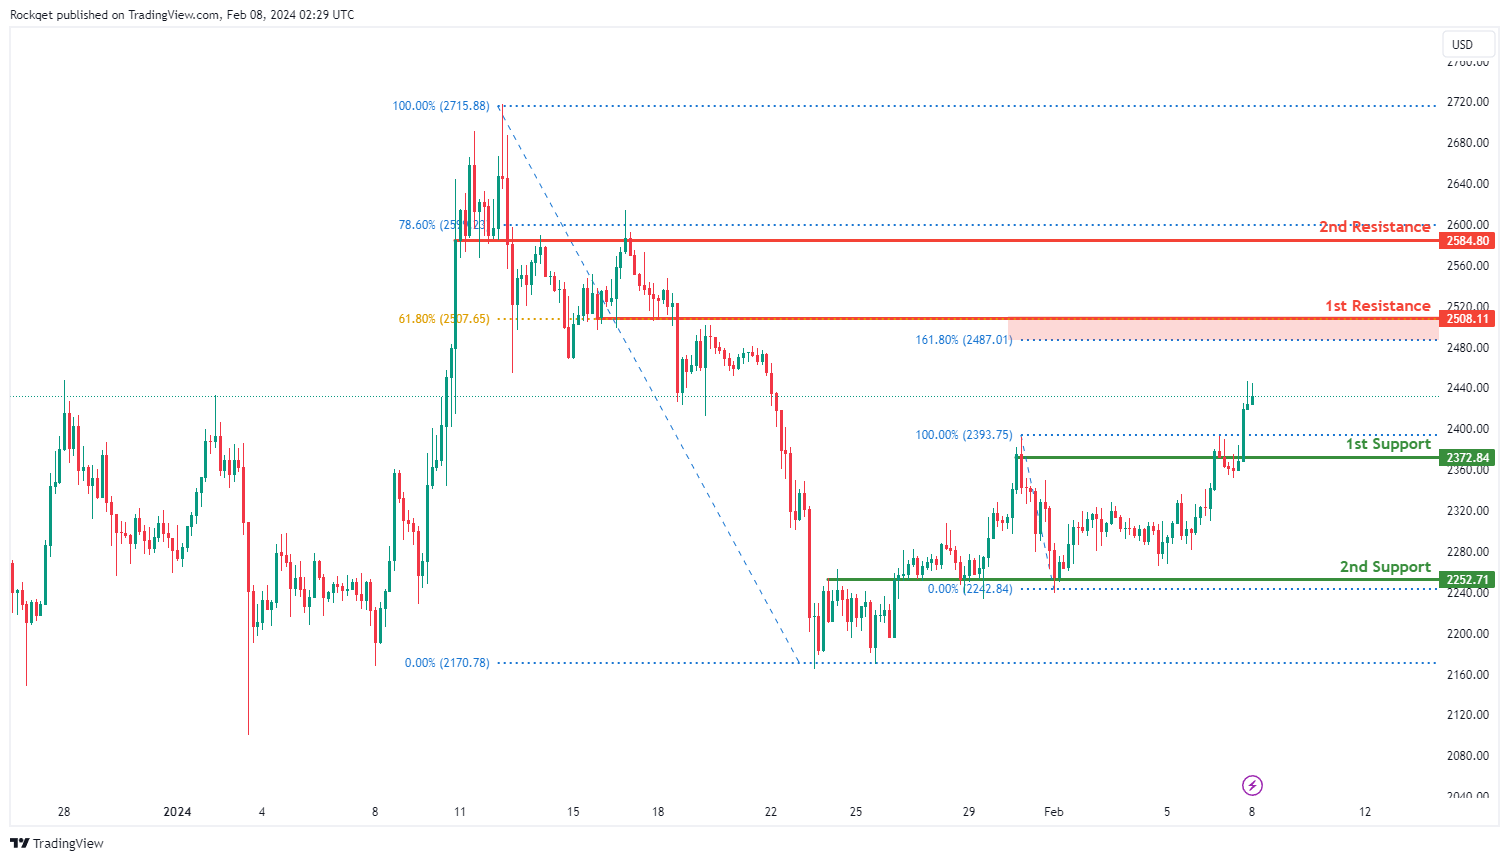
ETH/USD:
The ETH/USD chart currently demonstrates a bullish overall momentum, indicating a prevailing upward trend. Several factors contribute to this bullish sentiment, supporting the potential for continued upward movement in the price.
The 1st support level at 2372.84 is recognized as an overlap support, indicating a historical level where buying interest has previously emerged. Additionally, the 2nd support at 2252.71 reinforces the potential support zone as another overlap support.
On the resistance side, the 1st resistance at 2508.11 is highlighted as a significant level where selling pressure may intensify. This resistance level aligns with the 61.80% Fibonacci Retracement and the 161.80% Fibonacci Extension, adding further significance to its potential as a barrier to the bullish momentum.
Furthermore, the 2nd resistance at 2584.80 is recognized as an overlap resistance, coinciding with the 78.60% Fibonacci Retracement, reinforcing its importance as a resistance level.
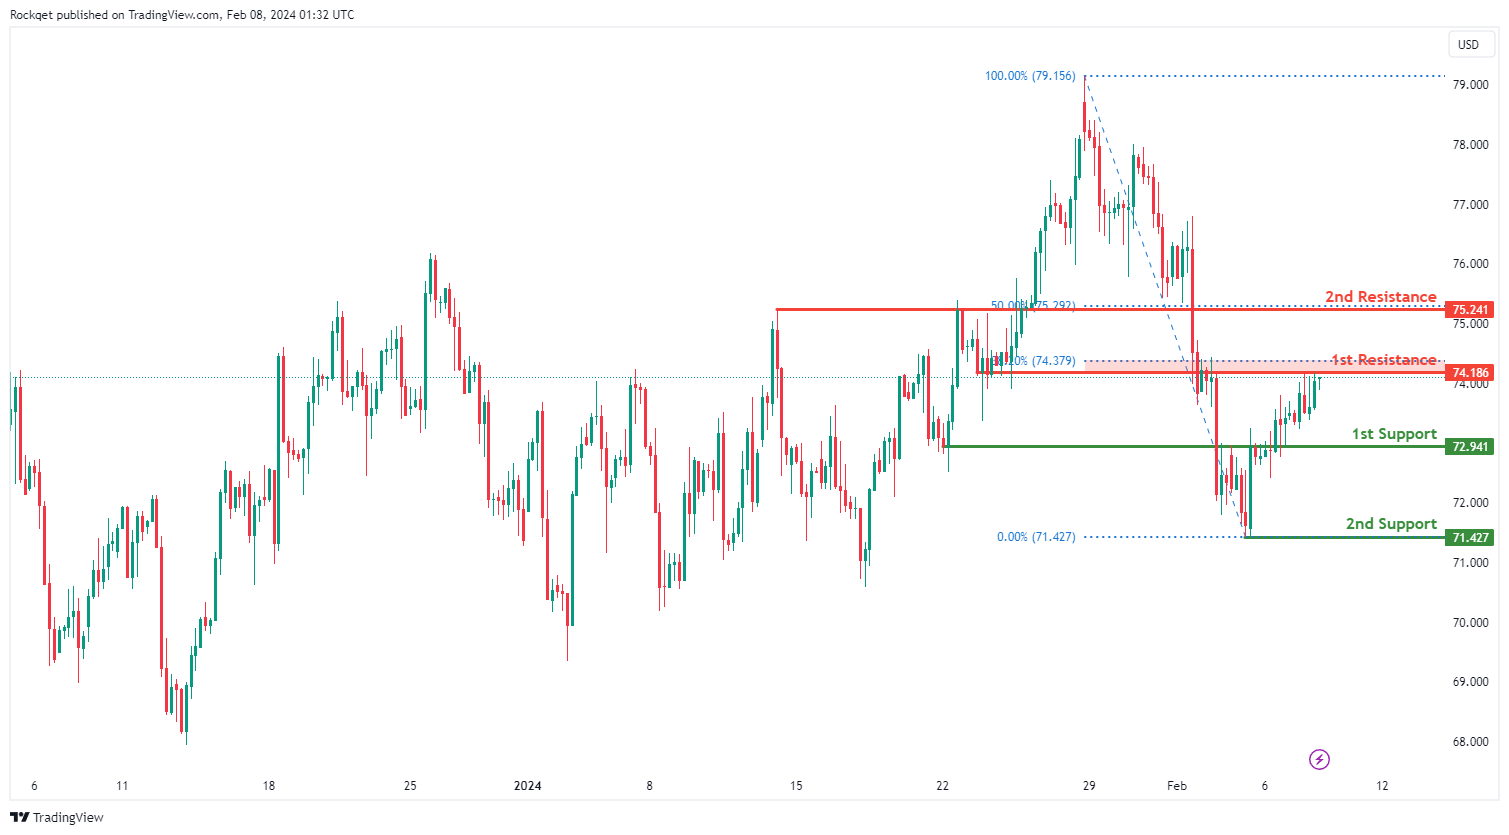
WTI/USD:
The WTI (West Texas Intermediate) chart currently exhibits an overall bullish momentum. In this context, there is a potential scenario for price to rise towards the 1st resistance.
The 1st resistance level at 74.18 is identified as an overlap resistance that aligns close to the 38.20% Fibonacci Retracement level. Higher up, the 2nd resistance level at 75.24 is marked as a pullback resistance that aligns with the 50.00% Fibonacci Retracement level, further highlighting its importance as a potential resistance zone.
To the downside, the 1st support level at 72.94 is identified as an overlap support. Further below, the 2nd support level at 71.42 is identified as a pullback support, reinforcing its significance as a key support level.
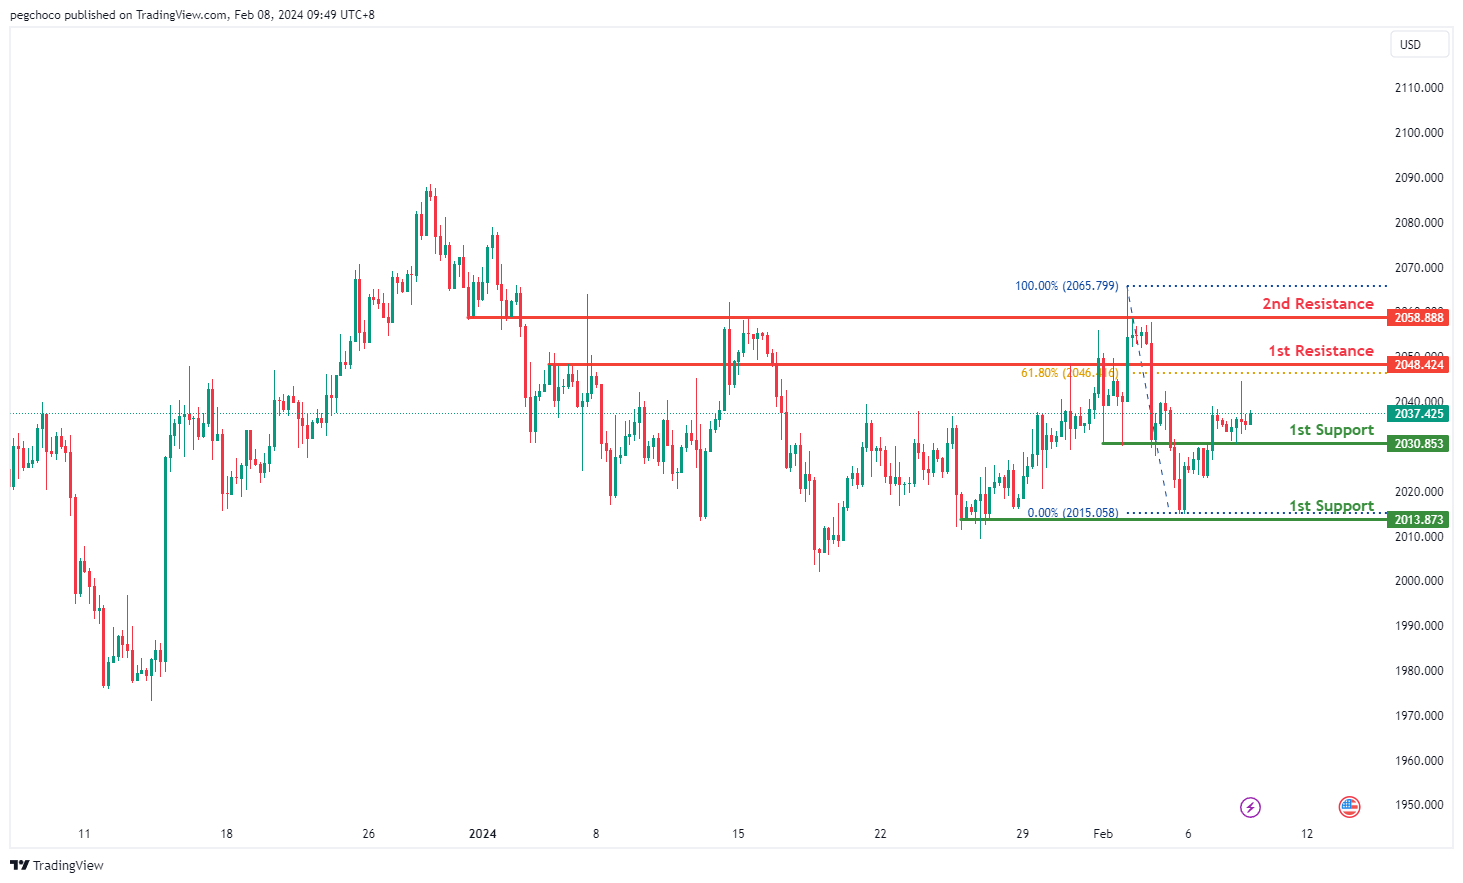
XAU/USD (GOLD):
The XAUUSD chart currently demonstrates bullish momentum, indicating an upward trend. There’s a potential for a bullish continuation towards the 1st resistance level.
The 1st support level at 2030.85 is identified as an overlap support, suggesting its historical significance as a level where buying interest may emerge.
Similarly, the 2nd support at 2013.87 is characterized as a multi-swing low support, reinforcing its importance as a level where buyers might enter the market.
On the resistance side, the 1st resistance level at 2048.42 is categorized as a pullback resistance, indicating its historical significance as a barrier for further upward movement. This level aligns with the 61.80% Fibonacci Retracement, adding to its significance.
Additionally, the 2nd resistance level at 2058.88 is identified as an overlap resistance, further adding to its potential as a barrier for further upside movement.
The accuracy, completeness and timeliness of the information contained on this site cannot be guaranteed. IC Markets does not warranty, guarantee or make any representations, or assume any liability regarding financial results based on the use of the information in the site.
News, views, opinions, recommendations and other information obtained from sources outside of www.icmarkets.com, used in this site are believed to be reliable, but we cannot guarantee their accuracy or completeness. All such information is subject to change at any time without notice. IC Markets assumes no responsibility for the content of any linked site.
The fact that such links may exist does not indicate approval or endorsement of any material contained on any linked site. IC Markets is not liable for any harm caused by the transmission, through accessing the services or information on this site, of a computer virus, or other computer code or programming device that might be used to access, delete, damage, disable, disrupt or otherwise impede in any manner, the operation of the site or of any user’s software, hardware, data or property.


