
Key risk events today:
Limited.
EUR/USD:
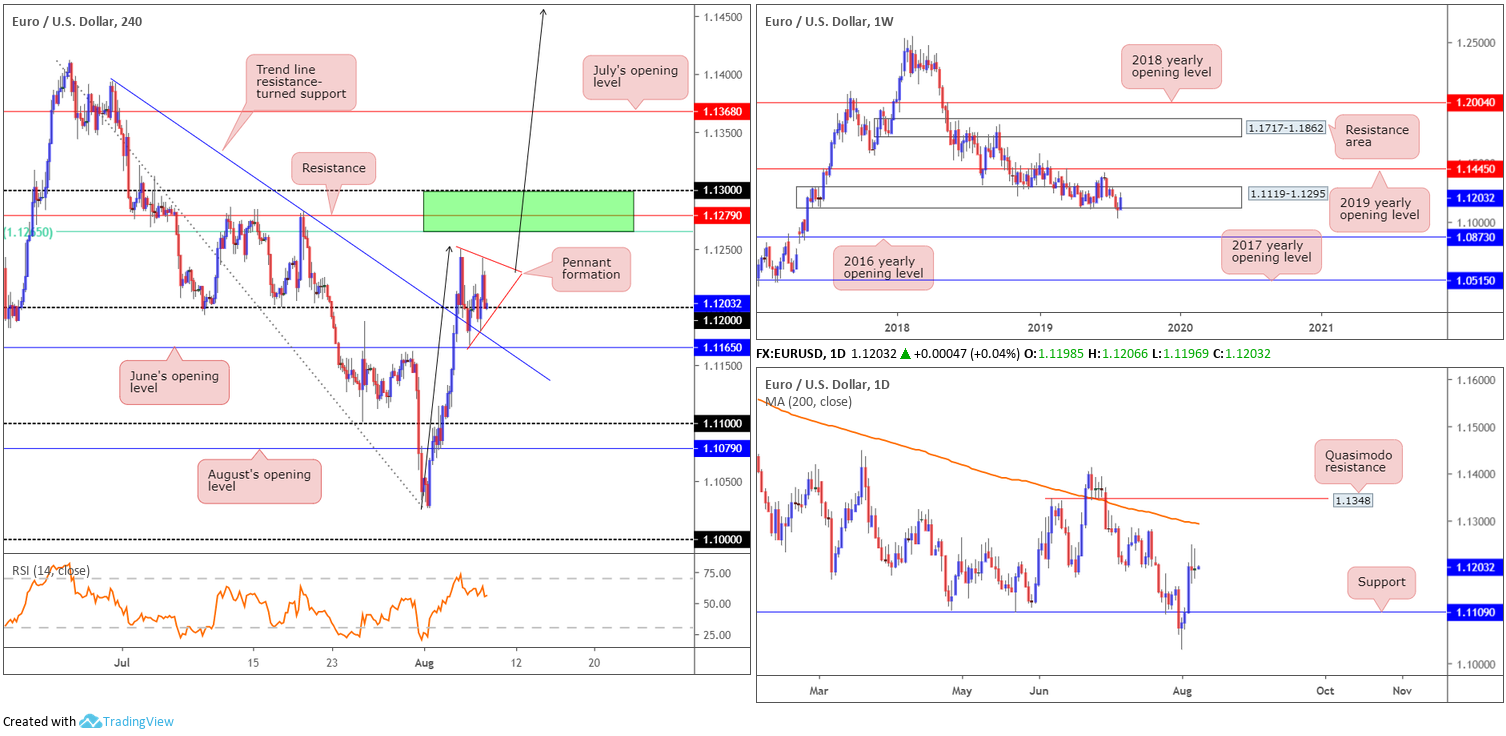
Since Tuesday, the H4 candles have been busy carving out the initial stages of a bullish pennant formation (1.1249/1.1167), using both trend line resistance-turned support (extended from the high 1.1393) and the round number 1.12 as its floor. The price target for these patterns calculates by taking the distance from the beginning of the sharp move that preceded the pattern and then adding this to the breakout price (see black arrows for a rough estimation). Note should this pattern complete its upside objective, price action will be shaking hands with weekly resistance at 1.1445: the 2019 yearly opening level.
Before reaching the said weekly base, though, considerable resistances are in sight. On the H4 timeframe an area of resistance lies ahead at 1.13/1.1265 (green – comprised of resistance at 1.1279, the 1.13 handle and a 61.8% Fibonacci resistance value at 1.1265). What’s also notable from a technical perspective is the 200-day SMA (orange) merges with the upper edge of the said H4 zone, currently circulating around the 1.1292 level.
Areas of consideration:
As highlighted in Wednesday’s report, assuming the candles remain above 1.12, longs could still be the order of the day, targeting the green H4 resistance area mentioned above at 1.13/1.1265. Ideally, a long on a retest of 1.12 is eyed, formed in the shape of a H4 bullish candlestick configuration (entry/risk can be determined according to its framework).
Traders can also expect sellers to make an appearance within the green H4 zone at 1.13/1.1265. Whether this is sufficient to send prices back to 1.12 is difficult to judge, given weekly price trades inside demand at 1.1119-1.1295 and H4 buyers will likely pushing for the pennant pattern’s completion. For that reason, it’s worth seeing if H4 price chalks up some form of bearish candlestick signal before committing funds.
GBP/USD:
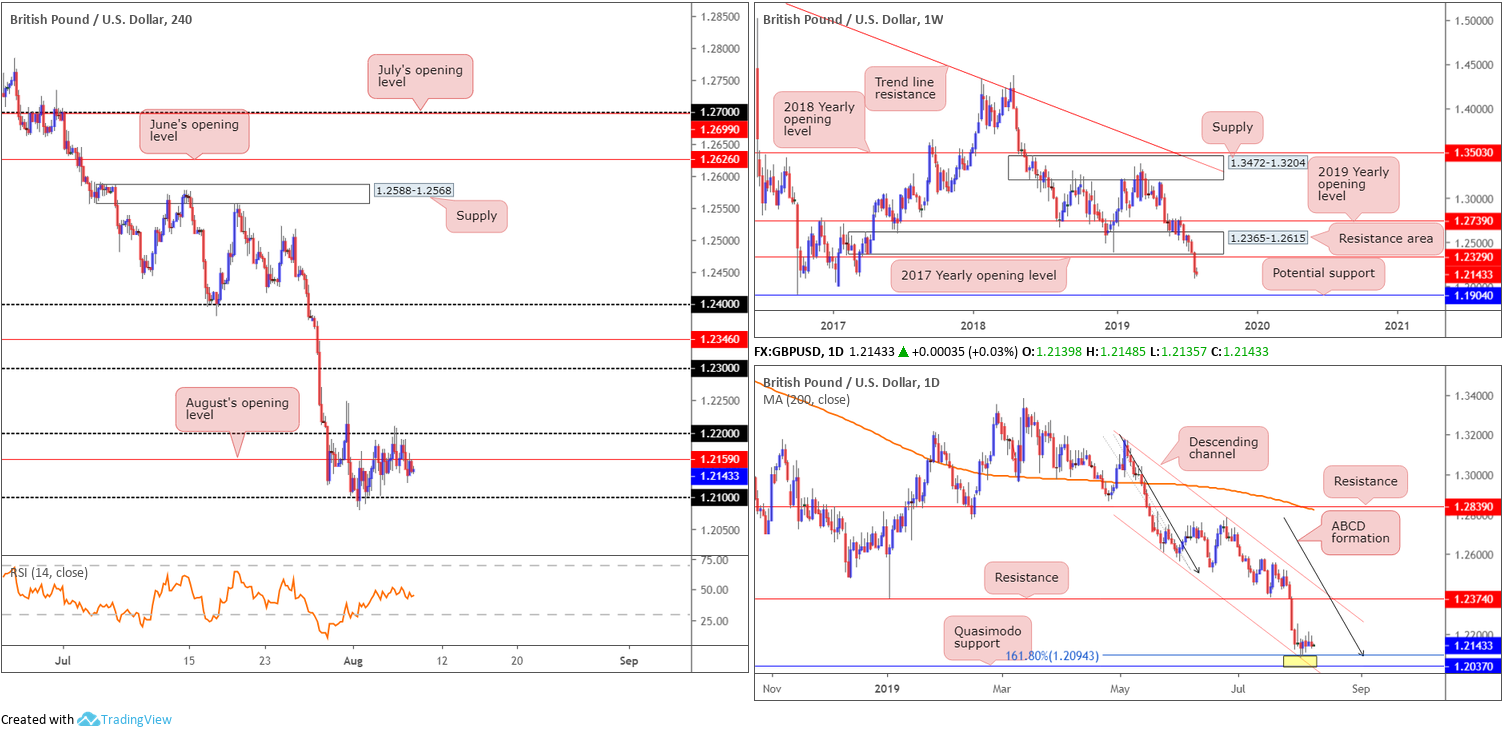
Since the beginning of the month, the British pound has underscored a somewhat subdued tone vs. its US counterpart, consolidating between 1.21/1.22 on the H4 timeframe. Traders may also wish to acknowledge the RSI indicator touching the underside of its mid-point value (50.0) and between the two round numbers we have August’s opening level situated at 1.2159.
Higher-timeframe flow remains unchanged since Monday’s weekly report:
From the weekly timeframe:
Since retesting the underside of the 2019 yearly opening level at 1.2739 in May, the British pound has been grinding lower against its US counterpart. Tunnelling through bids residing within long-standing demand at 1.2365-1.2615 and eventually overthrowing the 2017 yearly opening level at 1.2329, longer-term flow is exposed to further downside this week, targeting potential support from 1.1904: a standout low clocked in early October 2016.
The daily timeframe:
Contrary to the weekly timeframe’s estimation, daily movement is bottoming around the top edge of a rather interesting support zone between 1.2037/1.2094. Comprised of a 161.8% ABCD (black arrows) pattern at 1.2094, a channel support extended from the low 1.2605 and a Quasimodo support at 1.2037, does this area possess enough oomph to send price towards resistance at 1.2374 this week?
Areas of consideration:
Having observed limited change over the past week, much of the following echoes thoughts aired in previous reports.
Weekly price portends further downside this week, while daily price reveals a clear-cut support area at 1.2037/1.2094. In cases such as this, it’s always best to plot the H4 position for directional cues. For example, a break of 1.22 to the upside confirms bullish strength not only on the H4 timeframe, but also on the daily timeframe, and, therefore, may make a run to 1.23. As such, a long entry either on the breakout or retest at 1.22 is an option.
A break of 1.21, nonetheless, implies weakness within the daily support area and strength on the weekly timeframe. This implies a possible run towards 1.1904 on the weekly scale.
For traders still long from 1.21, specifically the H4 bullish engulfing candle, there’s little you can do at the moment except wait for a move to take shape. Ultimately, you’ll need a H4 close above 1.22 before reducing risk to breakeven.
AUD/USD:
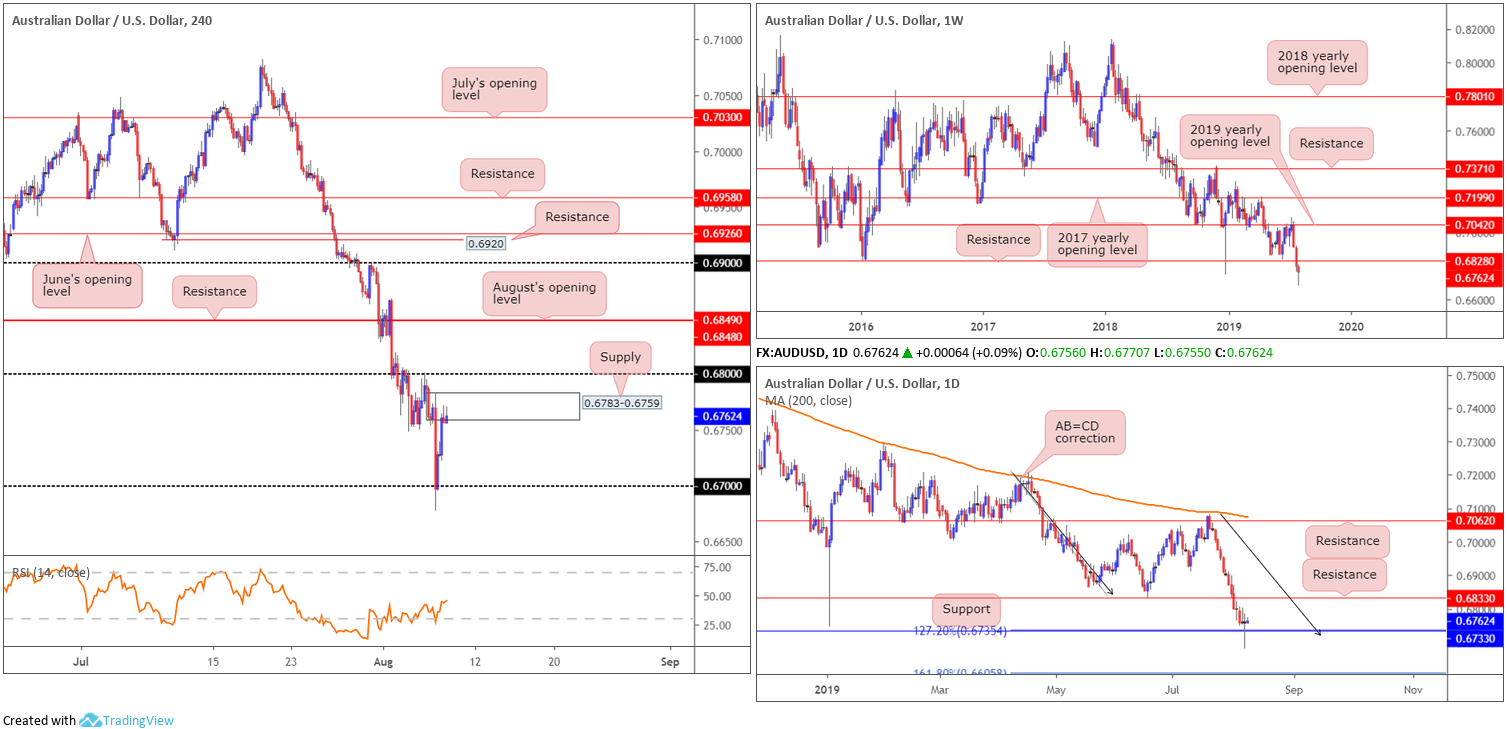
In the early hours of Wednesday’s session, the Australian dollar clocked fresh YTD lows of 0.6677 following the surprise decision by the RBNZ to cut interest rates by 0.5% to 1%. The move, as can be seen from the H4 timeframe, tripped sell stops beneath the 0.67 handle, though swiftly recovered a large portion of losses during London/US and concluded the day challenging newly formed H4 supply at 0.6783-0.6759. Directly overhead, the research team notes potential resistance at 0.68, with thin air above here until reaching August’s opening level/resistance at 0.6849/0.6848.
On a wider perspective, weekly price as highlighted in Wednesday’s briefing, remains languishing beneath notable support at 0.6828 (now potentially serving as resistance), extending the pullback from the 2019 yearly opening level (resistance) at 0.7042. The next support is not visible until 0.6395 on this timeframe (not seen on the screen).
Contrary to weekly action, the daily candles recently shook hands with notable support coming in at 0.6733, which happens to merge with a 127.2% AB=CD (black arrows) formation at 0.6735. Note this level, despite suffering a sizable breach, held ground into the closing bell.
Areas of consideration:
For those who shorted this market from the underside of 0.68 (a noted setup to watch for in previous reports), both take-profit targets were hit yesterday: daily support at 0.6733 and the round number 0.67 on the H4 timeframe.
As of current price, the H4 candles are chalking up back-to-back shooting star patterns at the underside of the H4 supply mentioned at 0.6783-0.6759. Whether this area holds, however, is difficult to decipher as not only are we coming off daily support at 0.6733, the round number 0.68 is likely to act as a magnet to price.
An area worth keeping an eye on for potential shorts, though may not enter the mix today, is August’s opening level/resistance at 0.6849/0.6848 on the H4 timeframe. This base is supported by daily resistance plotted close by at 0.6833 and weekly resistance at 0.6828.
USD/JPY:
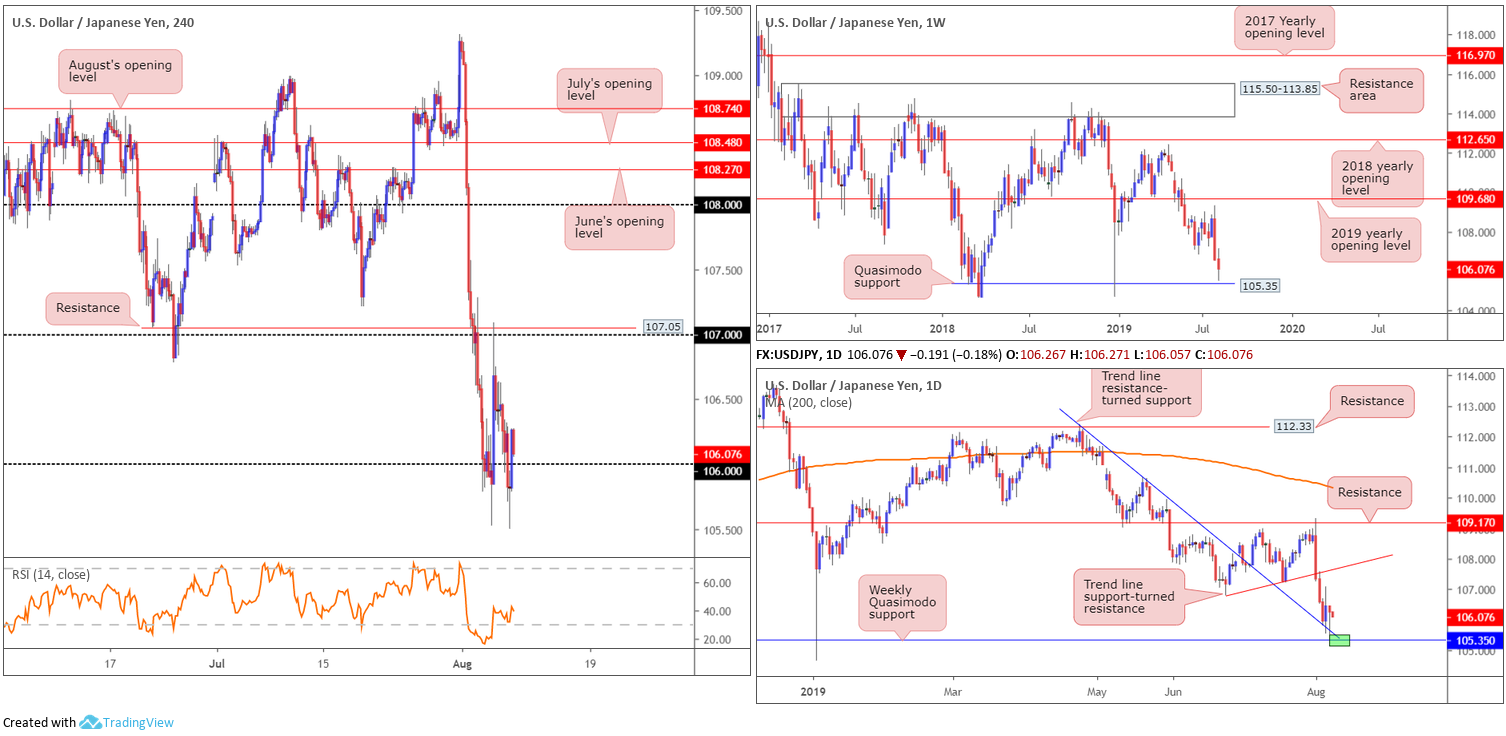
Though slumping to its lowest level since early January at 105.49 and tearing through sell stops beneath 106, the pair, alongside US equities, staged a modest recovery amid US hours Wednesday and reclaimed 106+ status into the close. Beyond 106, limited support on the H4 scale is visible until connecting with 105.
On more of a broader perspective, weekly price remains hovering just north of a Quasimodo support at 105.35. Note this level already proved some worth by holding the unit higher at the beginning of the year. Daily movement, on the other hand, recently crossed swords with trend line resistance-turned support (extended from the high 112.40) and produced a bullish engulfing candlestick signal. This, as is evident from the chart, followed up with a hammer candlestick signal (another bullish signal) Wednesday. Follow-through buying from here has trend line support-turned resistance (taken from the low 106.78) to target.
Areas of consideration:
Selling beyond 106 is certainly a possibility according to the weekly timeframe, though daily price defending its trend line resistance-turned support may hamper downside somewhat.
While the market may explore higher ground off the said daily support, drawing in buyers from the aforementioned weekly Quasimodo support is still a reasonable possibility, even more so seeing as how the daily trend line support now merges beautifully with the weekly level (green zone on daily timeframe). Therefore, the research team feels its best to hold fire and wait for weekly support to enter the mix before considering a long in this market.
USD/CAD:
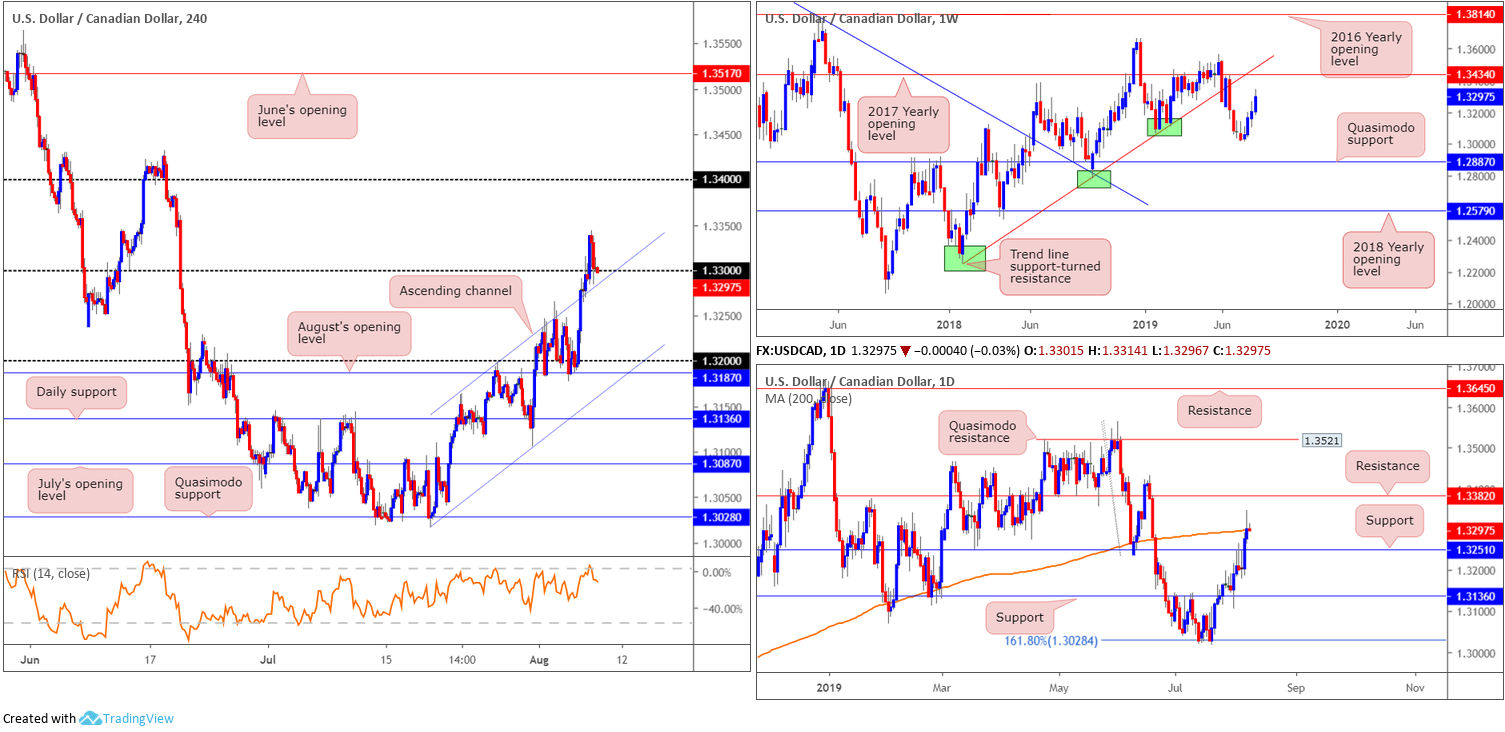
The US dollar nudged higher against the Canadian dollar Wednesday for a second consecutive day, adding 0.18%. Amid declining oil prices and a reasonably supportive dollar, the USD/CAD concluded the session a point north of 1.33. In recent hours, we can see the H4 candles retesting 1.33 as support, which happens to bring with it an additional floor of nearby support in the shape of a channel resistance-turned support (taken from the high 1.3199). In the event buyers enter the fight here, the 1.34 handle is in sight as the next upside hurdle.
According to weekly structure, further upside from the 1.33 handle on the H4 timeframe is a possibility, as the unit exhibits space to press as far north as the 2017 yearly opening level at 1.3434. On the other side of the spectrum, however, daily price is testing its 200-day SMA value at 1.3301. This could pressure the unit towards support fixed at 1.3251, whereas a continuation north has resistance at 1.3382 to target.
Areas of consideration:
Keeping it simple this morning, should the H4 candles pencil in a bullish candlestick signal from 1.33ish today (entry/risk levels can be set according to this structure), this, given the room to move higher on the weekly timeframe, is considered a strong buy signal. As for upside targets from here, daily resistance at 1.3382 is in sight, closely followed by the round number 1.34 on the H4 timeframe and then the 2017 yearly opening level on the weekly timeframe at 1.3434.
USD/CHF:
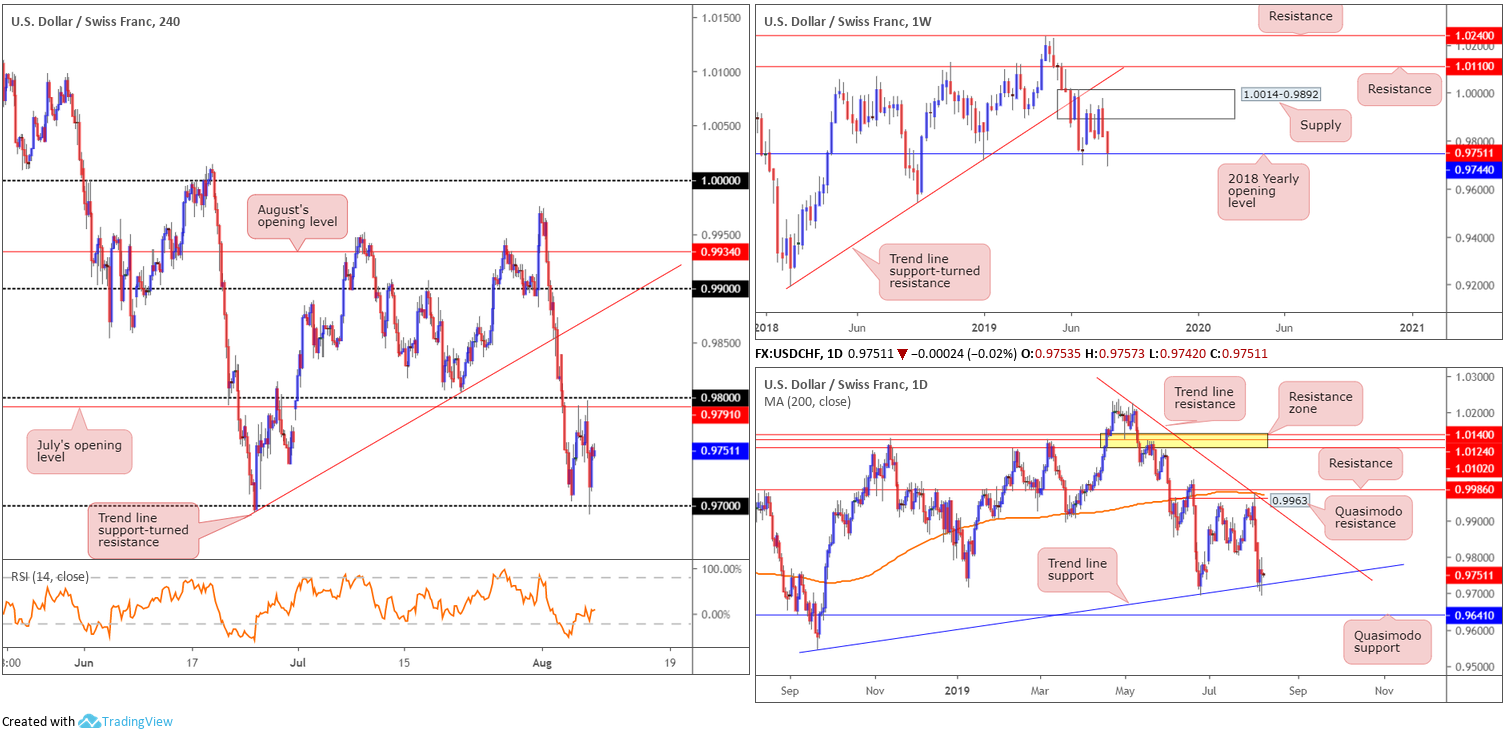
A turnaround in risk sentiment underpinned the Swiss franc’s safe-haven demand Wednesday, as the USD/CHF failed to capitalise on its early uptick towards 0.98. Mid-way through London’s morning session, the market observed the H4 candles selloff sharply from July’s opening level at 0.9791, eventually triggering orders at 0.97.
0.97, as is evident from the H4 timeframe, held firm into the close. This is not surprising as we have a daily trend line support (etched from the low 0.9542) in the fight as well as weekly support by way of the 2018 yearly opening level at 0.9744.
Areas of consideration:
Having seen weekly support at 0.9744 remain in the fold, and daily price respect trend line support, buyers appear to have the upper hand as far as structure is concerned. Unless the H4 candles retest 0.97 and produces a sizeable bullish candlestick signal, though, limited support is visible to take advantage of any up move.
Logically, as of current price, the H4 candles need to engulf 0.98 to the upside, consequently unlocking the door to trend line support-turned resistance (take from the low 0.9693), before serious longs will likely look to get involved.
Dow Jones Industrial Average:
US stocks encountered another volatile day as Wall Street investors fear the US-China trade war will inflict broad damage on the global economy. The Dow erased 22.45 points, or 0.09%; the S&P 500 added 2.21 points, or 0.08% and the Nasdaq advanced 30.58 points, or 0.41%.
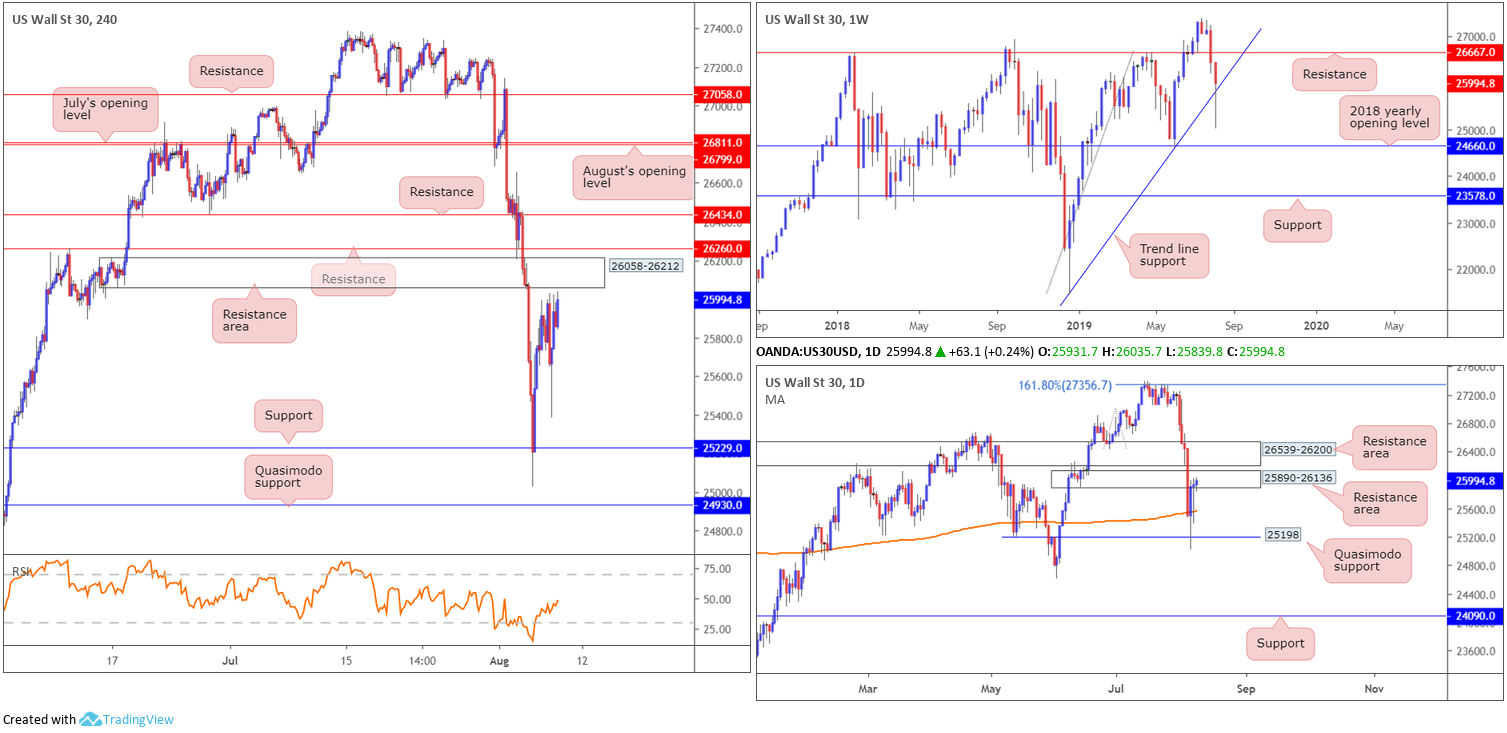
The technical landscape on the weekly timeframe reveals recent movement attempting to take hold of trend line support (etched from the low 21452) following Tuesday’s sharp move to lows of 25024. A closer reading of price action on the daily timeframe shows the unit testing a resistance area at 25890-26136, which, as you can see, is struggling to print anything meaningful to the downside thanks to the 200-day SMA (orange) offering support nearby. Follow-through upside from current price could eventually cast towards a resistance area sited at 26539-26200.
Price action on the H4 timeframe is hovering a few points south of a resistance area coming in at 26058-26212 (shadows the top edge of the current daily resistance zone and is also glued to the underside of the daily resistance area at 26539-26200), closely shadowed by another layer of resistance at 26260.
Areas of consideration:
In view of the current H4 resistance area’s position on the daily timeframe (see above), this could be an ideal platform to consider selling from. However, as it is impossible to know how far daily price will drive into its resistance area at 26539-26200 as well as the strength of weekly buyers from the aforementioned trend line support, waiting for H4 candlestick confirmation to form before pulling the trigger is recommended (entry and risk parameters can be defined according to the structure’s range). As for downside targets, traders likely have their crosshairs fixed on the 200-day SMA as the initial port of call.
XAU/USD (GOLD):
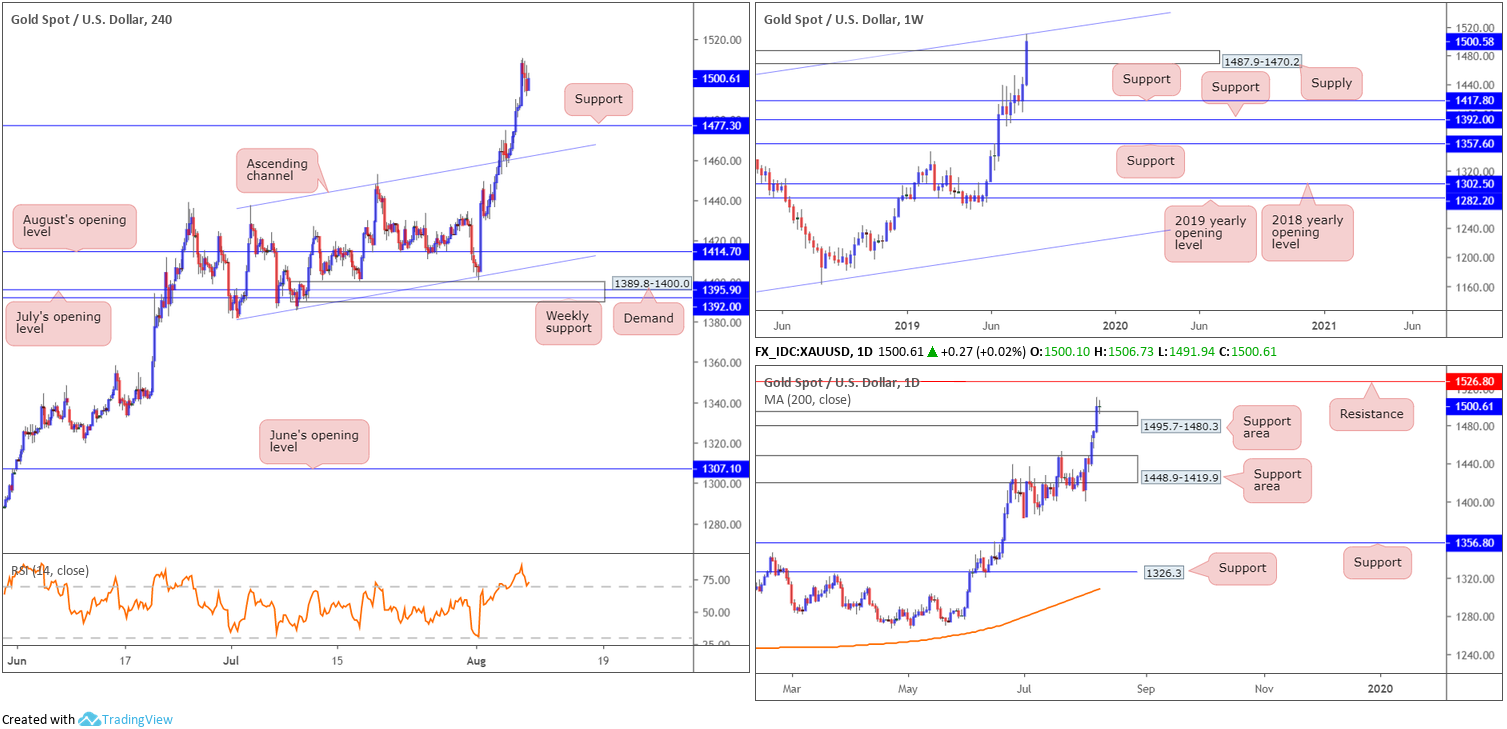
The yellow metal continues to draw demand as a safer alternative to currencies, as major central banks turn dovish amid concerns over a global economic slowdown. Despite recording its third consecutive session in positive territory and reaching highs of 1510.4, levels not seen since April 2013, trouble may be on the horizon according to the weekly timeframe’s technical position.
Weekly supply at 1487.9-1470.2 gave way in recent trading, permitting a free run towards a long-term channel resistance taken from the high 1375.1. As of current price, we can see the channel resistance holding firm. In terms of daily price, nonetheless, 1495.7-1480.3 is serving as a support area which may prompt additional upside in the direction of resistance pencilled in at 1526.8.
Across the charts on the H4 timeframe, price action exhibits scope to press as far north as supply coming in at 1568.4-1552.9 (not visible on the screen), with support lurking a few points below current price at 1477.3.
Areas of consideration:
Despite weekly channel resistance recently entering the fold, traders are likely focused on the current uptrend and looking for an opportunity to get involved. With daily price already retesting 1495.7-1480.3 as support, H4 support at 1477.3 is an ideal location to look for buying opportunities today, preferably on the back of a H4 bullish candlestick signal (entry and risk can be determined according to this structure). Why the need for candlestick confirmation? This is simply to try and help limit losses should weekly sellers push for lower ground.
The accuracy, completeness and timeliness of the information contained on this site cannot be guaranteed. IC Markets does not warranty, guarantee or make any representations, or assume any liability regarding financial results based on the use of the information in the site.
News, views, opinions, recommendations and other information obtained from sources outside of www.icmarkets.com.au, used in this site are believed to be reliable, but we cannot guarantee their accuracy or completeness. All such information is subject to change at any time without notice. IC Markets assumes no responsibility for the content of any linked site.
The fact that such links may exist does not indicate approval or endorsement of any material contained on any linked site. IC Markets is not liable for any harm caused by the transmission, through accessing the services or information on this site, of a computer virus, or other computer code or programming device that might be used to access, delete, damage, disable, disrupt or otherwise impede in any manner, the operation of the site or of any user’s software, hardware, data or property.


