
DXY:
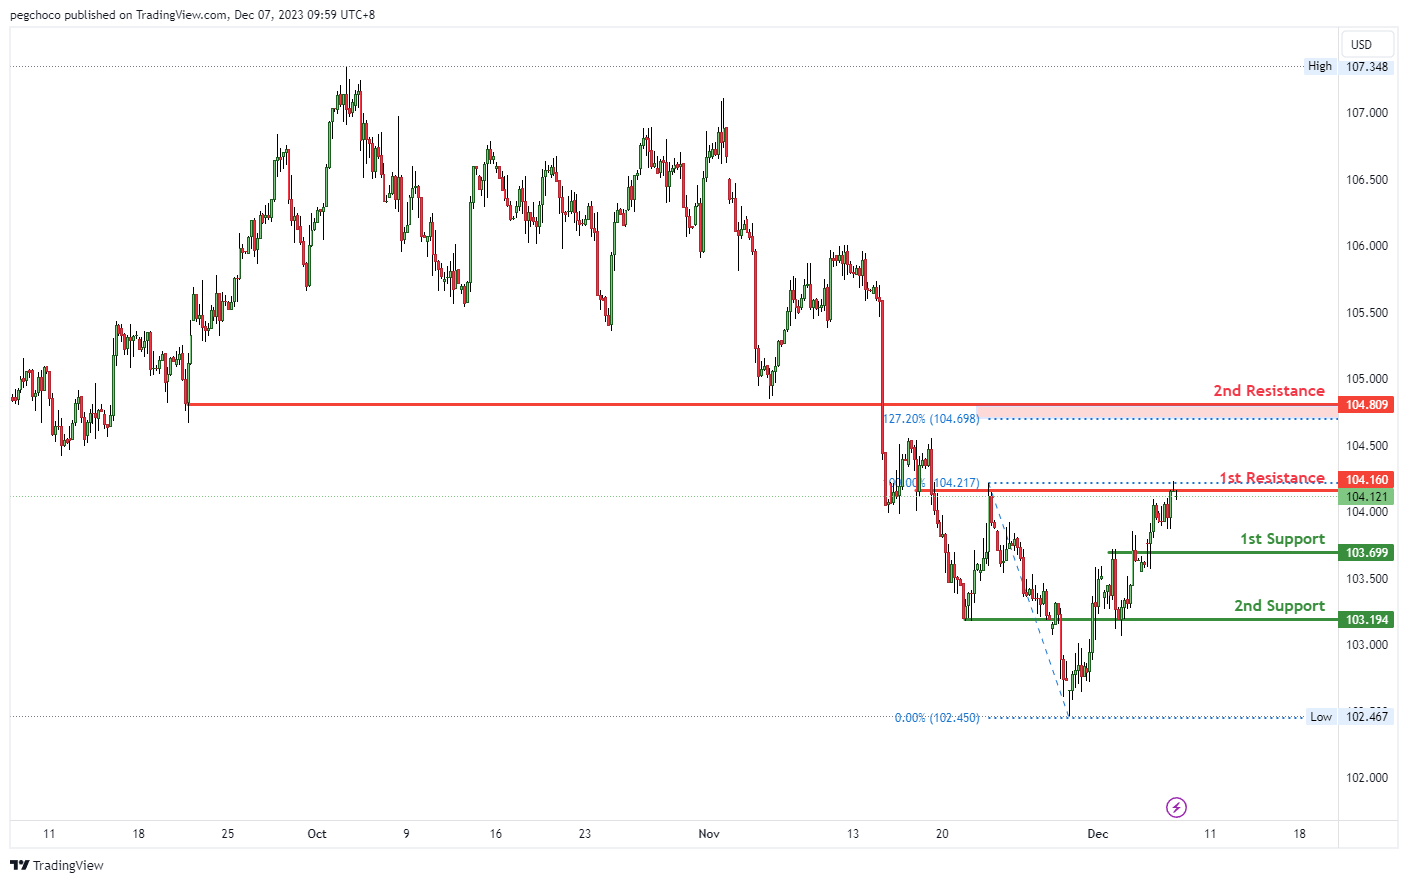
The DXY (US Dollar Index) chart is currently exhibiting a bearish overall momentum, and there’s a possibility of a bearish reaction off the 1st resistance level, leading to a potential drop towards the 1st support.
On the support side, the 1st support at 103.69 is identified as an overlap support level, suggesting it could be a significant area where buying interest might emerge. Additionally, there is a 2nd support at 103.19, also categorized as an overlap support, which further reinforces its potential as a level where buyers may become active.
On the resistance side, the 1st resistance at 104.16 is noted as an overlap resistance, implying it could act as a substantial barrier where selling interest could intensify. Furthermore, the 2nd resistance at 104.81 is identified as a pullback resistance, indicating another level where selling pressure may increase.
EUR/USD:
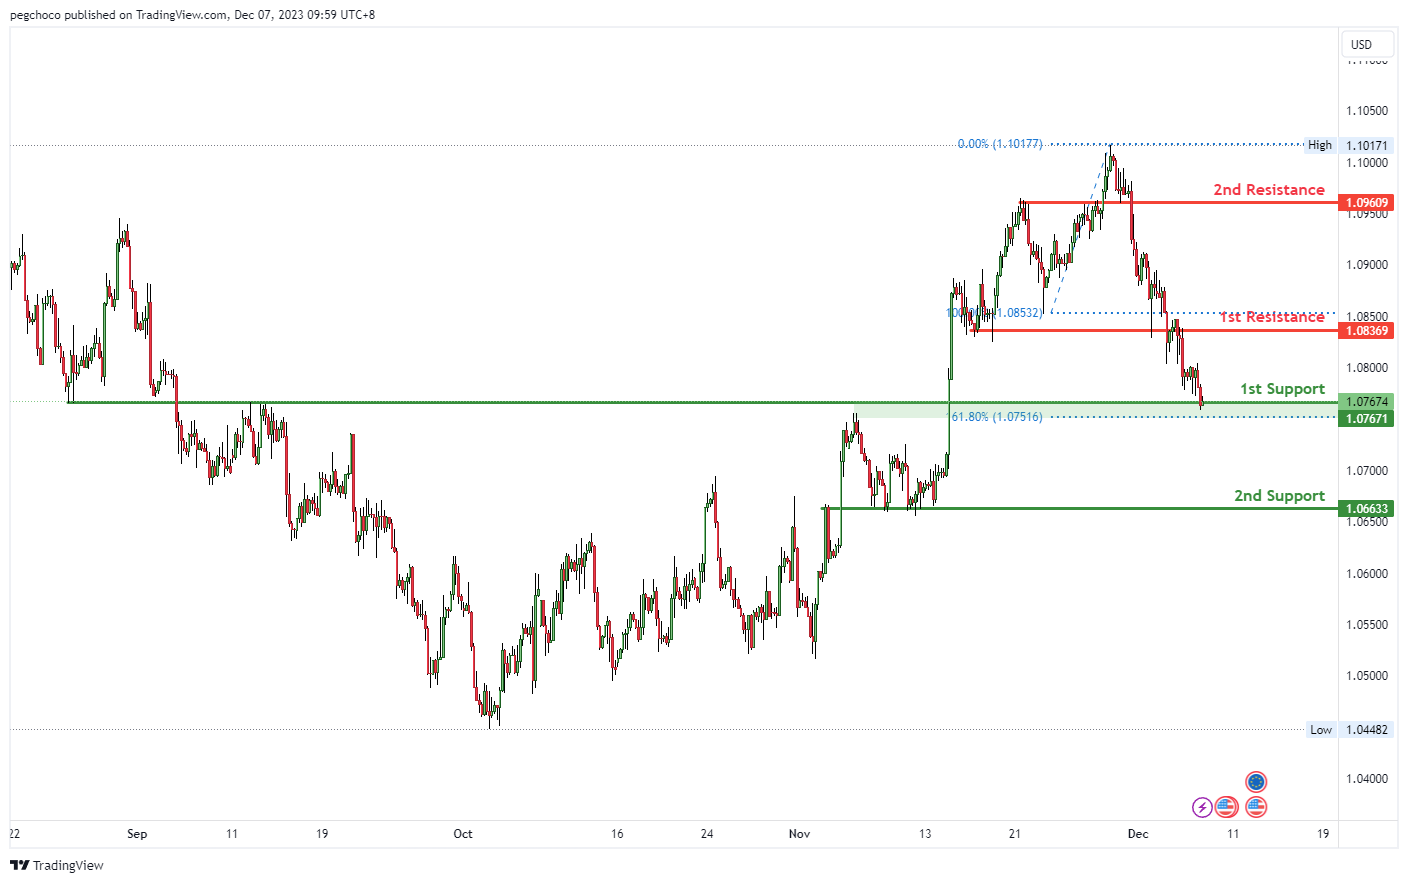
The EUR/USD chart currently exhibits a bullish overall momentum, and there’s potential for a bullish bounce off the 1st support level, suggesting a move towards the 1st resistance.
On the support side, the 1st support at 1.0767 is categorized as a pullback support and is further strengthened by the presence of the 161.80% Fibonacci Extension. This level indicates a potential area where buying interest may emerge.
Additionally, there is a 2nd support at 1.0663, identified as an overlap support, which could provide additional reinforcement to the support area.
On the resistance side, the 1st resistance at 1.0836 is categorized as an overlap resistance, implying it could act as a significant barrier where selling interest may intensify.
Further up, the 2nd resistance at 1.0960 is noted as a pullback resistance, indicating another level where selling pressure may increase.
resistance factors for the EUR/USD.
EUR/JPY:
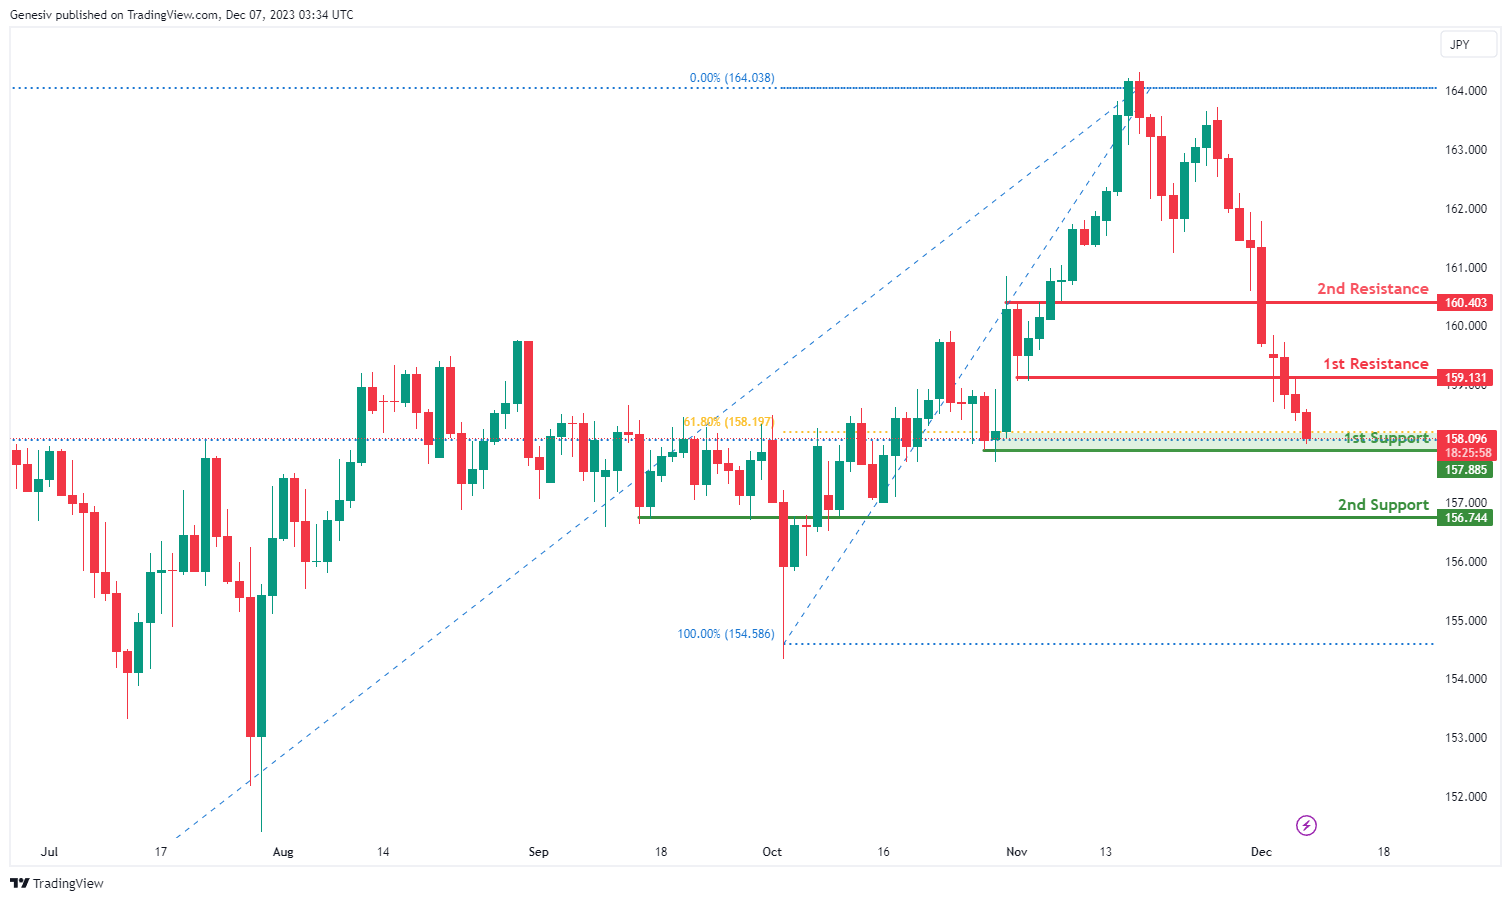
The EUR/JPY chart currently has bullish momentum. The price could drop further to the first support before rebounding and rising towards the first resistance.
1st Support at 157.89: This level is considered a multi-swing low support, suggesting historical significance as a level where the price may find support.
2nd Support at 156.74: This support is characterized by an overlap support and a 61.80% Fibonacci retracement, adding to its significance as a potential strong support zone.
1st Resistance at 159.13: The first resistance is identified as a pullback resistance, indicating a level where selling interest might be observed, potentially slowing down the upward movement.
2nd Resistance at 160.40: This level is noted as an overlap resistance, suggesting historical significance as a potential barrier to further upward movement.
EUR/GBP:
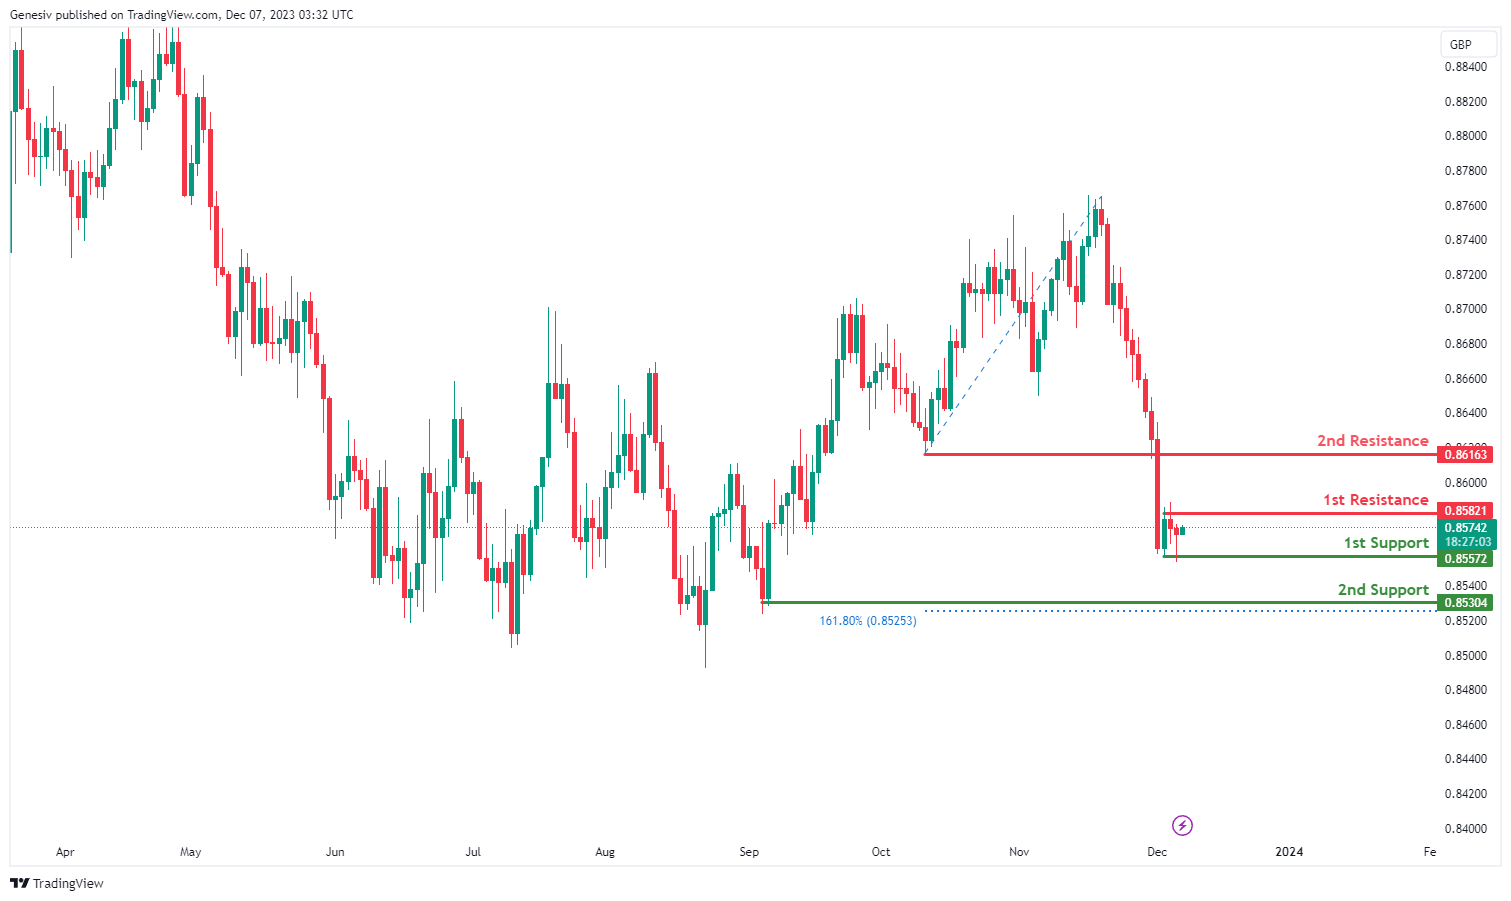
The EUR/GBP currency pair exhibits a bullish overall momentum, with a potential scenario for a bullish bounce off the first support, heading towards the first resistance.
1st Support at 0.8557: This level is identified as a multi-swing low support, indicating historical significance as a level where the price has found support in the past.
2nd Support at 0.8530: The second support is described as a swing low support, reinforcing the potential strength of this support zone.
1st Resistance at 0.8582: This level is recognized as a swing high resistance, suggesting historical points where the price faced obstacles and potential reversals.
2nd Resistance at 0.8616: The second resistance is identified as a pullback resistance, indicating a level where selling interest might be observed, potentially slowing down the upward movement.
GBP/USD:
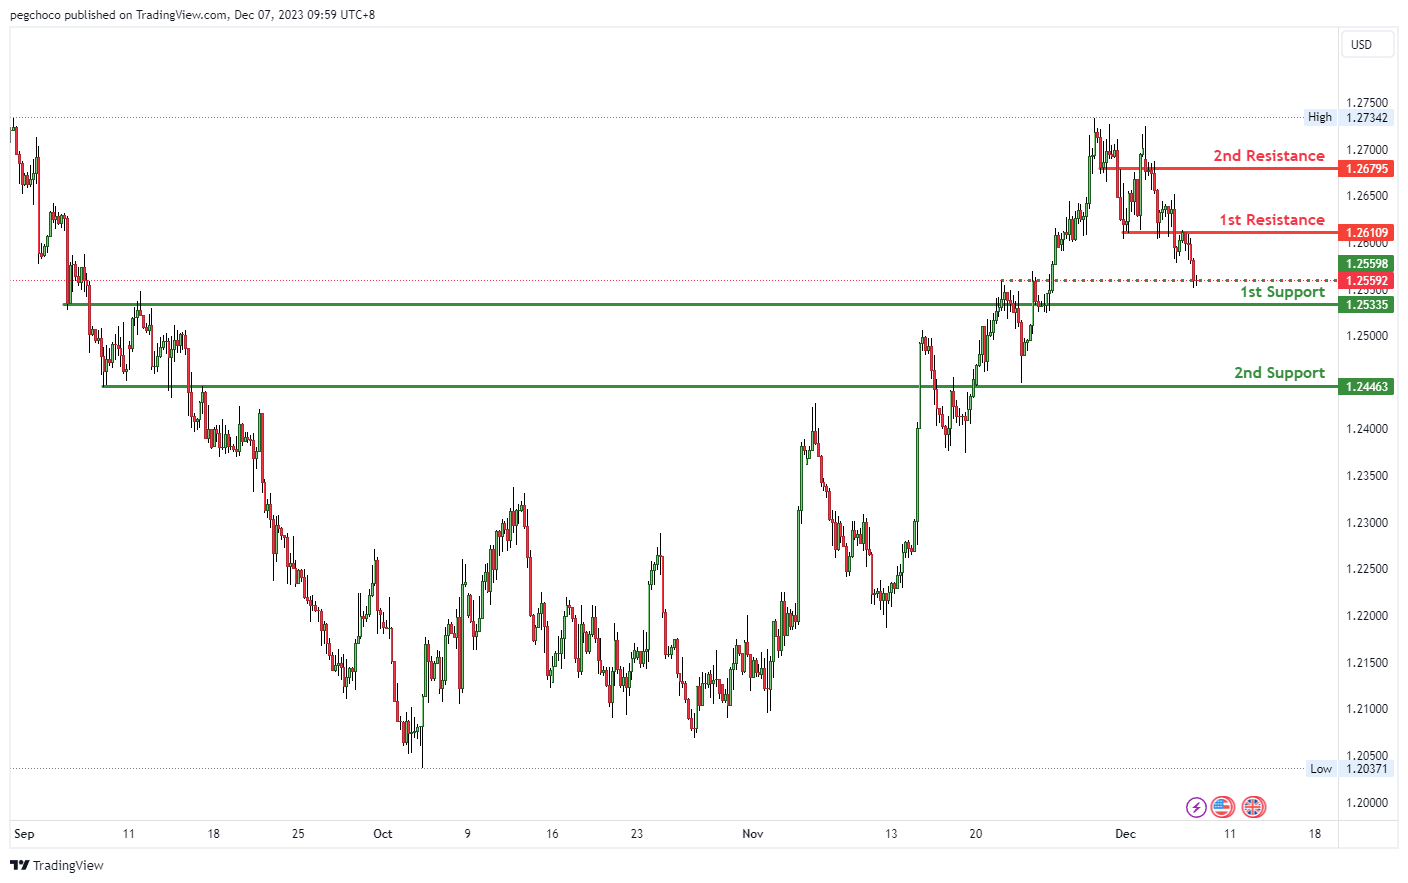
The GBP/USD chart currently demonstrates a bullish overall momentum, and there’s potential for a bullish bounce off the 1st support level, indicating a possible move towards the 1st resistance.
On the support side, the 1st support at 1.2535 is identified as an overlap support, suggesting it could serve as a significant level where buying interest may emerge and potentially provide support for the GBP/USD pair.
Further down, there is a 2nd support at 1.2446, also categorized as an overlap support, which reinforces the significance of this support level.
On the resistance side, the 1st resistance at 1.2610 is noted as an overlap resistance, implying it could act as a substantial barrier where selling interest may intensify.
Moreover, the 2nd resistance at 1.2679 is also categorized as an overlap resistance, further emphasizing its potential role as a resistance level.
Additionally, there’s an intermediate support at 1.2559, identified as a pullback support, which could provide added support in case of a retracement.
GBP/JPY:
The GBP/JPY currency pair is currently experiencing a bearish momentum, suggesting a potential bearish continuation towards the first support
1st Support at 184.24: This support is identified as a pullback support, indicating a level where buying interest may arise.
2nd Support at 182.89 is considered a significant level, characterized as a swing low support and supported by the 127.20% Fibonacci Extension, reinforcing its potential as a strong defensive barrier.
1st Resistance at at 185.08 is noted as a pullback resistance, implying a level where selling interest might be observed.

USD/CHF:
The USD/CHF chart currently displays a neutral overall momentum, and there’s a potential scenario in which price could fluctuate between the 1st resistance and 1st support levels.
On the support side, the 1st support at 0.8665 is considered a multi-swing low support. This designation suggests that it may hold significance as a level where buying interest could emerge, potentially providing support to the USD/CHF pair.
On the resistance side, the 1st resistance at 0.8762 is identified as an overlap resistance. This indicates that it could act as a notable barrier where selling interest might intensify, potentially preventing further upside movement.
Additionally, the 2nd resistance at 0.8861 is also classified as an overlap resistance, reinforcing its potential role as a resistance level.

USD/JPY:
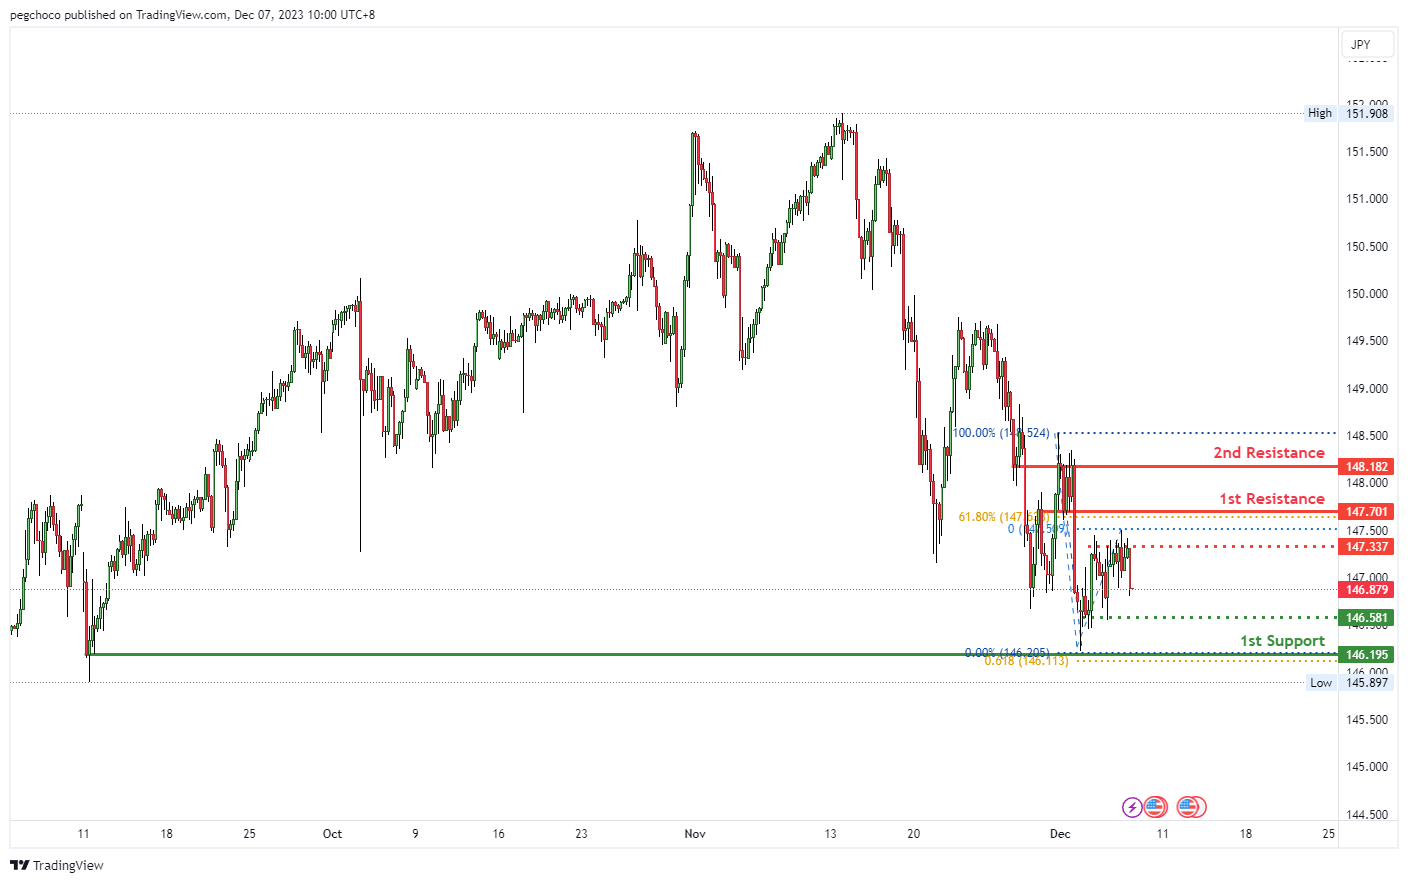
The USD/JPY chart currently exhibits a bearish overall momentum, and there’s a potential scenario in which price could experience a bearish reaction off the 1st resistance and drop towards the 1st support.
On the support side, the 1st support at 146.19 is classified as a swing low support and is further reinforced by the presence of the 61.80% Fibonacci Projection, indicating its potential significance as a level where buying interest may emerge, offering support to the USD/JPY pair.
Additionally, there is an intermediate support at 146.58, identified as a multi-swing low support, which further strengthens the notion that this could be a noteworthy support level.
On the resistance side, the 1st resistance at 147.70 is categorized as a pullback resistance, and it coincides with the 61.80% Fibonacci Retracement level. This suggests it could serve as a substantial barrier where selling interest may intensify, potentially leading to a bearish continuation.
The 2nd resistance at 148.18 is recognized as an overlap resistance, indicating another level where selling pressure may increase.
Intermediate resistance is also noted at 147.33, classified as a multi-swing high resistance, adding to the complexity of the price action in this area.
USD/CAD:
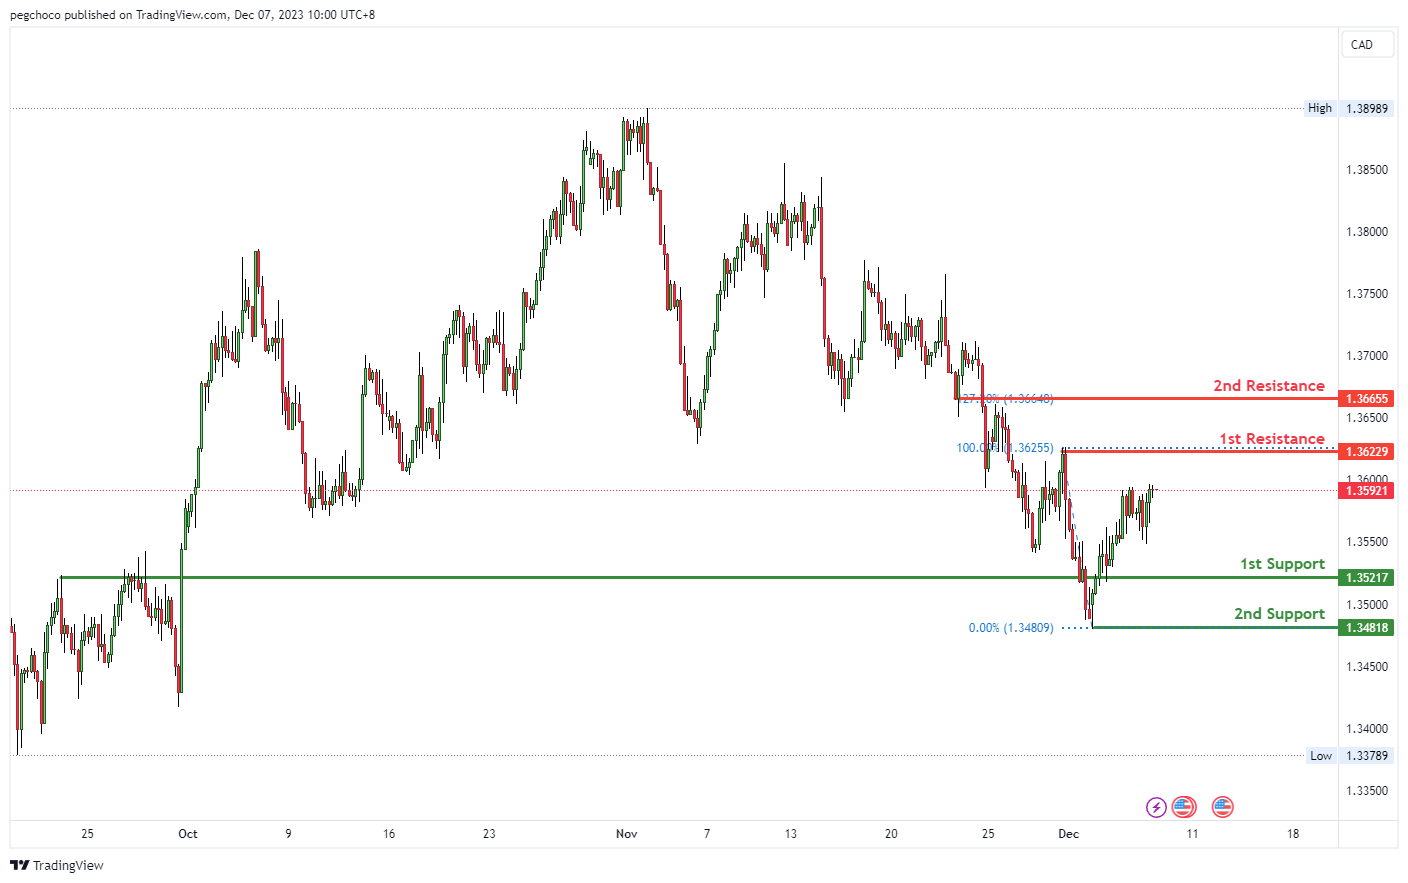
The USD/CAD chart currently exhibits a neutral overall momentum, indicating that there is no strong bullish or bearish bias at the moment. This suggests that price may move within a range between the 1st resistance and 1st support levels.
The 1st support level at 1.3521 is classified as an overlap support, which implies that it has historical significance and may attract buying interest. Traders should watch this level closely, as it could potentially provide support for the USD/CAD pair.
The 2nd support at 1.3481 is identified as a swing low support, further emphasizing its importance as a level where buyers may step in. This level adds an additional layer of potential support.
On the resistance side, the 1st resistance at 1.3622 is categorized as a swing high resistance. This indicates that it is a significant barrier where selling interest could intensify, potentially preventing price from moving higher.
The 2nd resistance at 1.3666 is also classified as an overlap resistance, signifying its potential importance as a level where selling pressure may increase. Traders should monitor this level as a potential obstacle to upward movements.
AUD/USD:
The AUD/USD chart currently has a bearish overall momentum, and there’s potential for a bearish continuation towards the 1st support level.
The 1st support at 0.6516 is categorized as a pullback support, suggesting it may act as a significant level where buying interest could potentially emerge, halting or slowing down the bearish momentum.
The 2nd support at 0.6448 is also identified as a pullback support, reinforcing the potential significance of this level as a zone where buyers might become active.
On the resistance side, the 1st resistance at 0.6589 is noted as an overlap resistance, indicating that it’s a substantial barrier where selling interest could intensify, potentially leading to a continuation of the bearish trend.
The 2nd resistance at 0.6675 is categorized as a multi-swing high resistance, further suggesting its importance as a potential barrier to upward movements.

NZD/USD
The NZD/USD chart currently has a bearish overall momentum, and there’s potential for a bearish break off the 1st support level with a potential drop towards the 2nd support.
The 1st support at 0.6130 is categorized as an overlap support, suggesting it may be a significant level where buying interest could emerge. However, the bearish momentum indicates the possibility of a breakdown below this support level.
The 2nd support at 0.6066 is also identified as an overlap support, further reinforcing its significance as a potential area where buyers might become active. Traders should closely monitor price movements to see if this level holds in the event of a bearish breakout.
On the resistance side, the 1st resistance at 0.6191 is noted as a pullback resistance, indicating that it’s a substantial barrier where selling interest could intensify, potentially leading to a bearish continuation.
The 2nd resistance at 0.6222 is categorized as a swing high resistance, which could act as an additional barrier to upward movements.

DJ30:
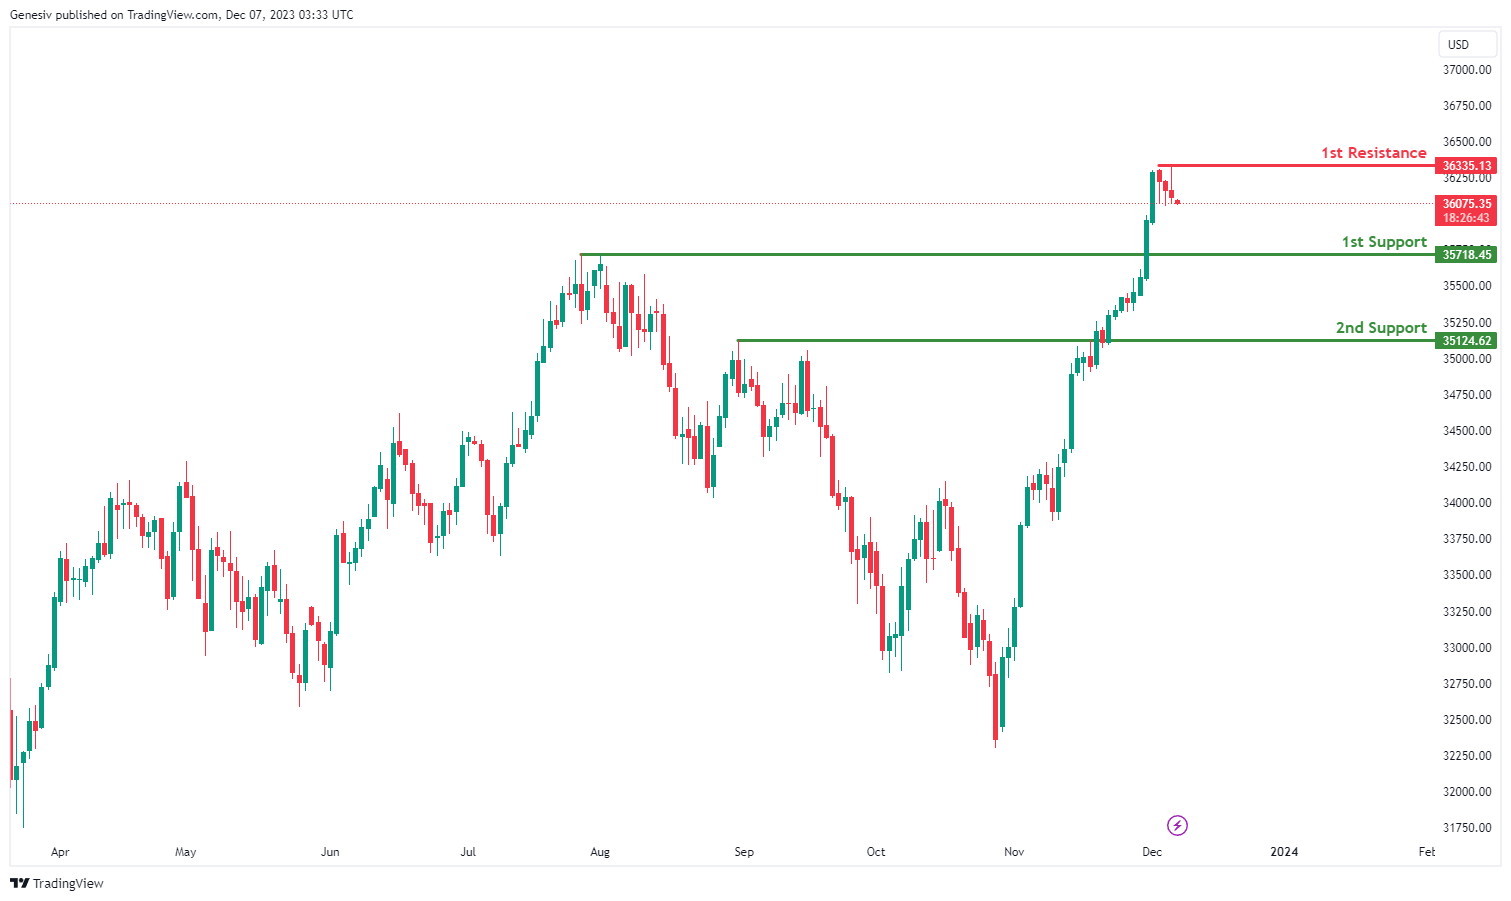
The DJ30 shows a bearish overall momentum, suggesting a prevailing downtrend.
1st Support at 35718.45: This support level is located at 35718.45 and is considered significant because it is based on pullback support. Pullback support levels often represent areas where the price has previously retraced to before resuming its upward movement.
2nd Support at 35124.62: The second support level is at 35124.62 and is based on an overlap support. An overlap support occurs when multiple price movements have historically converged around a specific level, creating a zone of support. This level suggests a stronger support zone, and it aligns with the first support level, reinforcing its significance.
1st Resistance at 36338.02: The first resistance level is at 36338.02 and is considered strong because it’s based on swing high resistance. Swing high resistance levels are where the price has previously encountered selling pressure after reaching a peak.
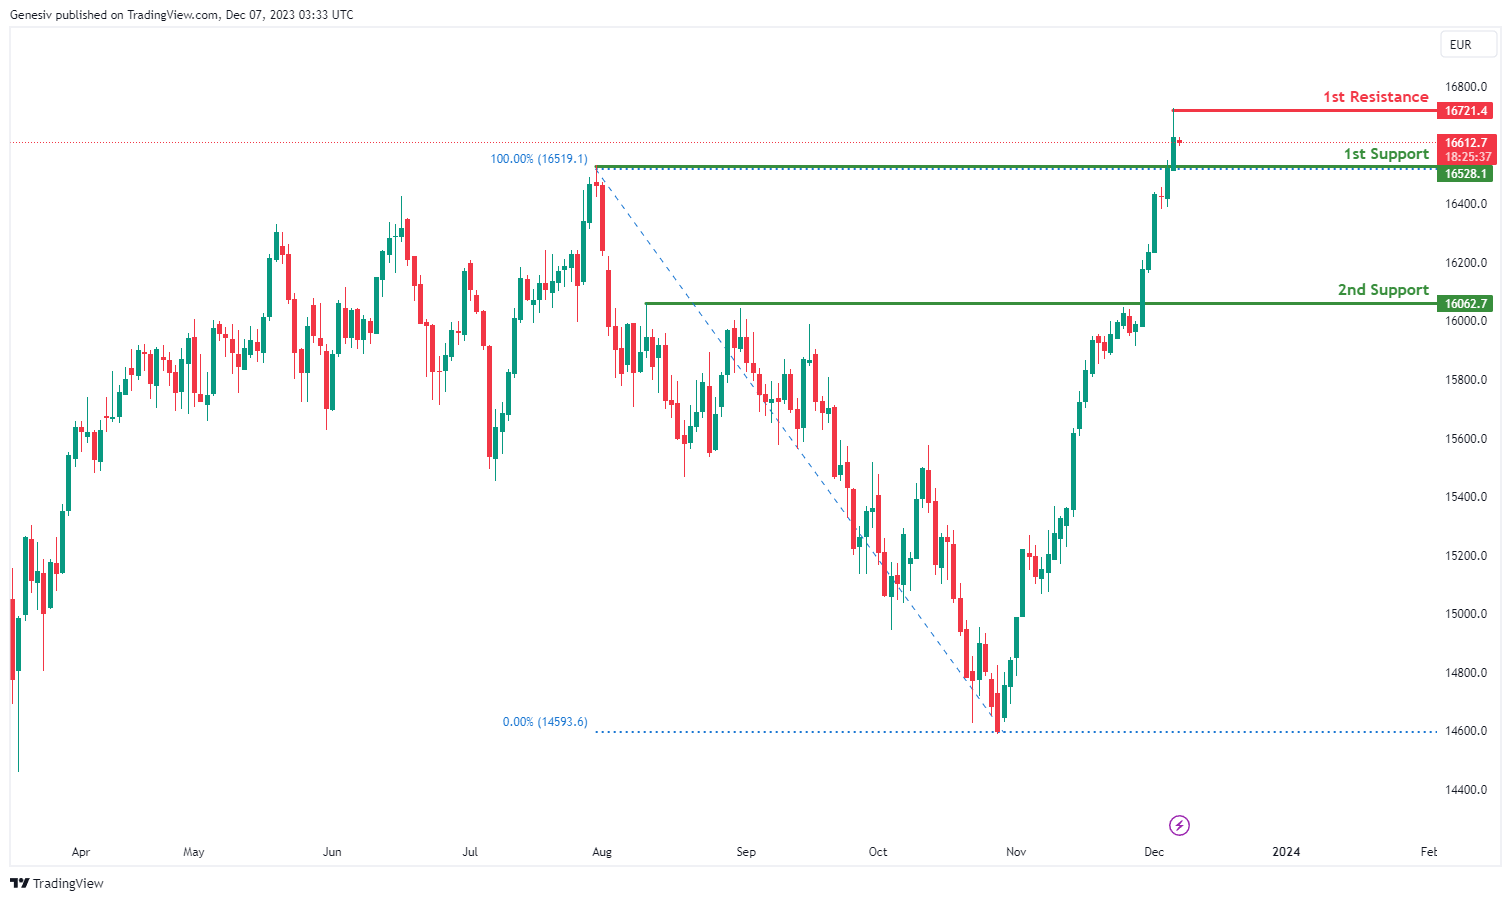
GER40:
The GER40 indicates a bearish overall momentum, suggesting a prevailing downtrend.
1st Support at 16610.7: This support level is at 16610.7 and is considered significant because it’s based on pullback support. Pullback support levels often represent areas where the price has previously retraced to before resuming its upward movement.
2nd Support at 16062.7: The second support level is at 16062.7 and is also based on pullback support. Similar to the first support, this level represents an area where buyers have historically become more active during pullback phases. It’s slightly lower than the first support, suggesting that if the price continues to decline, this could be the next potential level of support.
1st Resistance at 16721.4: The first resistance level is at 16721.4 and is considered strong because it’s based on swing high resistance. Swing high resistance levels are where the price has previously encountered selling pressure after reaching a peak.
2nd Resistance at 17054.5: The second resistance level is at 17054.5 and is associated with the 127.20% Fibonacci Extension. Fibonacci extensions are often used by traders to identify potential price targets based on historical price movements.
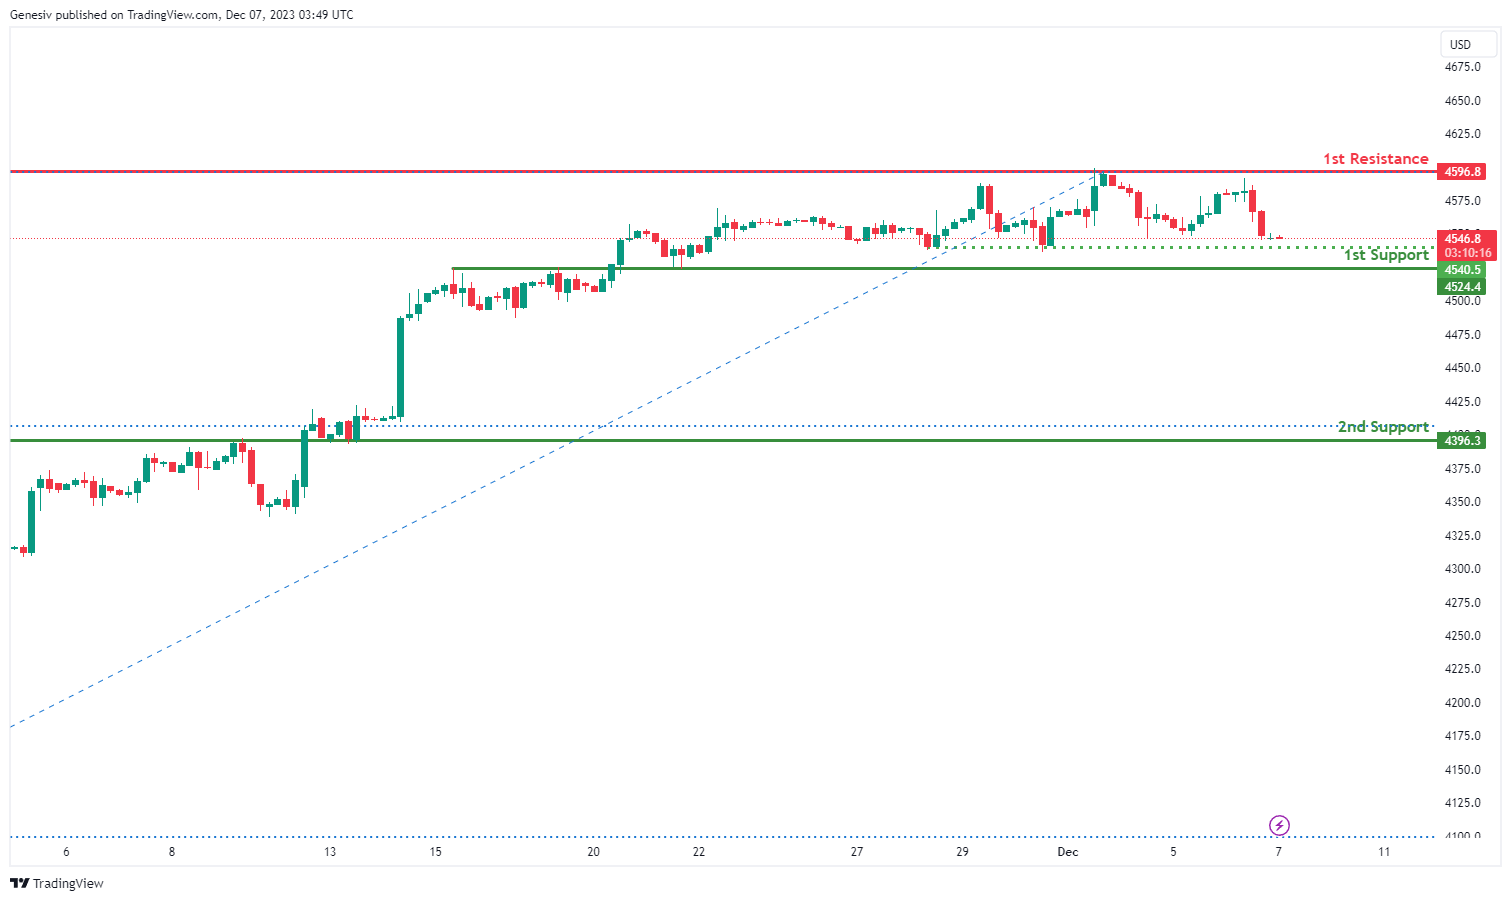
`US500:
The chart of US500 indicates a bearish momentum, suggesting a prevailing downtrend.
1st Support at 4540.5: This support level is at 4540.5 and is considered significant because it’s based on an overlap support. Overlap support levels often represent areas where the price has previously found support and may attract buying interest again.
2nd Support at 4396.3: The second support level is at 4396.3 and is also based on an overlap support. It’s slightly lower than the first support and could serve as an additional support level if the price continues to drop. This level represents another historical area where buyers have been active.
1st Resistance at 4596.8: The first resistance level is at 4596.8 and is considered strong because it’s based on swing high resistance. Swing high resistance levels are where the price has previously encountered selling pressure after reaching a peak.
Intermediate Support at 4547.1: This intermediate support level is at 4547.1 and is based on swing low support. Swing low support levels represent areas where the price has previously found support during its downward swings. It’s located slightly above the 1st support level, indicating a potential support zone.
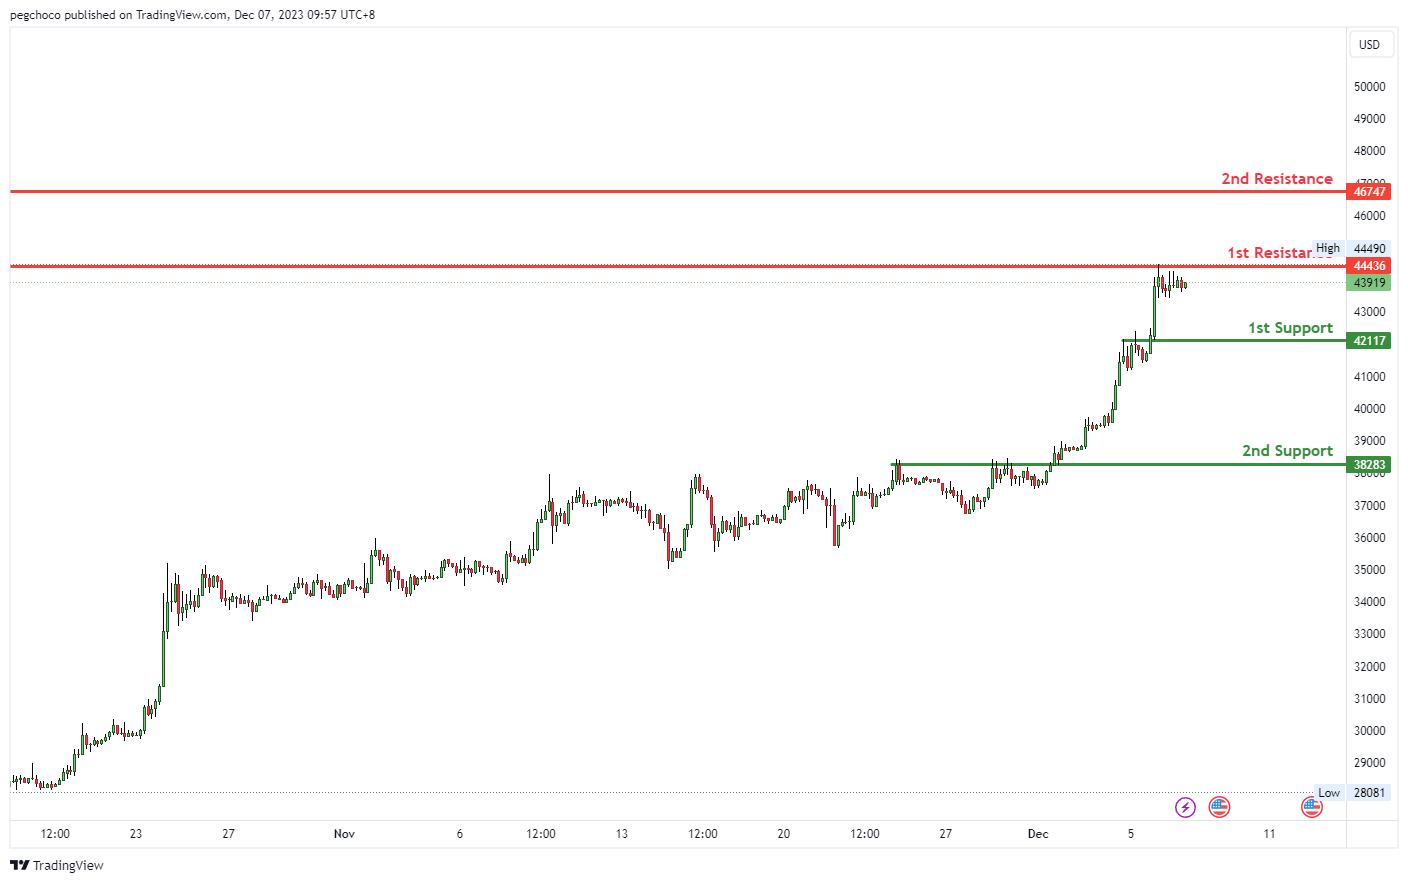
BTC/USD:
The BTC/USD chart currently exhibits a bearish overall momentum, indicating a potential bearish reaction off the 1st resistance level with a potential drop towards the 1st support.
The 1st support at 38283 is categorized as an overlap support, suggesting it may be a significant level where buying interest could emerge. This level may act as a potential area of support for the BTC/USD pair due to historical price interactions or other technical factors.
The 2nd support at 35619 is also identified as an overlap support, further reinforcing its significance as a potential area where buyers might become active.
On the resistance side, the 1st resistance at 44436 is noted as a pullback resistance. This implies that it’s a substantial barrier where selling interest could intensify, potentially leading to a bearish continuation.
The 2nd resistance at 46747 is categorized as an overlap resistance, indicating another level where selling pressure may increase.
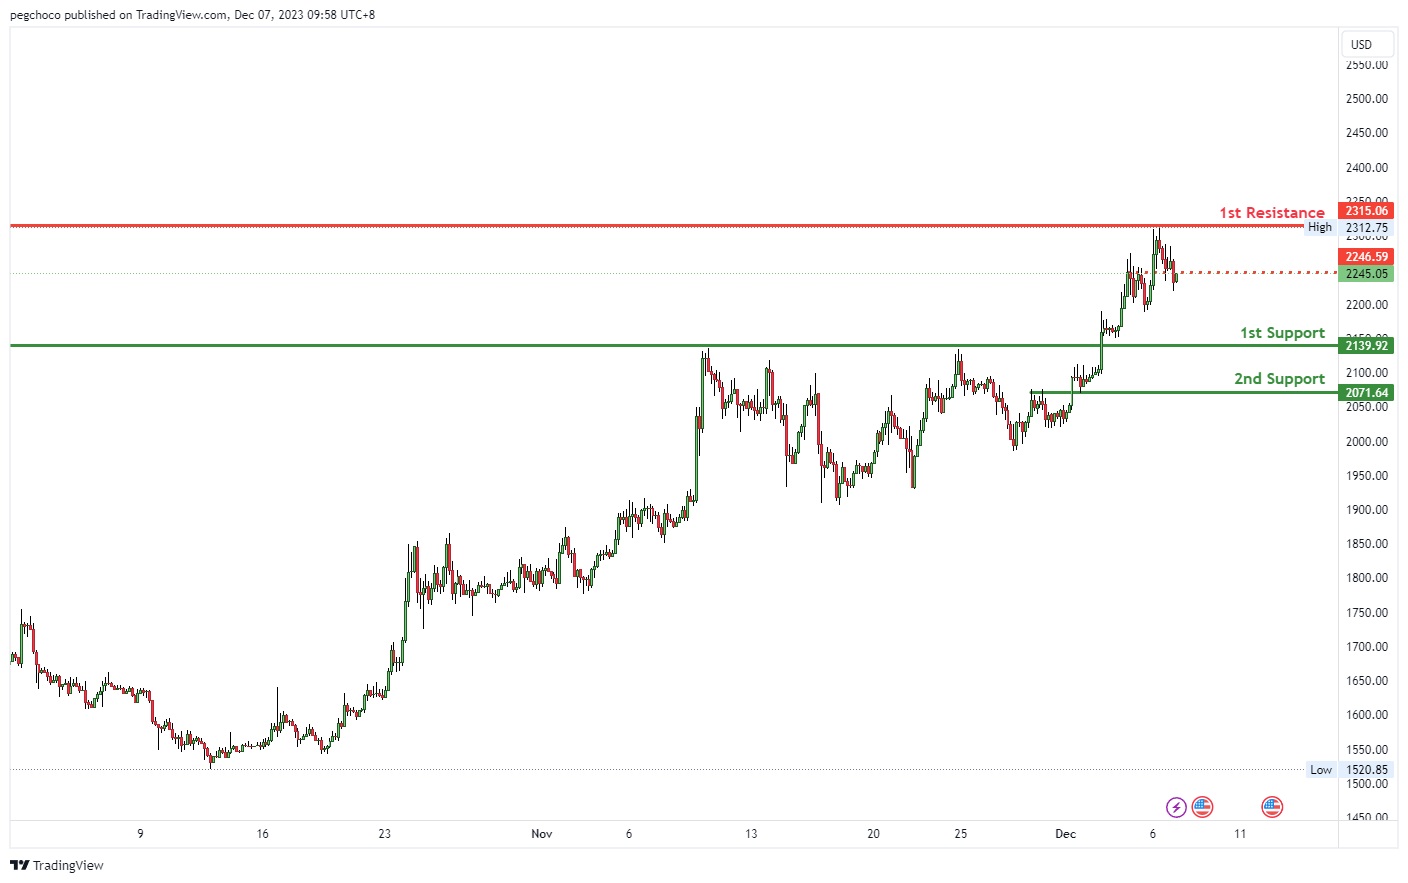
ETH/USD:
The ETH/USD chart currently indicates a bearish overall momentum, suggesting the possibility of a bearish continuation towards the 1st support level.
The 1st support at 2139.92 is identified as a pullback support. This implies that it could be a significant level where buying interest may emerge, potentially providing support for the ETH/USD pair as it may attract traders looking to buy at lower prices.
The 2nd support at 2071.64 is categorized as an overlap support. This reinforces the significance of this support level, indicating that it may be an area where buyers become active due to historical price congestion or other technical factors.
On the resistance side, the 1st resistance at 2315.06 is noted as a pullback resistance. This implies that it’s a substantial barrier where selling interest could intensify, potentially leading to a bearish continuation.
The intermediate resistance at 2246.59 is also categorized as a pullback resistance, further emphasizing its significance as a potential level where selling pressure may increase.
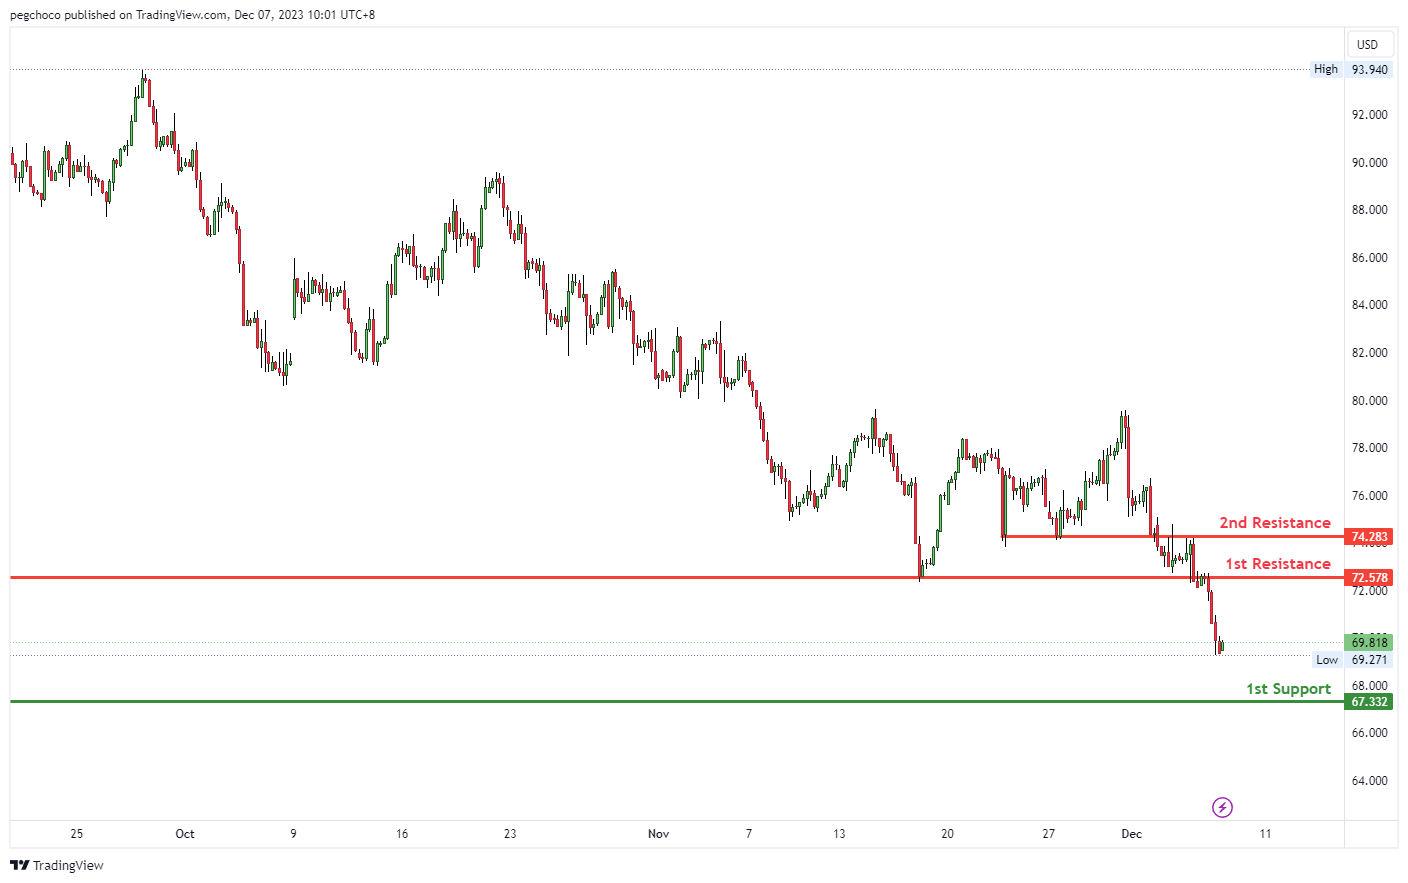
WTI/USD:
The WTI (West Texas Intermediate) chart currently exhibits a bearish overall momentum, indicating a potential scenario for a bearish continuation towards the 1st support level.
The 1st support at 67.33 is noted without a specific reason. It’s important to consider that support levels should ideally be accompanied by reasons or factors that make them significant. Traders often look for support levels with identifiable reasons, such as previous price congestion, trendlines, or Fibonacci levels, to have more confidence in their effectiveness.
On the resistance side, the 1st resistance at 72.57 is categorized as an overlap resistance. This implies that it’s a substantial barrier where selling interest could intensify, potentially leading to a bearish continuation.
The 2nd resistance at 74.28 is also identified as an overlap resistance, reinforcing its significance as a potential level where selling pressure may increase.
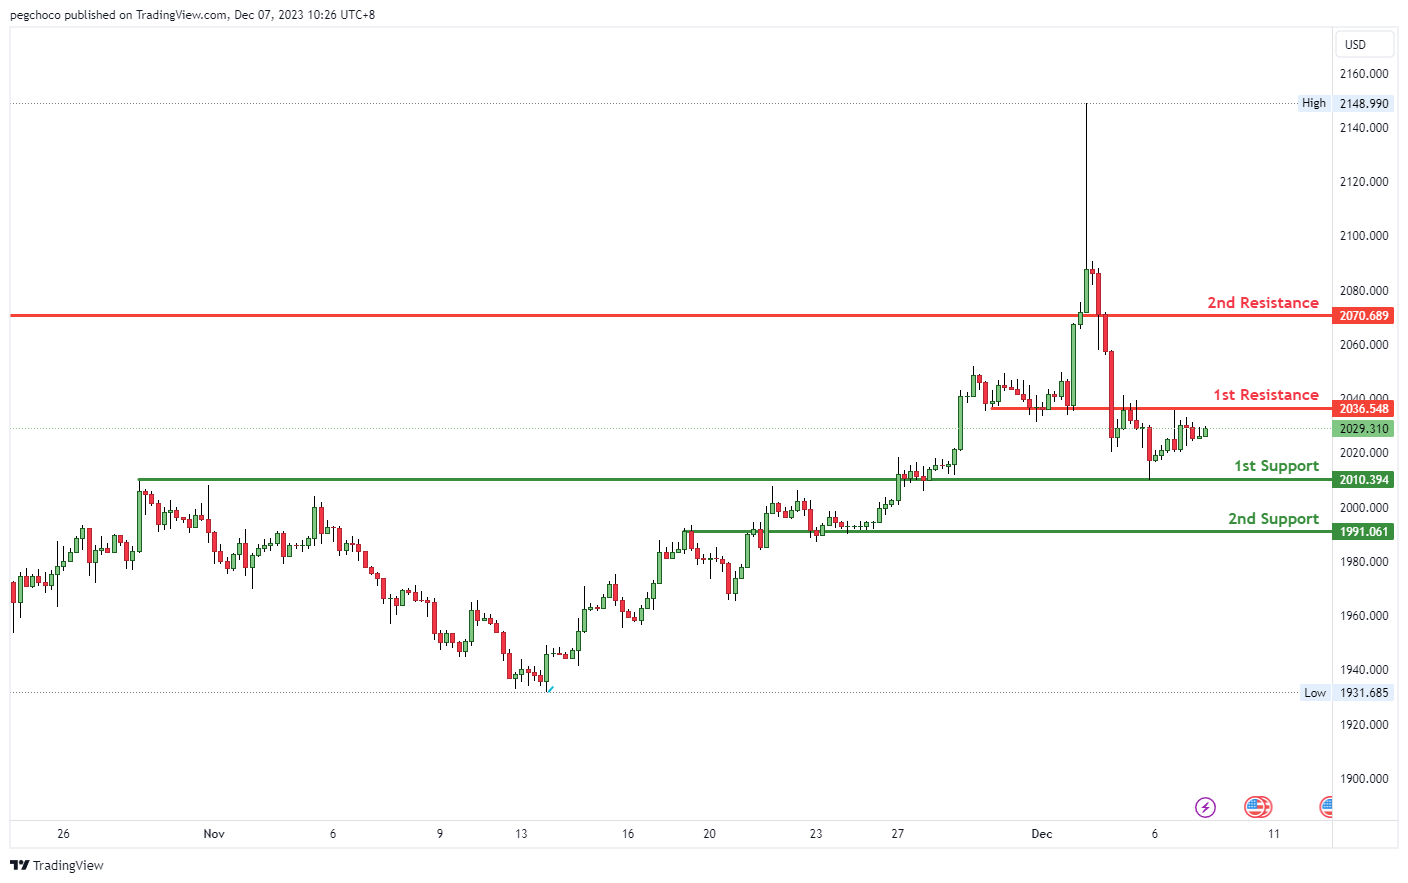
XAU/USD (GOLD):
The XAU/USD chart currently demonstrates a neutral overall momentum, suggesting a potential scenario in which the price may fluctuate between the 1st resistance and 1st support levels.
On the support side, the 1st support at 2010.39 is classified as an overlap support, indicating that it could be a significant level where buying interest may emerge. This level may serve as a foundation of support for XAU/USD.
Furthermore, there is a 2nd support at 1991.06, also identified as an overlap support, reinforcing its importance as a potential area where buyers might become active.
On the resistance side, the 1st resistance at 2036.54 is categorized as an overlap resistance. This level could act as a substantial barrier where selling interest may intensify, potentially leading to a pause or reversal in the price movement.
The 2nd resistance at 2070.68 is recognized as a pullback resistance, indicating another level where selling pressure may increase.
The accuracy, completeness and timeliness of the information contained on this site cannot be guaranteed. IC Markets does not warranty, guarantee or make any representations, or assume any liability regarding financial results based on the use of the information in the site.
News, views, opinions, recommendations and other information obtained from sources outside of www.icmarkets.com, used in this site are believed to be reliable, but we cannot guarantee their accuracy or completeness. All such information is subject to change at any time without notice. IC Markets assumes no responsibility for the content of any linked site.
The fact that such links may exist does not indicate approval or endorsement of any material contained on any linked site. IC Markets is not liable for any harm caused by the transmission, through accessing the services or information on this site, of a computer virus, or other computer code or programming device that might be used to access, delete, damage, disable, disrupt or otherwise impede in any manner, the operation of the site or of any user’s software, hardware, data or property.


