
Key risk events today:
New Zealand Inflation Expectations q/q; BoE Monetary Policy Report; MPC Official Bank Rate Votes; BoE Monetary Policy Summary and Official Bank Rate; MPC Asset Purchase Facility Votes; BoE Gov. Bailey Speaks; US Unemployment Claims.
(Previous analysis as well as outside sources – italics).
EUR/USD:
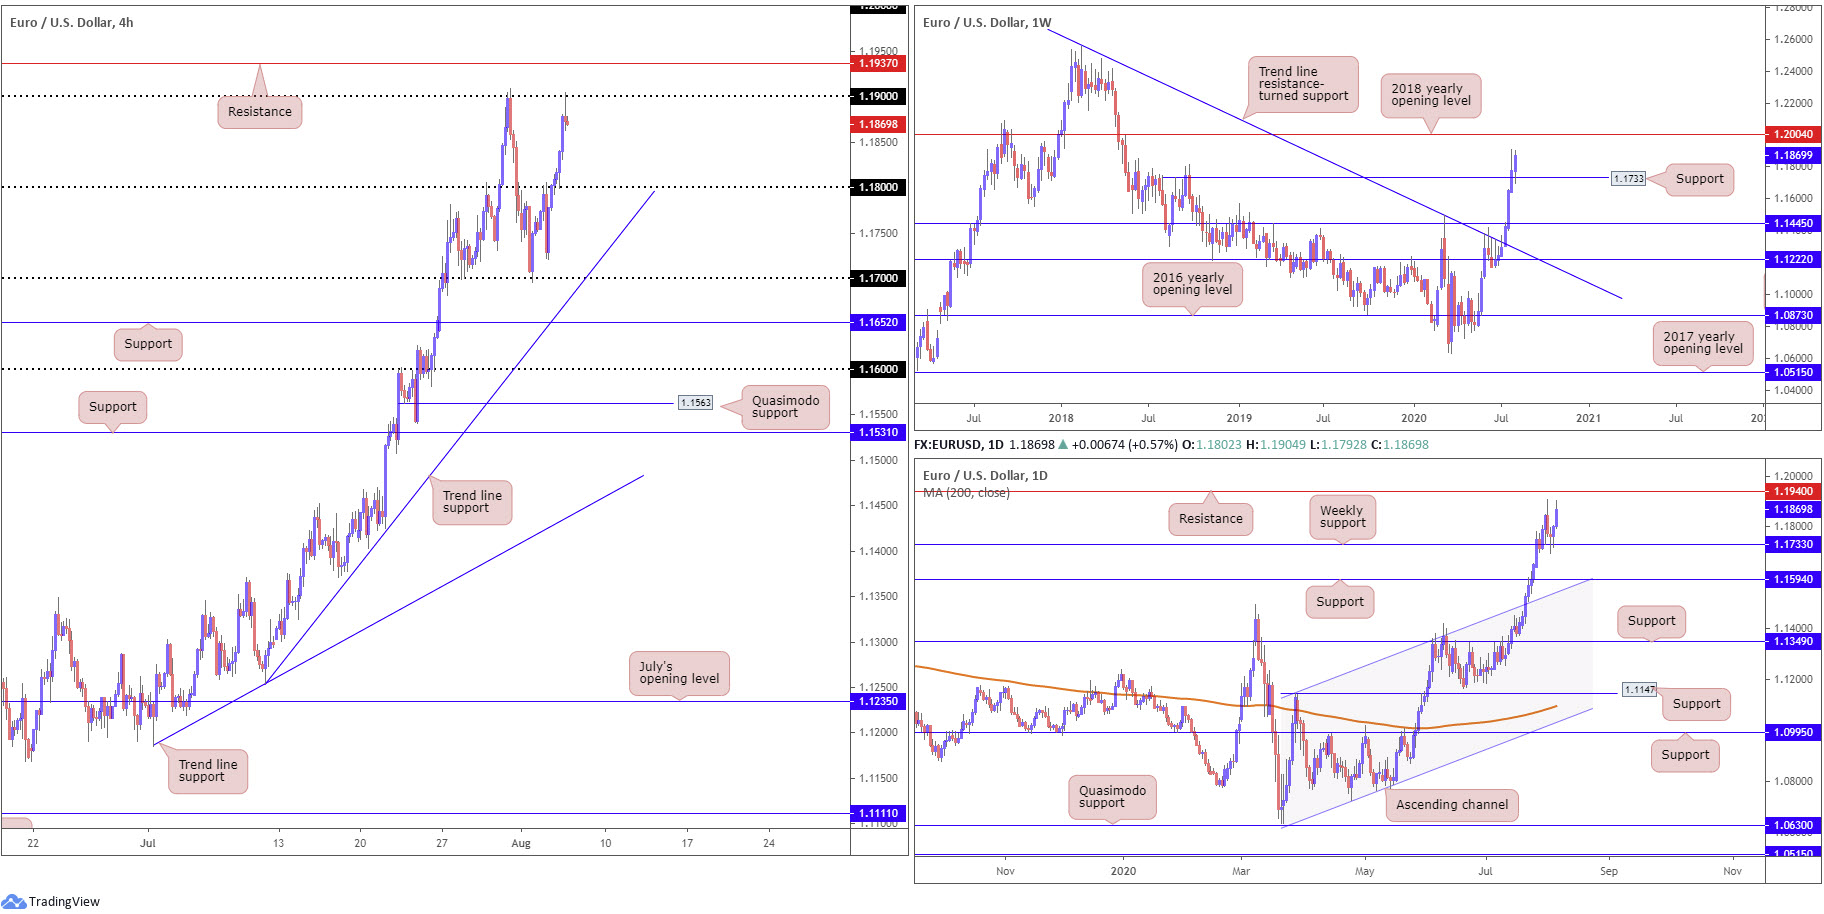
Europe’s shared currency extended recovery gains against the US dollar Wednesday, making considerable headway north of 1.18 on the H4 timeframe and shaking hands with 1.19. Technical traders will acknowledge additional resistance rests at 1.1937, while a retreat back to the 1.18 vicinity could merge things with trend line support, extended from the low 1.1254.
On the data front, US economic activity in the services sector (formally non-manufacturing sector) grew in July for the second month in a row, according to the Institute for Supply Management (ISM). In addition, ADP employment change reported a paltry increase of only 167,000 private-sector jobs in July.
Weekly technical flow continues to climb after recently recording a sixth consecutive weekly gain. The retest at 1.1733 support (prior Quasimodo resistance) has clearly been welcomed by buyers, perhaps targeting the 2018 yearly opening level at 1.2004. The story on the daily timeframe, also coming off weekly support at 1.1733, however, has resistance parked at 1.1940.
Areas of consideration:
The break of weekly trend line resistance (July 13), taken from the high 1.2555, and violation of the 1.1495 March 9 high, reflects a long-term (potential) technical trend change.
Weekly structure points to additional bullish sentiment after retesting 1.1733 support, possibly providing fuel to take things to the key figure 1.20 on the H4 (weekly resistance resides at 1.2004). Before reaching this far north, though, buyers must contend with daily resistance at 1.1940 (and H4 resistance at 1.1937).
On account of the above, yesterday’s reaction from 1.19 is unlikely to deliver much downside today. A fakeout above the round number to daily resistance at 1.1940, according to the weekly timeframe, is the more likely route today/tomorrow, which could, given a H4 close back beneath 1.19 (after testing 1.1940), chalk up an intraday countertrend signal.
GBP/USD:
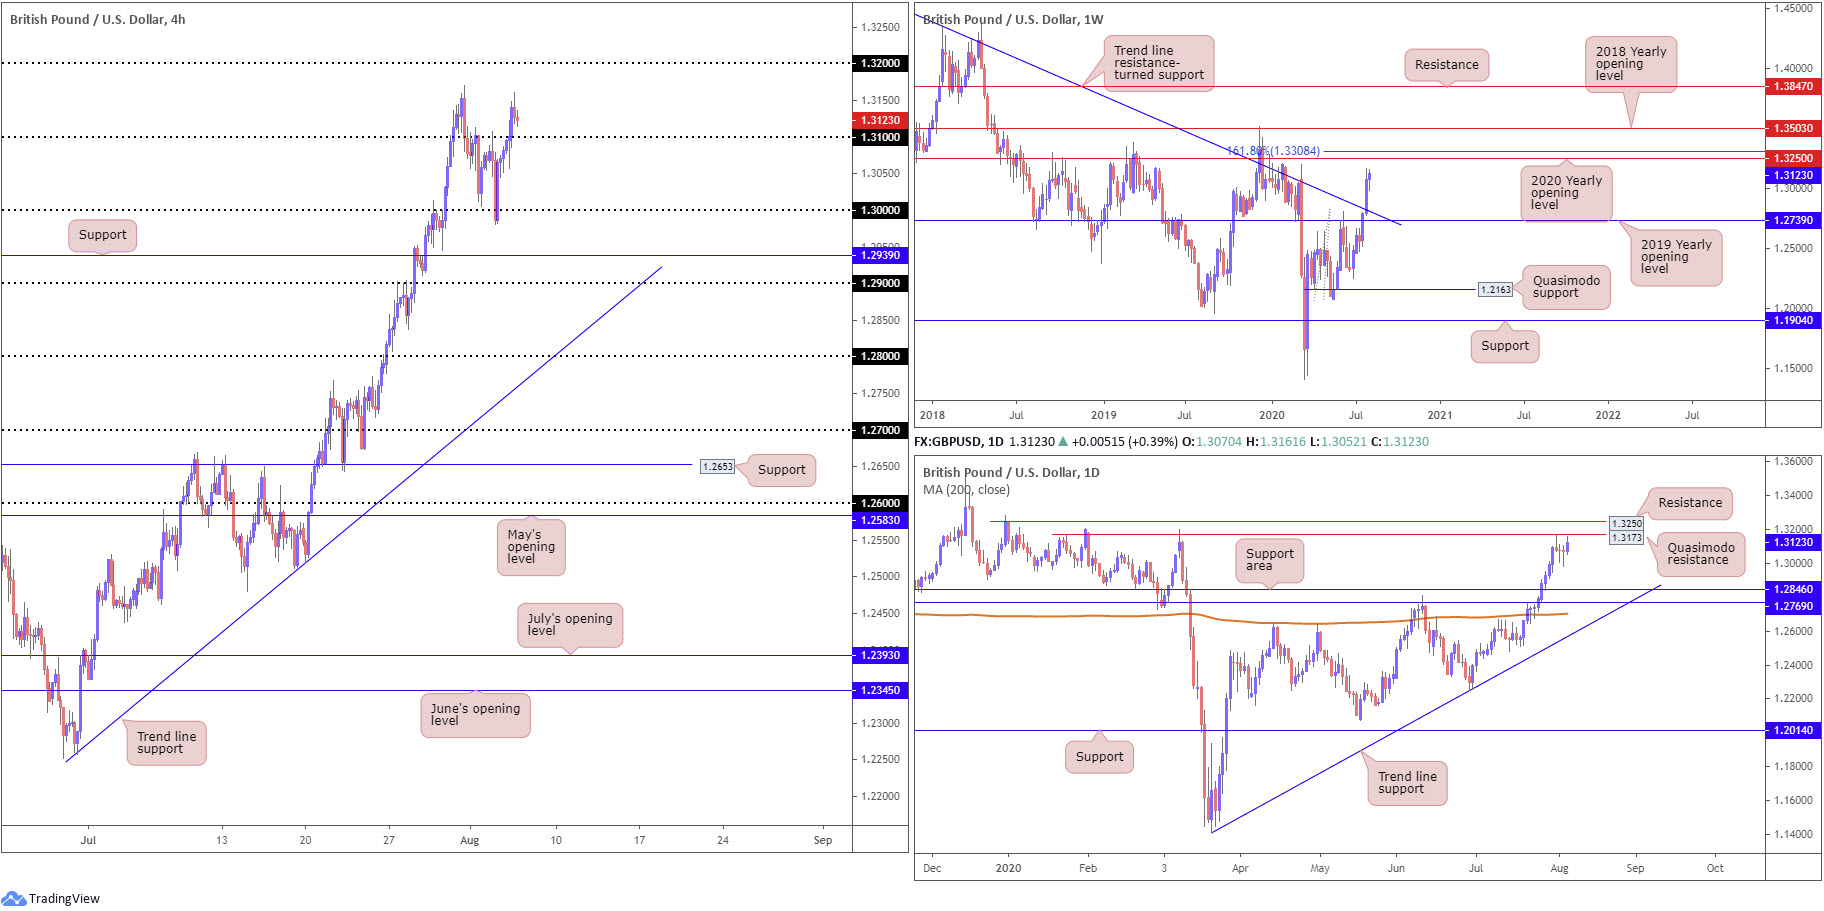
Buyers strengthened their grip Wednesday, bolstered by the DXY probing deeper waters sub 93.00. Buy-stop liquidity north of 1.31 likely fuelled the intraday advance to highs at 1.3161, before mildly turning into US hours. A 1.31 retest could, therefore, be in the offing early hours today, with an upside target set at last Friday’s high of 1.3170, followed by the 1.32 handle.
Further out on the weekly timeframe suggests we are likely to explore higher terrain, targeting the 2020 yearly opening level at 1.3250 and a 161.8% Fibonacci extension point at 1.3308. Counter to the weekly timeframe’s position, daily activity is seen fast approaching Quasimodo resistance at 1.3173.
Areas of consideration:
The recent trend line resistance break on the weekly timeframe (1.5930), despite the 1.3514 December 9 high (2019) still intact (a break of here also signals trend change to the upside), may have long-term traders consider bullish positions.
The break of 1.31 to the upside on the H4 has likely enticed intraday breakout buying, with eyeballs on Friday’s high at 1.3170 (which happens to converge closely with daily resistance marked at 1.3173). Consequently, a 1.31 retest could take shape and encourage additional buying today.
AUD/USD:
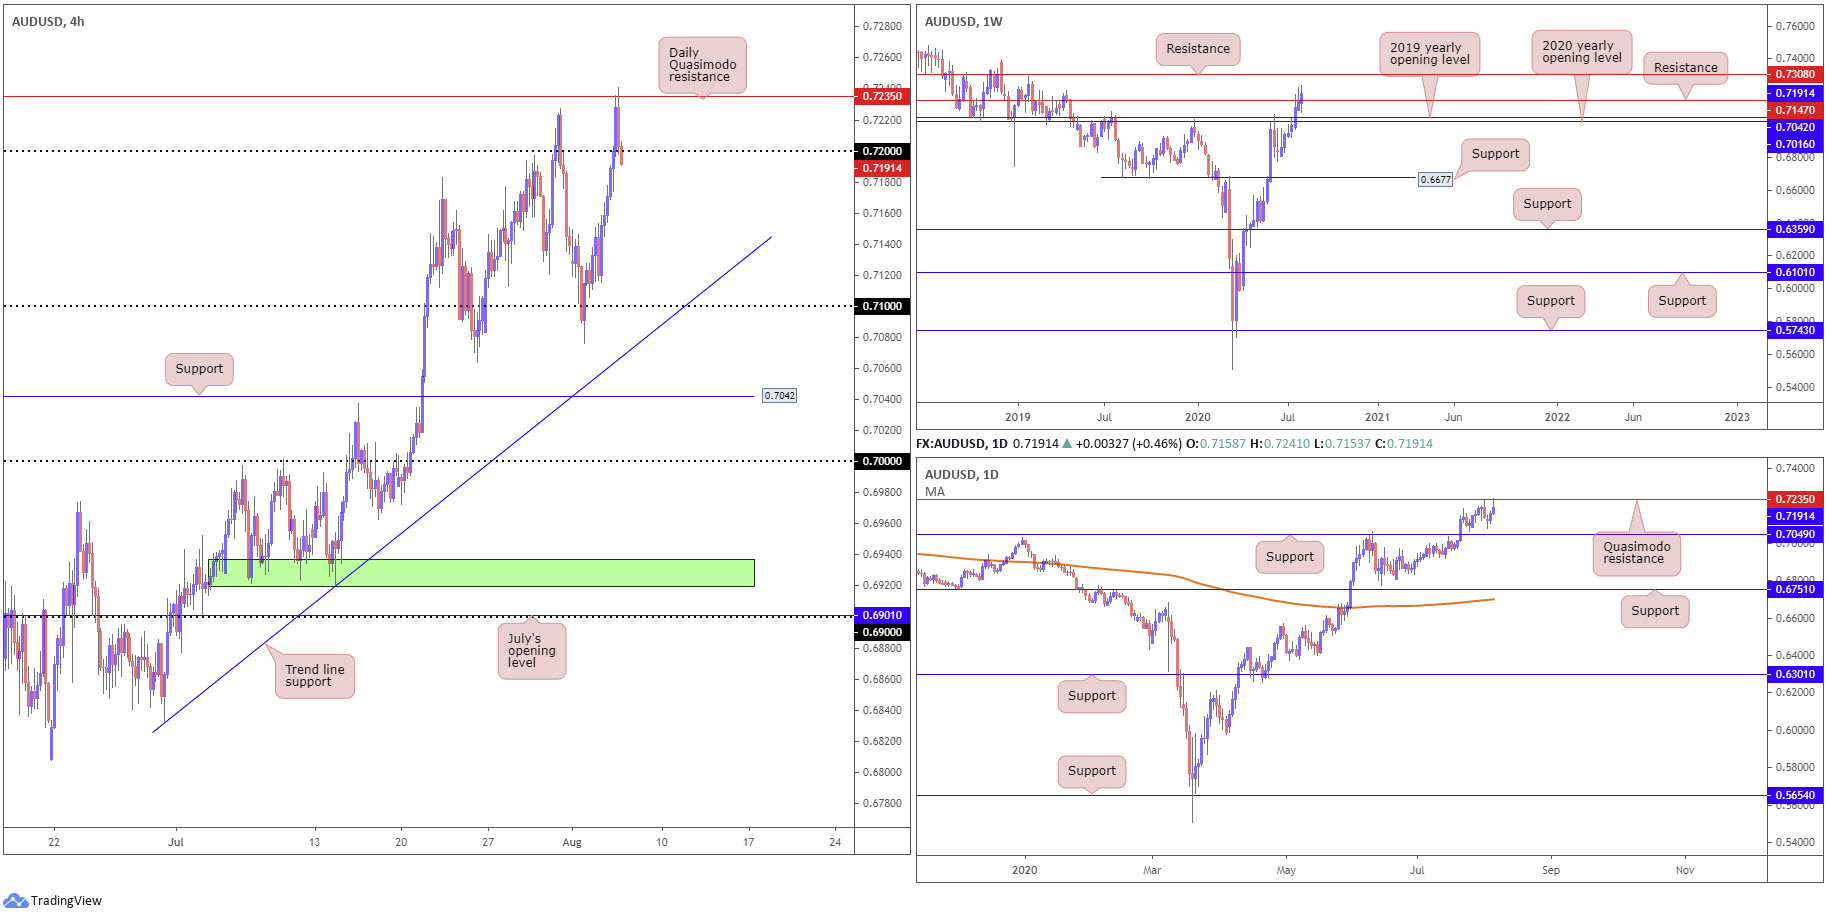
Upbeat risk sentiment carrying the US dollar index south of 93.00 had AUD/USD latch onto a healthy bid Wednesday. H4 action removed remaining stops above 0.72 and filled breakout buyers’ orders above last Friday’s high at 0.7227, resulting in daily flow shaking hands with Quasimodo resistance at 0.7235. The available (H4) buy-stop liquidity, as well as daily sellers, collectively pushed things marginally back under 0.72, which by and of itself may be interpreted as a bearish cue to head back to the 0.71 neighbourhood.
The flip side, however, shows weekly price making progress above resistance at 0.7147, potentially setting the technical stage for an approach to another layer of resistance at 0.7308.
Areas of consideration:
Daily sellers making an entrance off 0.7235 and H4 indicating the possibility of bearish scenarios emerging sub 0.72 could ignite seller interest today.
Holding above 0.72, on the other hand, is a sign sellers may be weakening off daily Quasimodo resistance at 0.7235, while weekly buyers could be gaining strength, implying a run to the 0.73ish region.
USD/JPY:
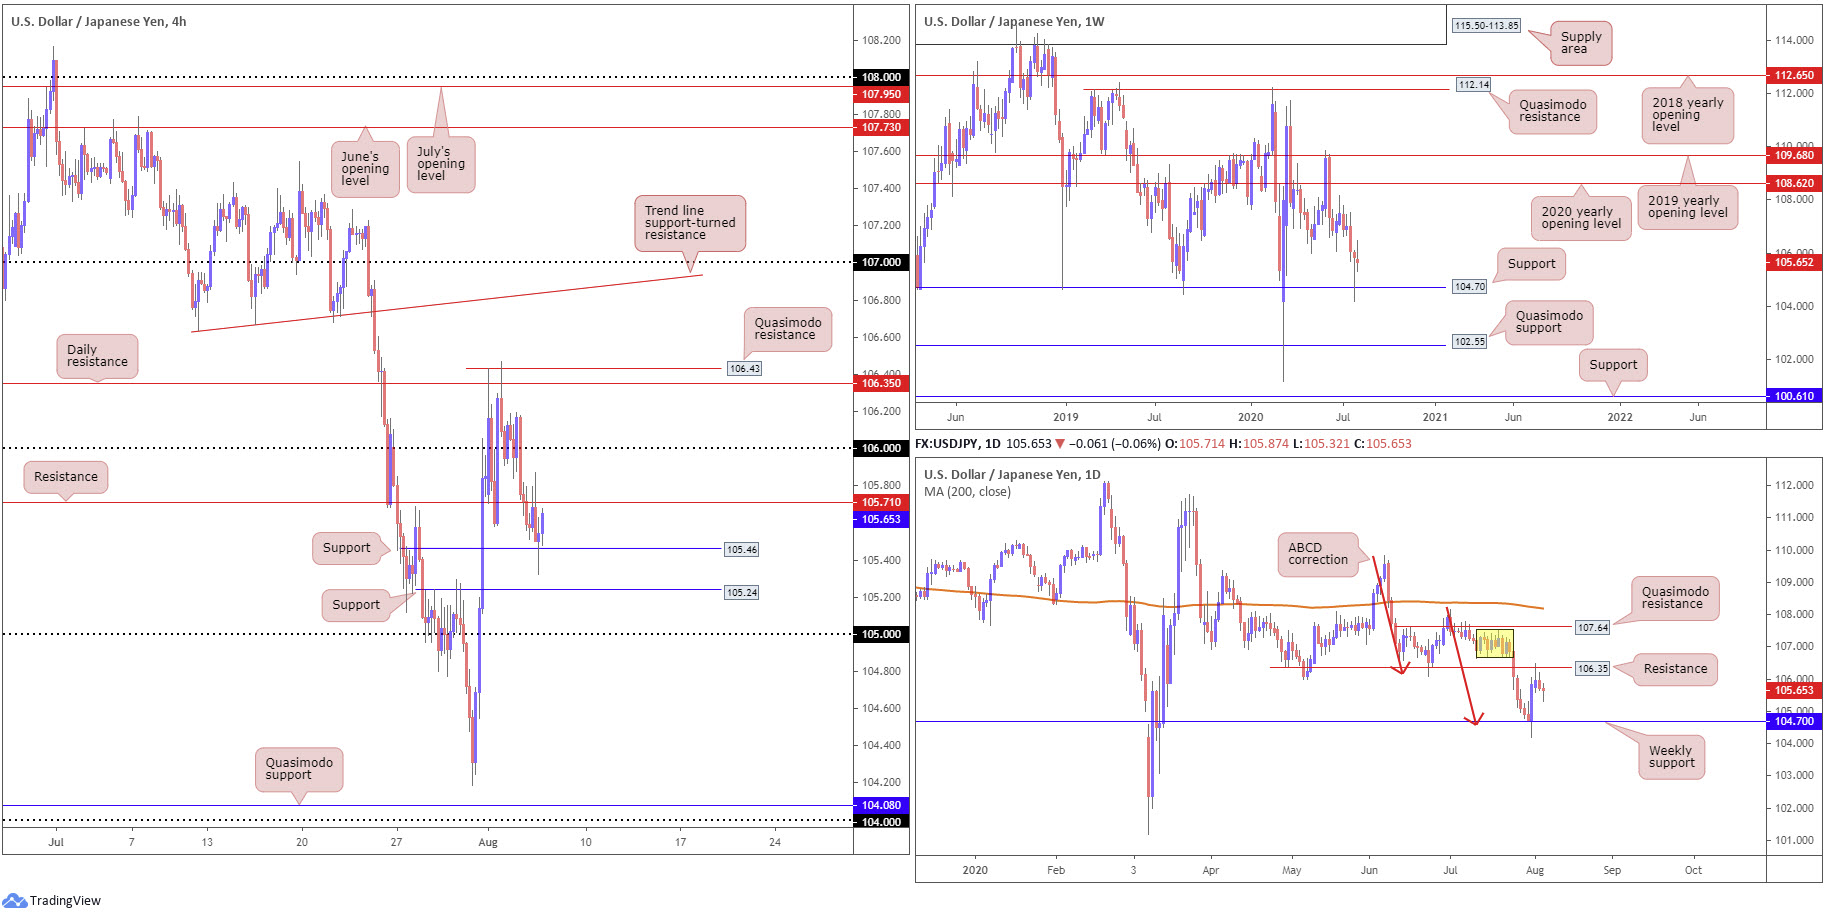
The US dollar took to lower levels against the Japanese yen on Wednesday, pencilling in a session low at 105.32. Intraday action, based on the H4 timeframe, darted through support at 105.71 and retested the latter as resistance before support at 105.46 welcomed price.
Into the second half of the US session we can see buyers, albeit following a rather vigorous downside attempt, held 105.46. This puts forward the possibility of a retest forming at resistance from 105.71, with a break uncovering the 106 neighbourhood.
Higher up on the curve, weekly movement recently pencilled in a hammer pattern last week, which is generally considered a bullish signal at troughs, off support at 104.70. Noticeable upside targets on this timeframe rest at the 2020 yearly opening level from 108.62.
As a reminder, resistance on the daily timeframe coming in at 106.35 (prior Quasimodo support) made its presence felt at the beginning of the week. Downside momentum, according to yesterday’s daily candle closing considerably off worst levels, however, reveals selling pressure may be drying up.
Areas of consideration:
Governed by the weekly timeframe rebounding from support at 104.70 and forming a bullish candlestick signal, longer-term analysis suggests the possibility of a run higher. Daily resistance at 106.35, nonetheless, has so far put a cap on upside, despite downside currently showing signs of softening.
Going on the above, H4 traders might witness price climb above resistance at 105.71 to ignite intraday bullish themes to at least 106 and, possibly daily resistance at 106.35. Conservative buyers may seek additional confirmation before pulling the trigger, waiting for a retest to form at 105.71, for example.
USD/CAD:
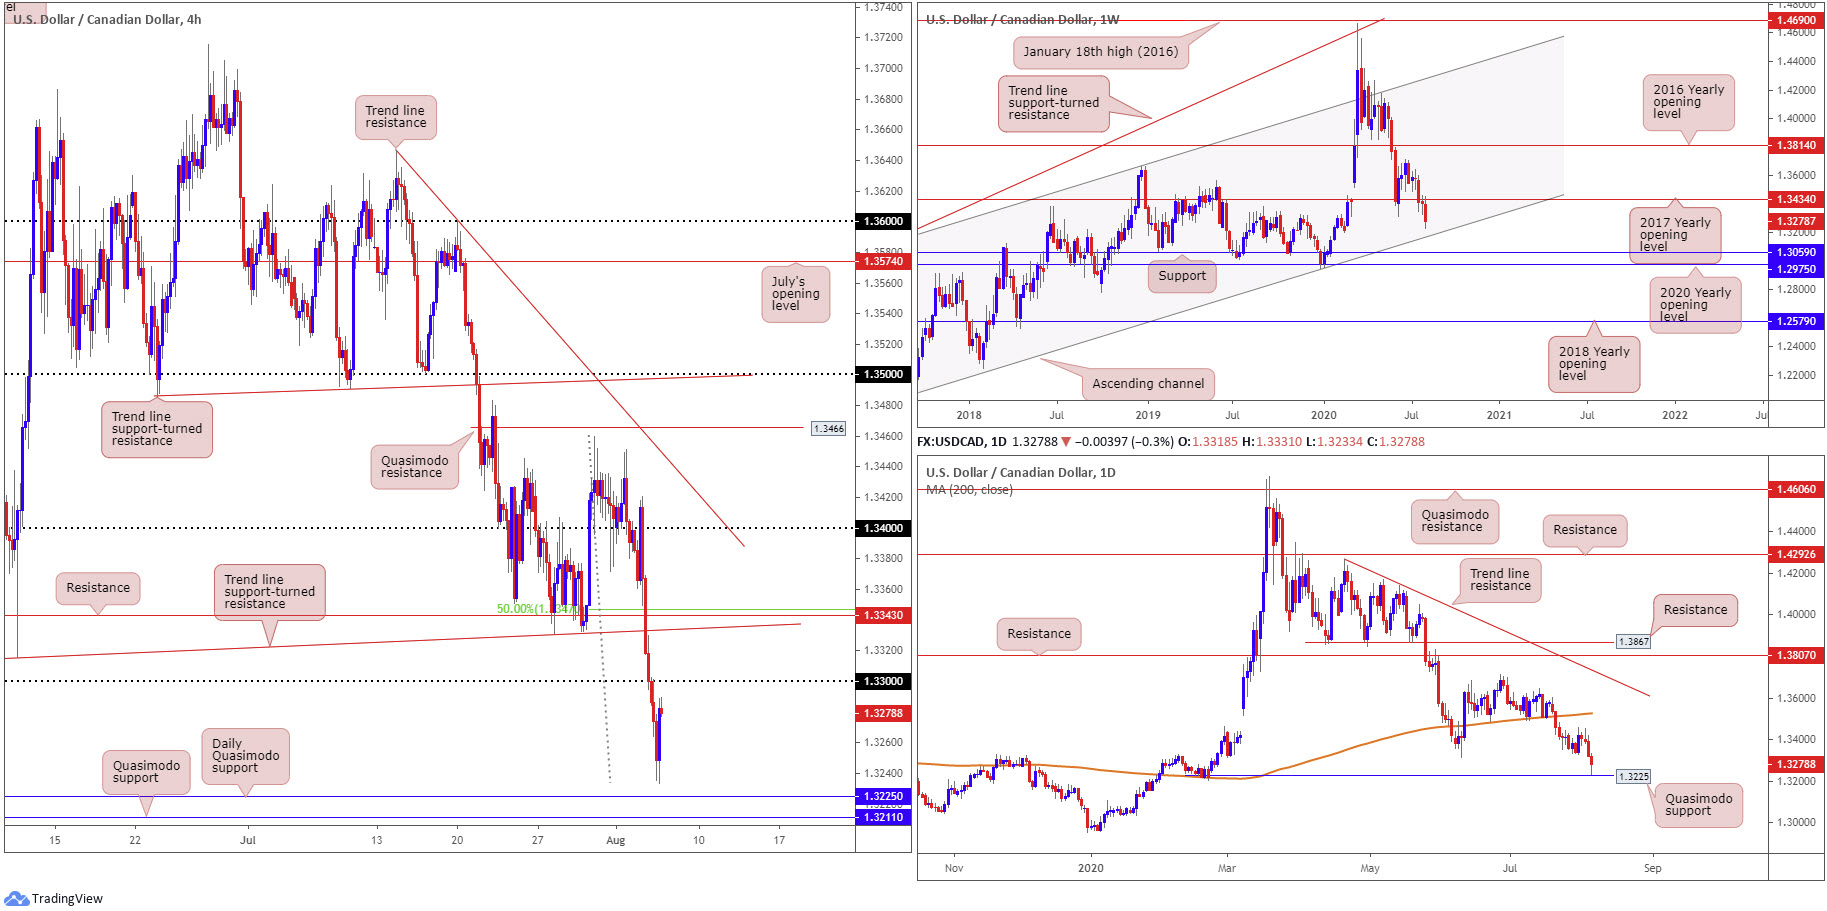
The combination of the US dollar index slicing through 93.00 and WTI reaching highs at $43.50 a barrel, led to the USD/CAD seeking deep water under the 1.33 handle on the H4 Wednesday. Despite sellers claiming most of Asian and European trading, buyers staged a healthy comeback heading into US hours, ahead of daily Quasimodo support coming in at 1.3225. Note just under the said level, a H4 Quasimodo support also rests at 1.3211, followed by the round number 1.32.
Crossing over to the weekly timeframe, after securing ground beneath the 2017 yearly opening level at 1.3434, we can see sellers display scope to extend to channel support, taken from the low 1.2061.
Areas of consideration:
With weekly price indicating sellers potentially have room to stretch their legs, and daily price yet to test Quasimodo support at 1.3225, a 1.33 retest on the H4 scale could appeal to bearish strategies today. Failure to hold at 1.33 could see H4 resistance make an appearance at 1.3343, which may also be of interest to sellers, given it holding a close connection to a H4 trend line support-turned resistance, taken from the low 1.3315, and a 50.0% retracement at 1.3347.
USD/CHF:
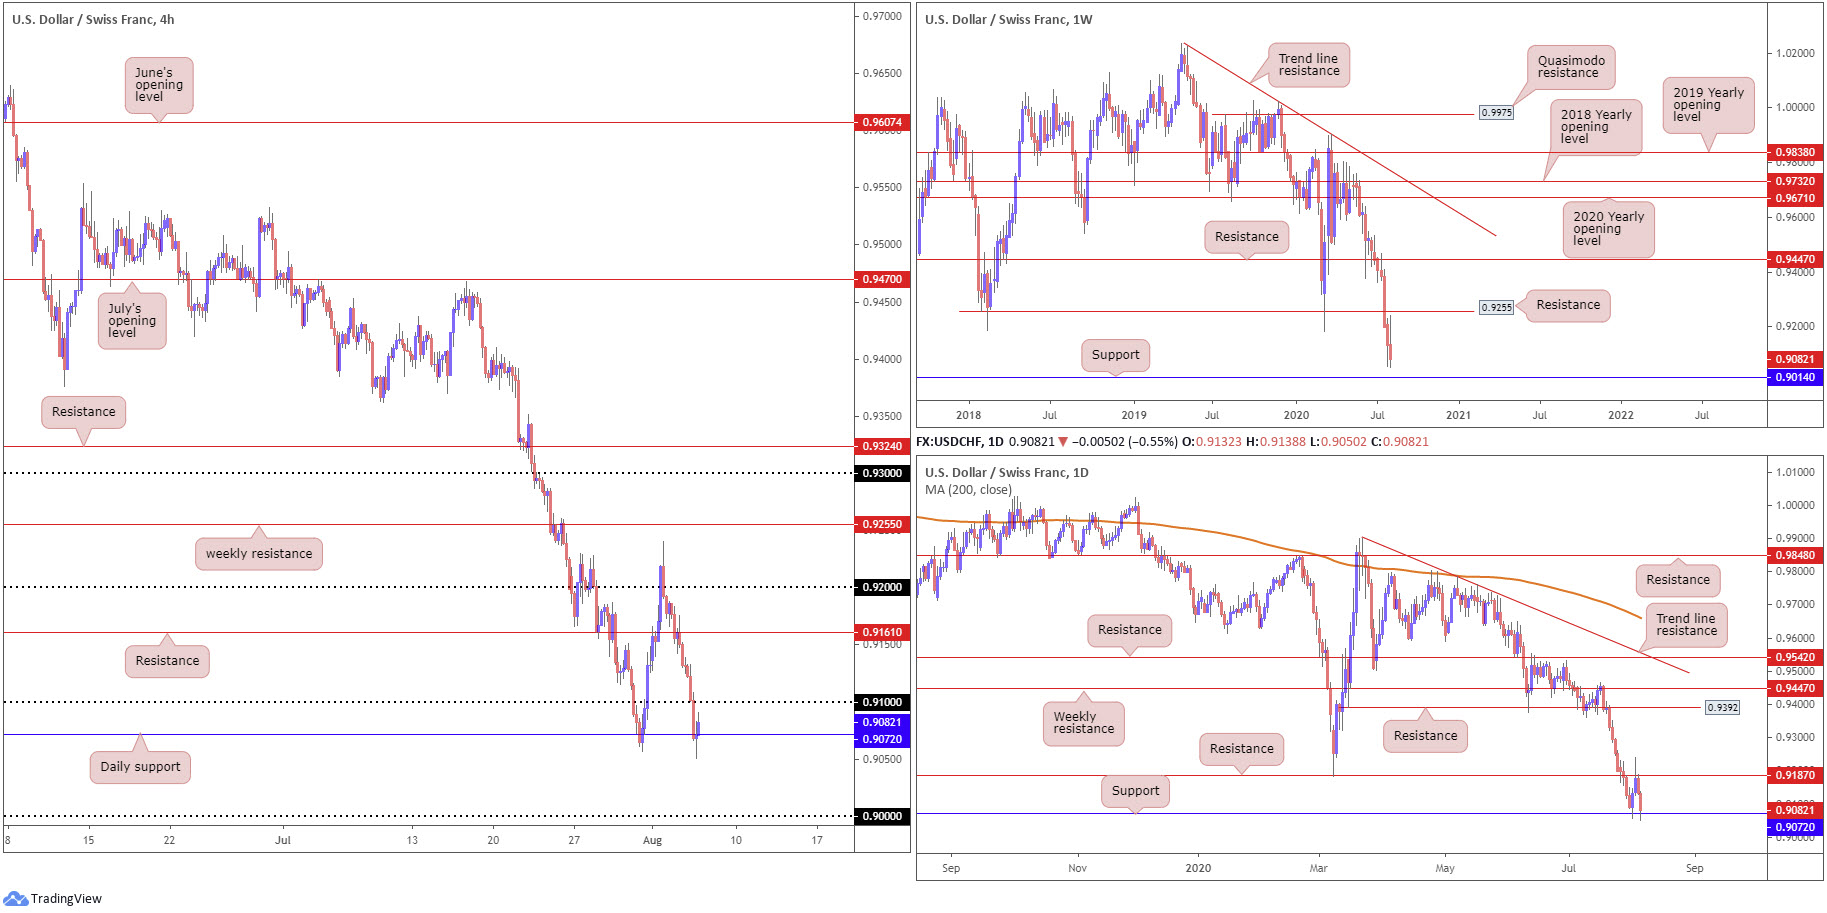
Focus remained to the downside Wednesday as USD/CHF charged the 0.91 handle. Amidst broad USD weakness and mixed US economic data, modest buying off daily support at 0.9072 swerved into view. The H4 reaction, thus far, has intraday flow toying with the idea of drawing 0.91 into the frame as resistance.
Should sellers move things into a higher gear today, as weekly price suggests given the open space on the weekly timeframe to support at 0.9014, the key figure 0.90 will be a key talking point. It is also worth noting that weekly candles are coming off a whopping six-week decline.
Areas of consideration:
It all comes down to weekly support priced in at 0.9014 and the current daily support at 0.9072 today.
In line with the underlying downtrend, 0.91 on the H4 timeframe is likely to present a robust resistance point, enough to potentially push through daily support at 0.9072 towards the 0.90 neighbourhood. With that being the case, conservative traders may seek bearish scenarios under daily support, while the more aggressive trader may attempt to fade 0.91. Irrespective of the entry point, the downside target rests at weekly support from 0.9014/0.90 handle (H4).
Dow Jones Industrial Average:
Major US benchmarks lifted across the board Wednesday amid upbeat service sector data. The Dow Jones Industrial Average climbed 373.05 points, or 1.39%; the S&P 500 rallied 21.26 points, or 0.64%, and the tech-heavy Nasdaq 100 concluded higher by 28.90 points, or 0.26%.
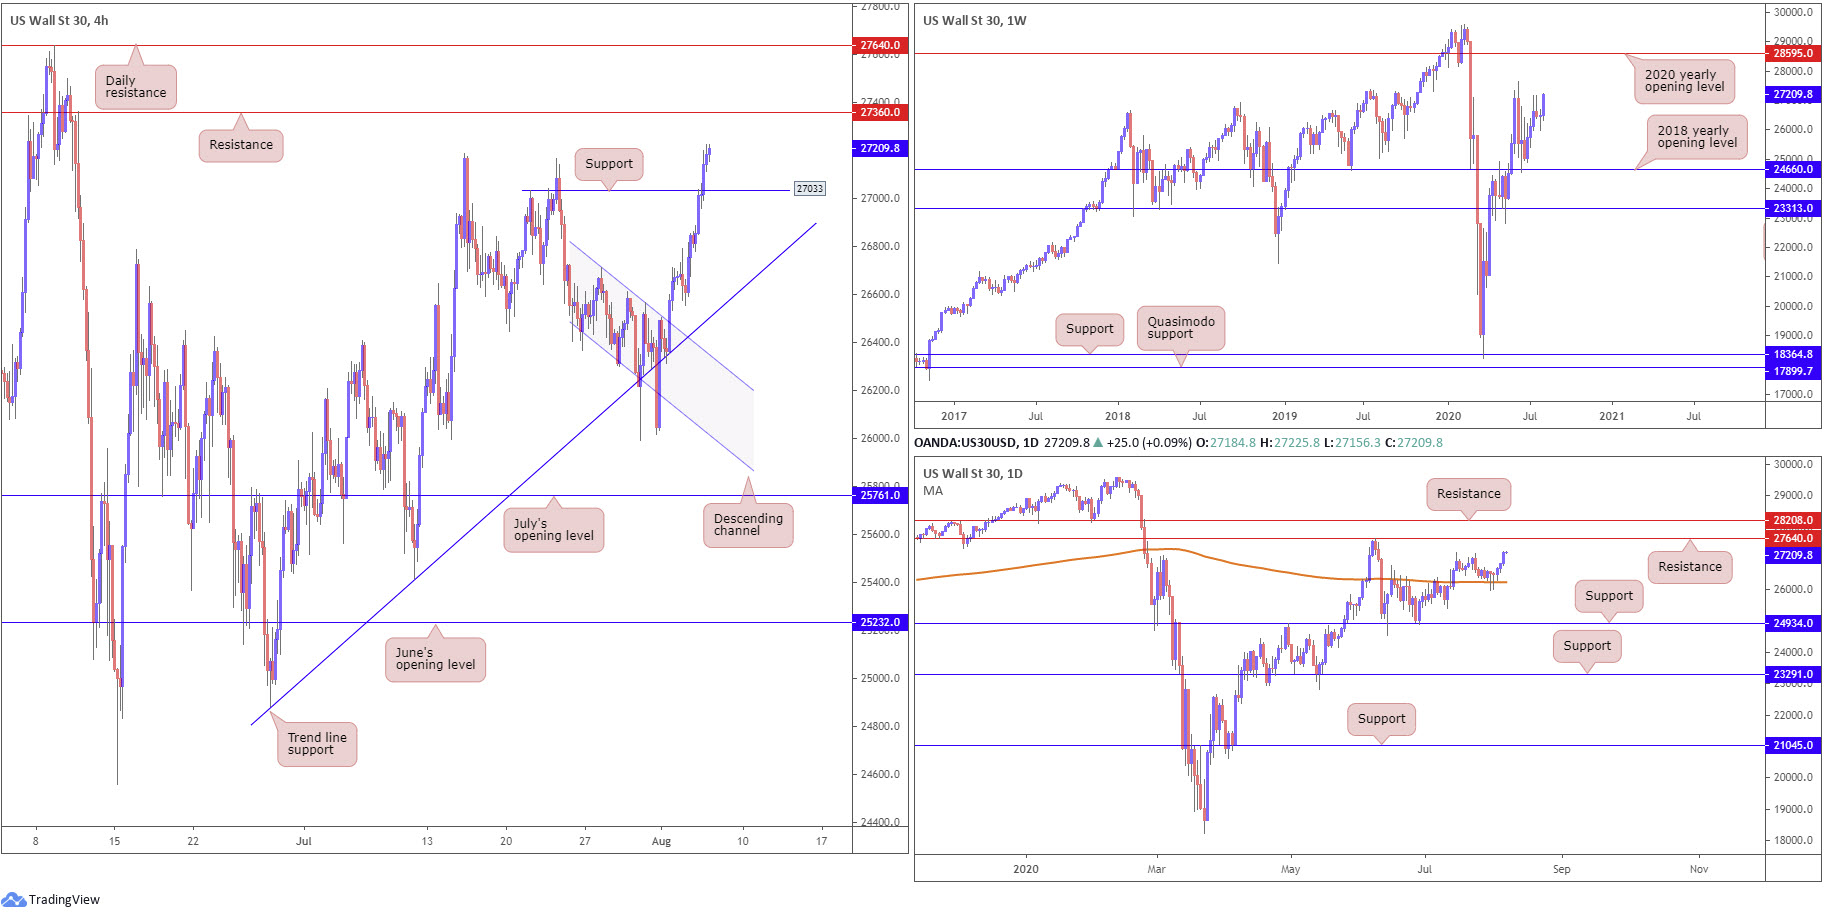
After splitting channel resistance, extended from the high 26712 on the H4 timeframe, traders, as anticipated in previous reports, welcomed an extension to the upside. In recent hours, price worked through Quasimodo resistance at 27033, breaking its high point at 27169 which invalidates the level. 27033 now serves as support as we look toward resistance coming in at 27360, with a break exposing daily resistance at 27640.
From the weekly timeframe, after rebounding from the 2018 yearly opening level at 24660 mid-June, the technical landscape is poised to pull in the 27638 high, followed by a plausible run to the 2020 yearly opening level at 28595.
In the form of two back-to-back hammer candlestick patterns, both of which retested the 200-day SMA (orange – 26246), we have seen daily flow seek higher levels, in the shape of three back-to-back bullish candles. As briefly touched on above, resistance at 27640 is seen as the next upside target, followed by a potential run to another resistance coming in at 28208.
Areas of consideration:
With technical charts primed for further buying, all eyes are potentially on H4 resistance priced in at 27360. It is unlikely the noted resistance will produce much for sellers, as according to both weekly and daily charts the next point of interest falls in at 27640 (daily resistance). Buyers, therefore, could make a show in the event of a H4 close above 27360, targeting the aforementioned daily resistance. Conservative traders may choose to drill down to the lower timeframes to secure an entry; others may require a H4 retest to form at 27360 before engaging.
XAU/USD (GOLD):
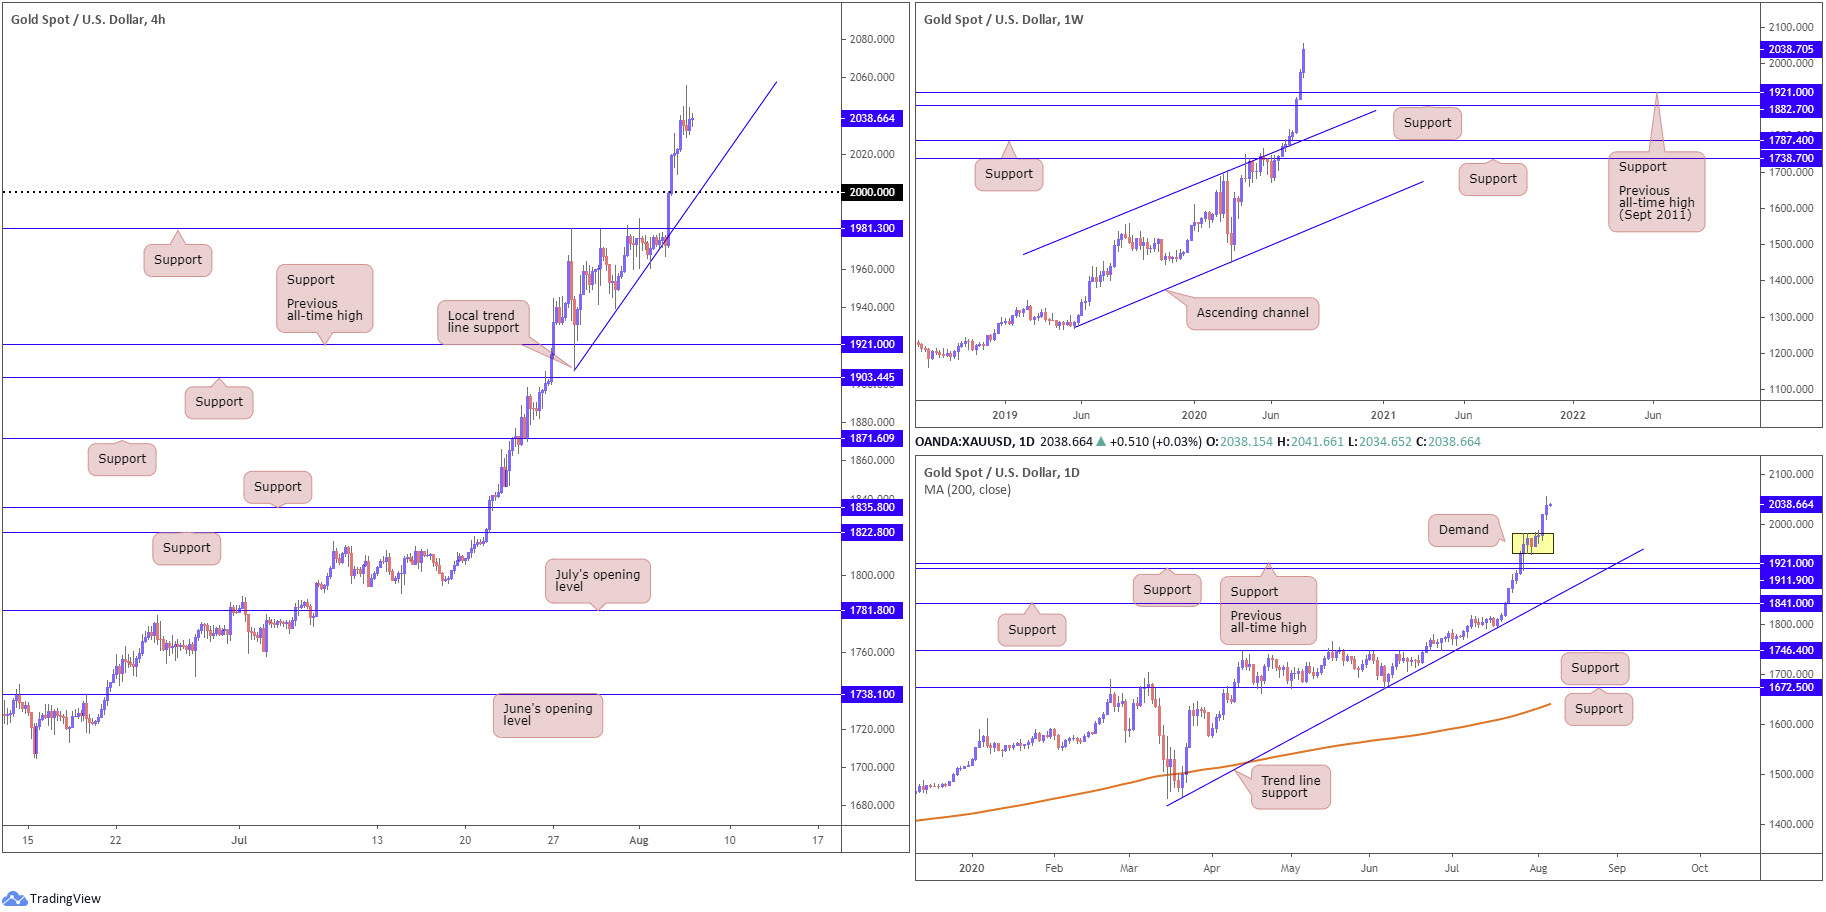
Following Tuesday overthrowing the $2,000 milestone, Wednesday rose to fresh all-time peaks at $2055.9 a troy ounce. The precious metal has advanced 13 days out of 14, with technical traders long from local H4 trend line support, extended from the low 1907.0, cheering recent sentiment.
From the weekly timeframe, traders are urged to pencil in the possibility of a retest as far south as 1921.0, the previous all-time high point (September 2011).
A little bit closer to home, we can see daily flow projects price will likely cross swords with demand (yellow) at 1941.1-1981.2, if a retreat comes to pass.
Across the page on the H4, local trend line support, taken from the low 1907.0, proved a stable platform for buyers in recent trading – this was a noted base to keep a tab on in previous analysis. The aforementioned trend line support likely remains a watched base for bullish scenarios today, while a break pulls across the possibility of a 2000.0 retest.
Areas of consideration:
Further buying remains likely in this market.
Responding from local H4 trend line support, in the shape of a notable H4 bullish candlestick signal, is likely sufficient to ignite additional intraday bullish strategies today. Breaking the said level and reaching for 2000.0 is equally likely to draw in dip-buying themes.
The accuracy, completeness and timeliness of the information contained on this site cannot be guaranteed. IC Markets does not warranty, guarantee or make any representations, or assume any liability regarding financial results based on the use of the information in the site.
News, views, opinions, recommendations and other information obtained from sources outside of www.icmarkets.com.au, used in this site are believed to be reliable, but we cannot guarantee their accuracy or completeness. All such information is subject to change at any time without notice. IC Markets assumes no responsibility for the content of any linked site.
The fact that such links may exist does not indicate approval or endorsement of any material contained on any linked site. IC Markets is not liable for any harm caused by the transmission, through accessing the services or information on this site, of a computer virus, or other computer code or programming device that might be used to access, delete, damage, disable, disrupt or otherwise impede in any manner, the operation of the site or of any user’s software, hardware, data or property.


