
Key risk events today:
EU Economic Forecasts; BoE Monetary Policy Report; MPC Official Bank Rate Votes; BoE Monetary Policy Summary and Bank Rate Decision; MPC Asset Purchase Facility Votes; BoE Gov Bailey Speaks; US Unemployment Claims; FOMC Statement, Federal Funds Rate and Press Conference.
(Previous analysis as well as outside sources – italics).
EUR/USD:
Wednesday exhibited choppy behaviour, with traders clearly undecided right now as ballot counting continues in the US. DXY ended modestly positive around 93.50.
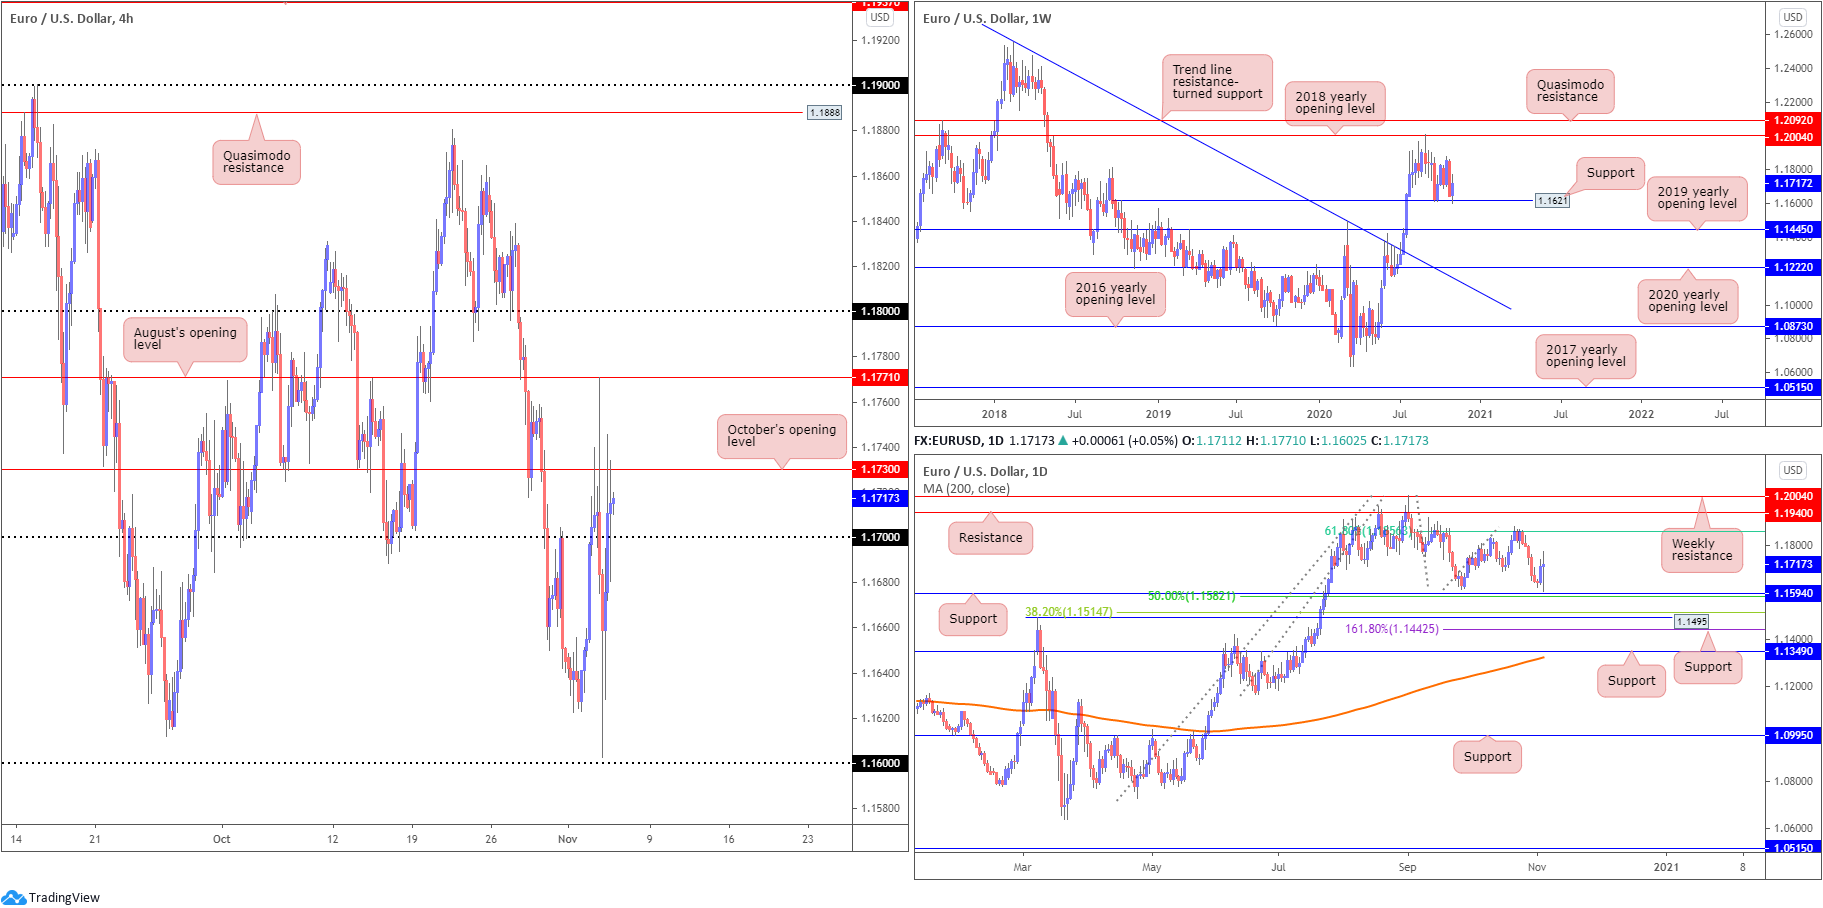
Following an aggressive push to the 1.16 neighbourhood, EUR/USD staged an equally aggressive pullback to above the 1.17 handle, currently trading unchanged on the day. North of here, we can see October’s opening value at 1.1730, followed by August’s opening value at 1.1771 and then the 1.18 handle.
From the weekly timeframe, price continues to feed off support at 1.1621. Continued buying from here could eventually see price pursue the 2018 yearly opening value at 1.2004, while dipping a toe in lower territory shines the spotlight on the 2019 yearly opening value at 1.1445.
Crossing over to the daily timeframe, we can also see price found demand north of support at 1.1594 and nearby 50.0% retracement ratio at 1.1582 yesterday (formed in the shape of a long-legged doji candle), with further buying to potentially reach for the 61.8% Fibonacci retracement ratio at 1.1856.
Areas of consideration:
- Technical support seen on weekly and daily timeframes indicate moves above October’s opening value at 1.1730 could be seen on the H4 to approach August’s opening value at 1.1771 and 1.18 handle. As volatility is unlikely to subside today, conservative traders may seek at least a 1.17 retest before committing; others may be watching for a H4 close to form above 1.1730.
GBP/USD:
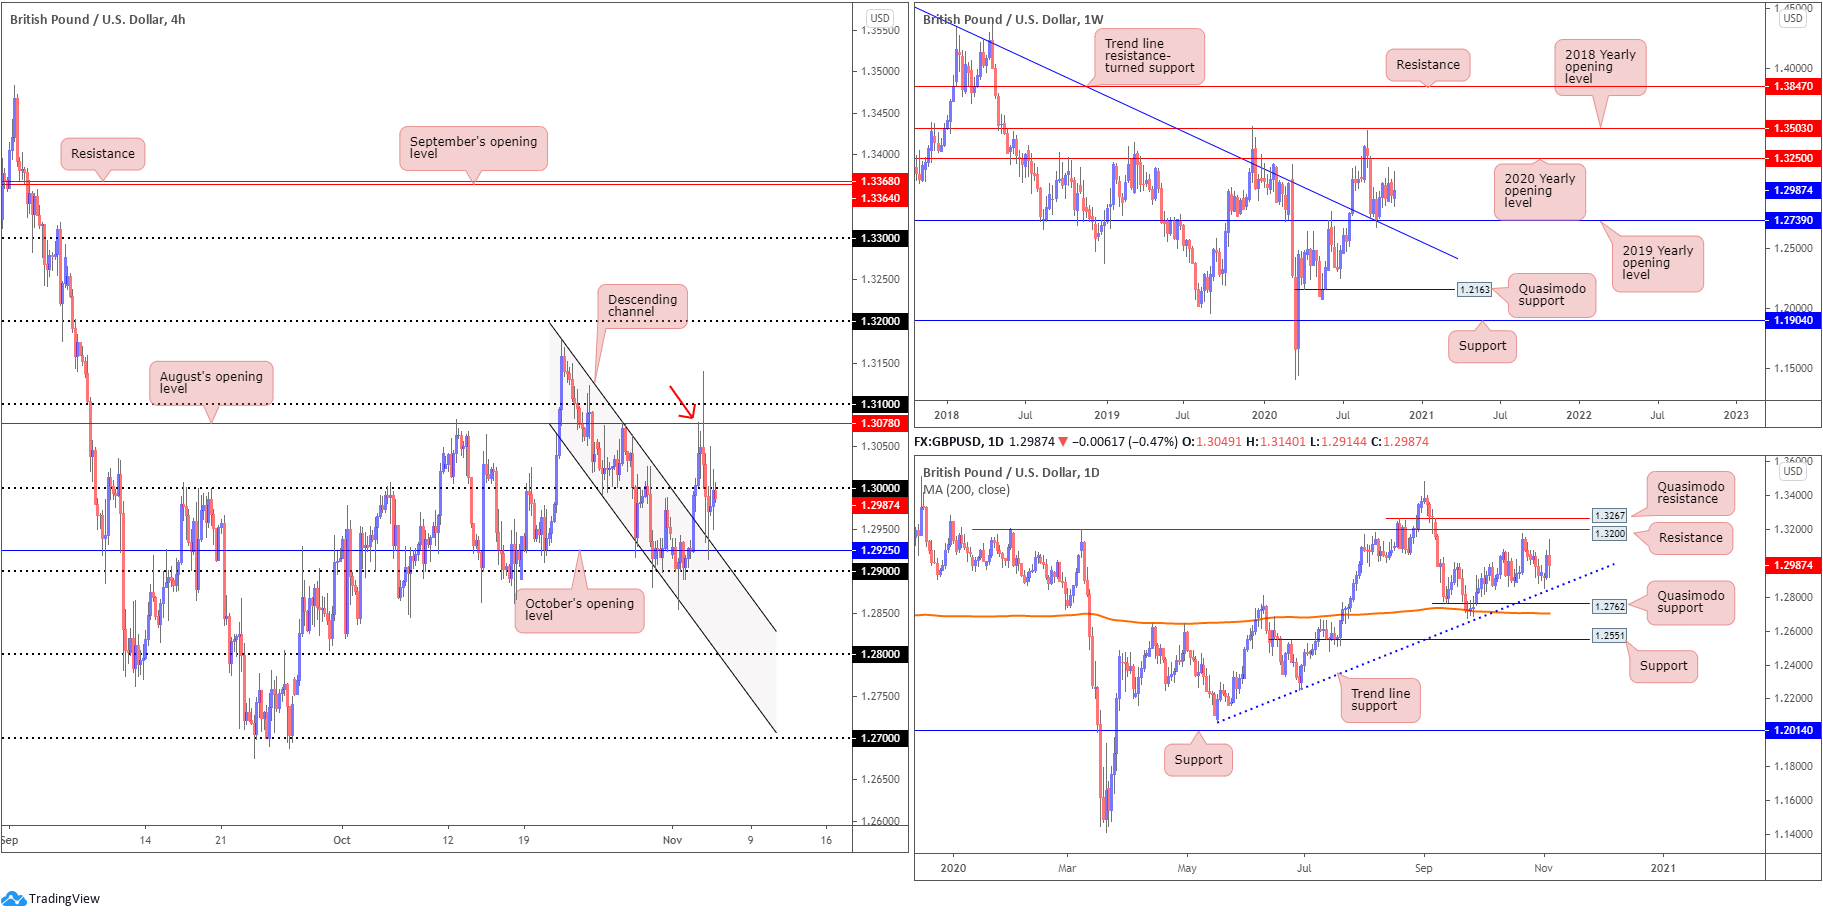
Cable came under pressure Wednesday after failing to sustain gains north of 1.31, fading session peaks at around 1.3139. This invited sellers back under the key figure 1.30 to shake hands with October’s opening value at 1.2925 and merging channel resistance-turned support, extended from the high 1.3176 (both areas sited just ahead of the 1.29 vicinity). As you can see, though, we are currently toying with the underside of 1.30 as we look to enter Thursday’s sessions.
Higher timeframe technical levels are, despite Wednesday’s volatility, unchanged.
Weekly price could pop either way with resistance seen at the 2020 yearly opening value from 1.3250, and support coming in from 1.2739, a 2019 yearly opening value that blends closely with trend line resistance-turned support, extended from the high 1.5930. It is also worth pointing out the aforementioned trend line was engulfed in July of this year, announcing an uptrend could be on the cards. From the daily timeframe, after recently coming within touching distance of trend line support, extended from the low 1.2075, resistance at 1.3200 is seen as the next upside base.
Areas of consideration:
- As price holds the underside of 1.30, this, alongside a H4 bearish candlestick formation, could be sufficient evidence to suggest moves back to 1.29.
- The combination of 1.29, October’s opening value at 1.2925 and the H4 channel resistance-turned support is an area to be mindful of.
- 31 and August’s opening value at 1.3078 is interesting on the H4, which happens to converge with a somewhat hidden Quasimodo resistance (red arrow – seen clearer on H1).
AUD/USD:
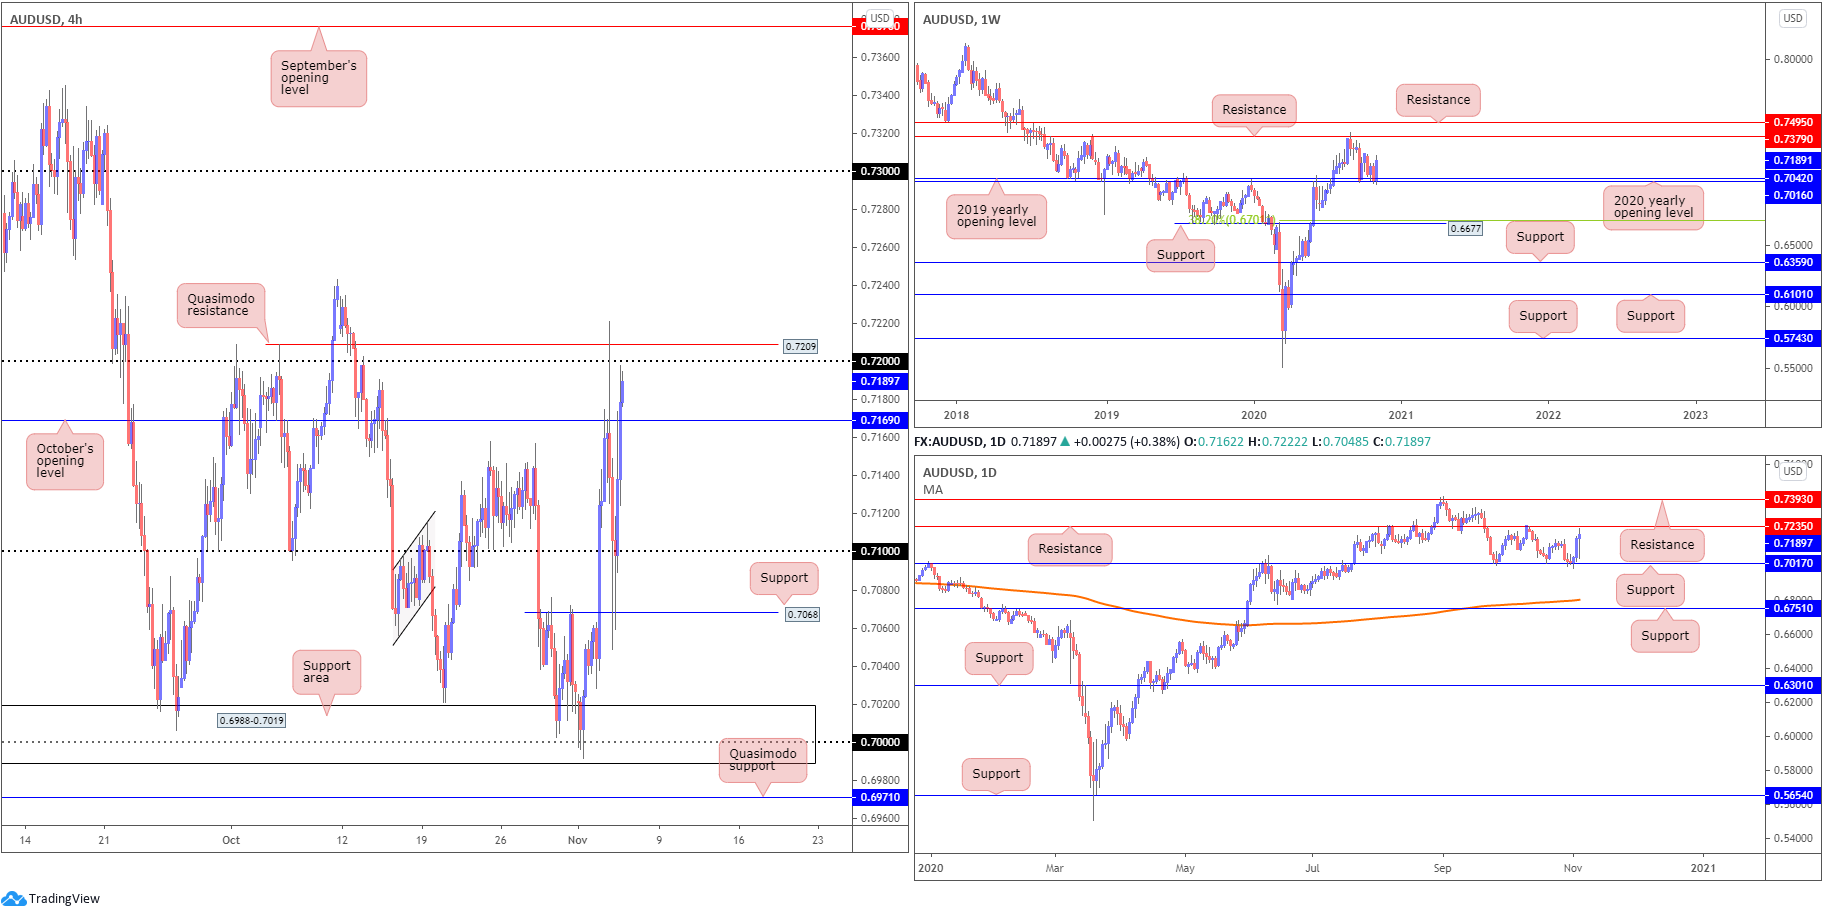
Price action remains respective of the 2020 (0.7016) and 2019 (0.7042) yearly opening values on the weekly timeframe, with current price smothering the prior week’s losses. Weekly resistance at 0.7379 lines up as the next upside hurdle. It should also be pointed out that the trend in this market remains to the upside.
In partnership with weekly supports, support on the daily timeframe recently made an appearance at 0.7017, perhaps reigniting interest at resistance from 0.7235. Dipping a toe in waters north of the latter, could have price make its way towards resistance at 0.7393.
Sellers lost their flavour after crossing swords with H4 support at 0.7068 on Wednesday, leading to a rigorous recovery back above 0.71 and October’s opening value at 0.7169. This places 0.72 in the frame today, closely followed by Quasimodo resistance at 0.7209.
Areas of consideration:
With more volatility potentially on the horizon, 0.72 and Quasimodo resistance at 0.7209 are watched resistances, closely reinforced by daily resistance at 0.7235. However, attempting to secure a bearish position from here could be difficult, knowing we’re coming from weekly support.
USD/CHF:
For those who read Wednesday’s technical briefing you may recall the following (italics):
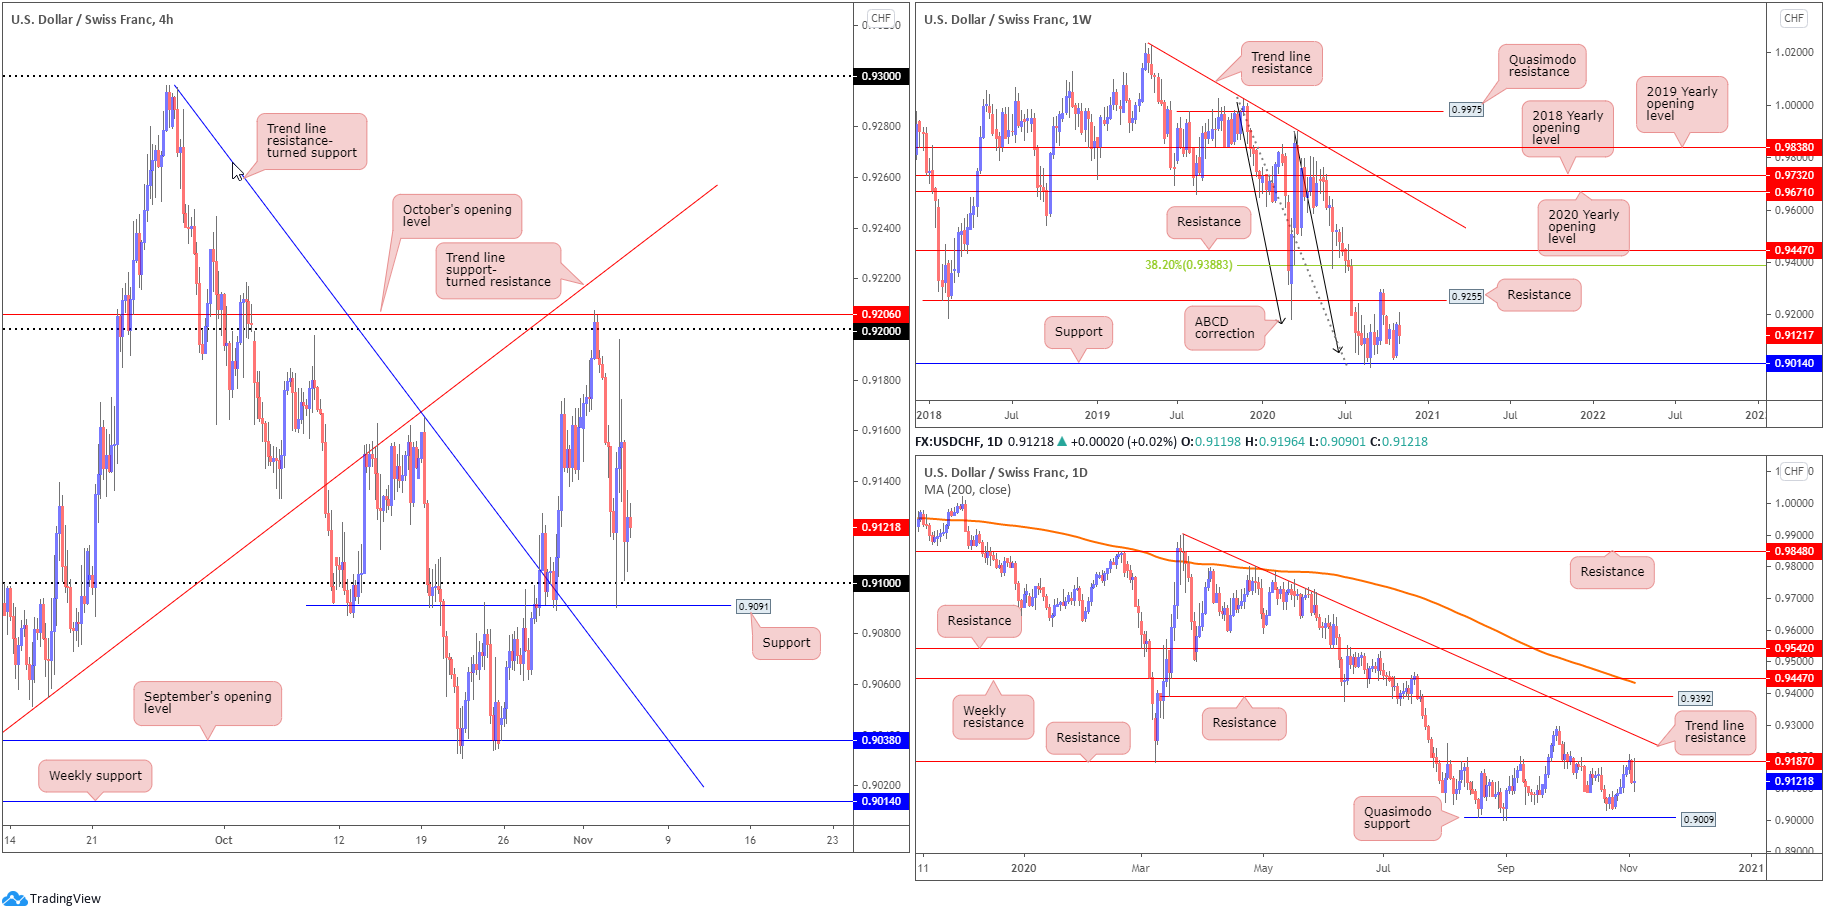
Tapping sell-stop liquidity beneath 0.91 and drawing in fresh buyers off H4 support at 0.9091 could lead to an intraday push for higher levels today. With higher timeframes lacking support, however, the advance could be short-lived.
As evident from the H4 chart, buyers lifted USD/CHF north of 0.91 Wednesday, fuelled on the back of sell-stop LQ beneath 0.91 and fresh buying off support from 0.9091. Price, as you can see, rushed to peaks just south of the 0.92 handle and October’s opening value at 0.9206, before collapsing to daily opening levels ahead of 0.91.
The technical picture offered from the daily timeframe reveals price to be languishing beneath resistance at 0.9187, with additional weakness eyeing Quasimodo support at 0.9009. Interestingly, the weekly timeframe places a question mark on current daily resistance, having seen weekly resistance set higher at 0.9255, a previous Quasimodo support level. Should daily sellers strengthen their grip, nevertheless, weekly support is first on tap at 0.9014, fixed just above the aforementioned daily Quasimodo support.
Areas of consideration:
- The combination of 0.9091 and 0.91 on the H4 remains a support area to watch.
- Pressuring sub 0.9091 could ignite bearish scenarios, targeting September’s opening value at 0.9038 on the H4, coupled with trend line resistance-turned support, taken from the high 0.9295. The latter is, of course, sponsored by daily price rejecting resistance at 0.9187.
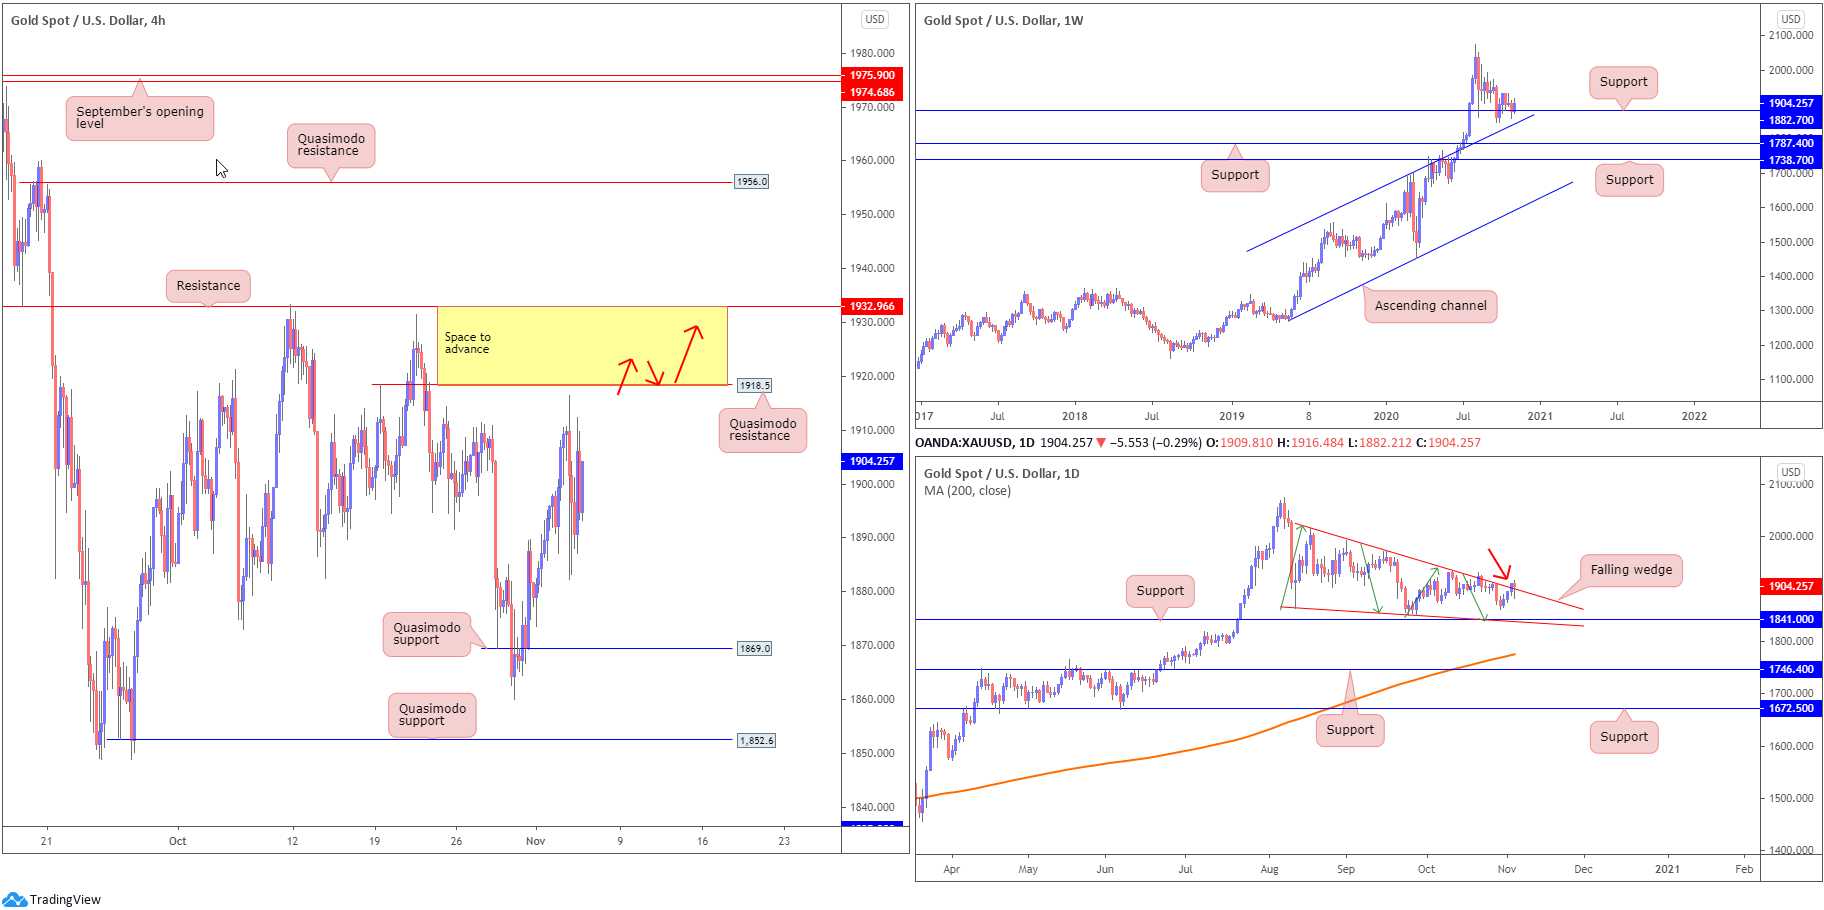
XAU/USD (GOLD):
Election ebb and flow witnessed the precious metal whipsaw between $1,916 and $1,882 on Wednesday, coming within striking distance of testing Quasimodo resistance from $1,918 on the H4 scale.
The technical outlook, nonetheless, remains unchanged heading into Thursday.
The weekly timeframe remains balanced off support at $1,882, recognised just north of channel resistance-turned support, taken from the high $1,703. Should a wave of buying emerge, long-term traders’ crosshairs are likely focussed on the all-time peak $2,075.
The daily timeframe has been in the process of creating a falling wedge pattern between $2,015 and $1,862 since mid-August (the lower boundary also lines up closely with support at $1,841). Given the tentative close above the upper boundary on Tuesday (red arrow), together with gold trending decisively higher since 2016 (although price has been trending higher much longer than this overall), this may be interpreted as a bullish continuation signal.
Near-term levels to watch on the H4 chart are Quasimodo resistance around $1,918 and Quasimodo support at $1,869. A break higher could target resistance at $1,932, while beneath $1,869 another Quasimodo support is seen at $1,852.
Areas of consideration:
- Long term, the breakout above the daily falling wedge could spark bullish moves off weekly support ($1,882). This may have candles eventually reach for unchartered territory north of $2,075.
- Assuming longer-term bulls make an appearance, a H4 close above Quasimodo resistance at around $1,918 may ignite intraday bullish breakout strategies in favour of at least H4 resistance from $1,932. A retest at $1,918 as support (red arrows) may also convince conservative players to get involved.
The accuracy, completeness and timeliness of the information contained on this site cannot be guaranteed. IC Markets does not warranty, guarantee or make any representations, or assume any liability regarding financial results based on the use of the information in the site.
News, views, opinions, recommendations and other information obtained from sources outside of www.icmarkets.com.au, used in this site are believed to be reliable, but we cannot guarantee their accuracy or completeness. All such information is subject to change at any time without notice. IC Markets assumes no responsibility for the content of any linked site.
The fact that such links may exist does not indicate approval or endorsement of any material contained on any linked site. IC Markets is not liable for any harm caused by the transmission, through accessing the services or information on this site, of a computer virus, or other computer code or programming device that might be used to access, delete, damage, disable, disrupt or otherwise impede in any manner, the operation of the site or of any user’s software, hardware, data or property


