
Key risk events today:
OPEC Meetings; Canada Trade Balance.
EUR/USD:
(Italics represents previous writing).
Europe’s shared currency strengthened vs. the US dollar Wednesday, following weaker-than-expected US ADP employment, and peaked at 1.1116 after a disappointing US ISM non-manufacturing PMI reading.
Previous analysis stated the following:
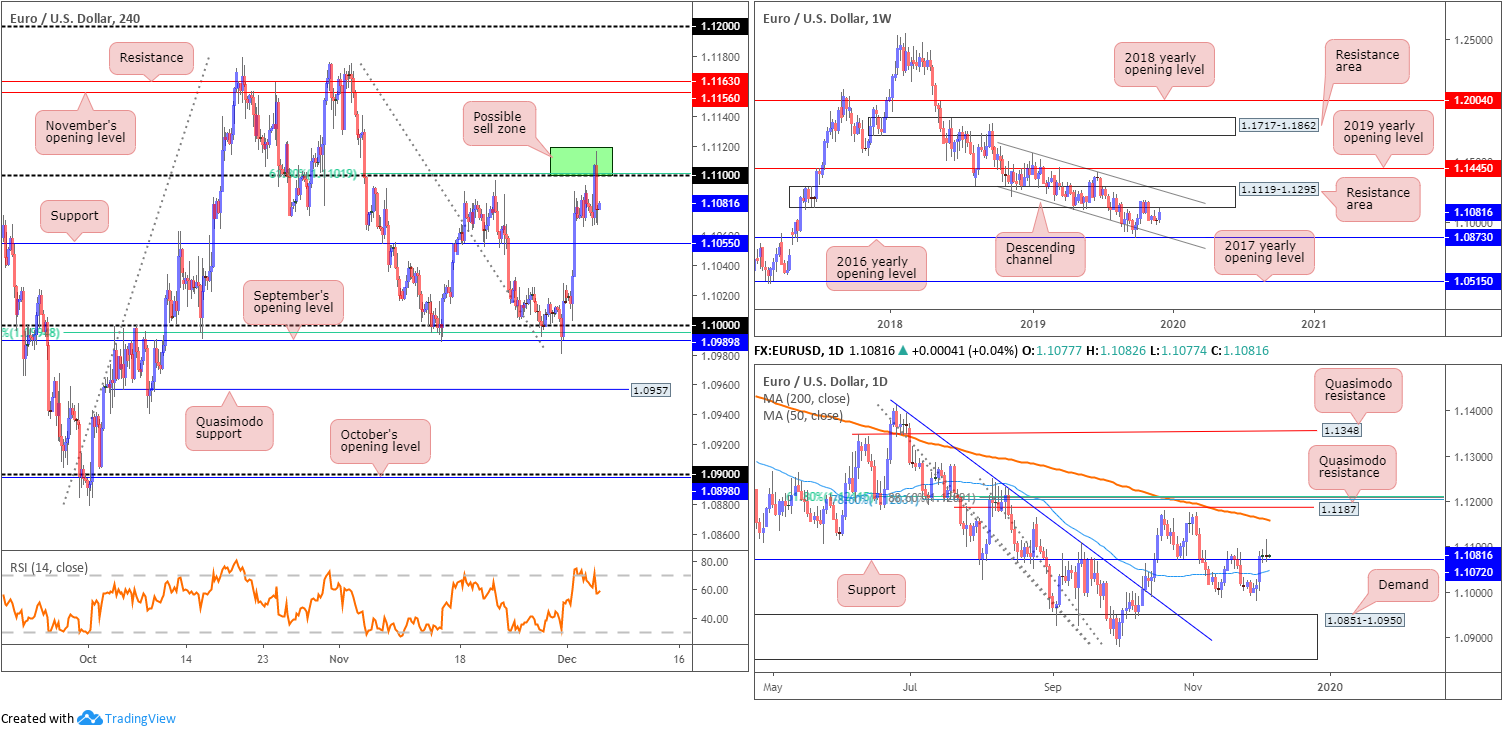
The weekly timeframe remains loitering south of a long-standing resistance area at 1.1119-1.1295. Since November 2018, the pair has also remained compressed within a descending channel on this scale, moulded from a high set at 1.1569 and a low of 1.1109. Based on this scale, support is not expected to emerge until the lower boundary of the descending channel, which happens to merge closely with the 2016 yearly opening level at 1.0873. In addition to structure, the primary downtrend has been in motion since topping in early 2018 at 1.2555.
Interestingly, movement on the daily timeframe has price trading north of support coming in at 1.1072. Continued bidding from this point could push as far north as the 200-day SMA (orange – 1.1161), closely trailed by Quasimodo resistance at 1.1187.
Meanwhile, across the page on the H4 timeframe, the unit consolidates a few points south of the 1.11 handle, set as the next possible ceiling in this market.
The area marked in green on the H4 timeframe between 1.1119 (the underside of the weekly resistance area) and the 1.11 handle signifies a probable resistance zone, with H4 support at 1.1055 fixed as the initial target. Fibonacci studies also show the 61.8% ratio converges closely with the round number 1.11 at 1.1102.
Areas of consideration:
As evident from the charts this morning, the H4 candles reversed from 1.1119/1.11 and steadied around the 1.1077 mark into the close. 1.1055 remains the next downside target, though some traders may have already reduced risk to breakeven due to the threat of buying on the daily timeframe from support at 1.1072.
In the event the market penetrates 1.1055, H4 flow suggests an approach to the key figure 1.10 could be in order, assuming price can dethrone the 50-day SMA (blue – 1.1048) based on the daily timeframe.
GBP/USD:
(Italics represent previous writing).
An outperformer on the day, the British pound scored fresh monthly highs of 1.3120 against its US counterpart in recent movement. A blend of upbeat UK data and election polls favouring UK PM Johnson’s Conservatives provided support. Additionally, short covering/stop tripping above the key figure 1.30 likely had an effect.
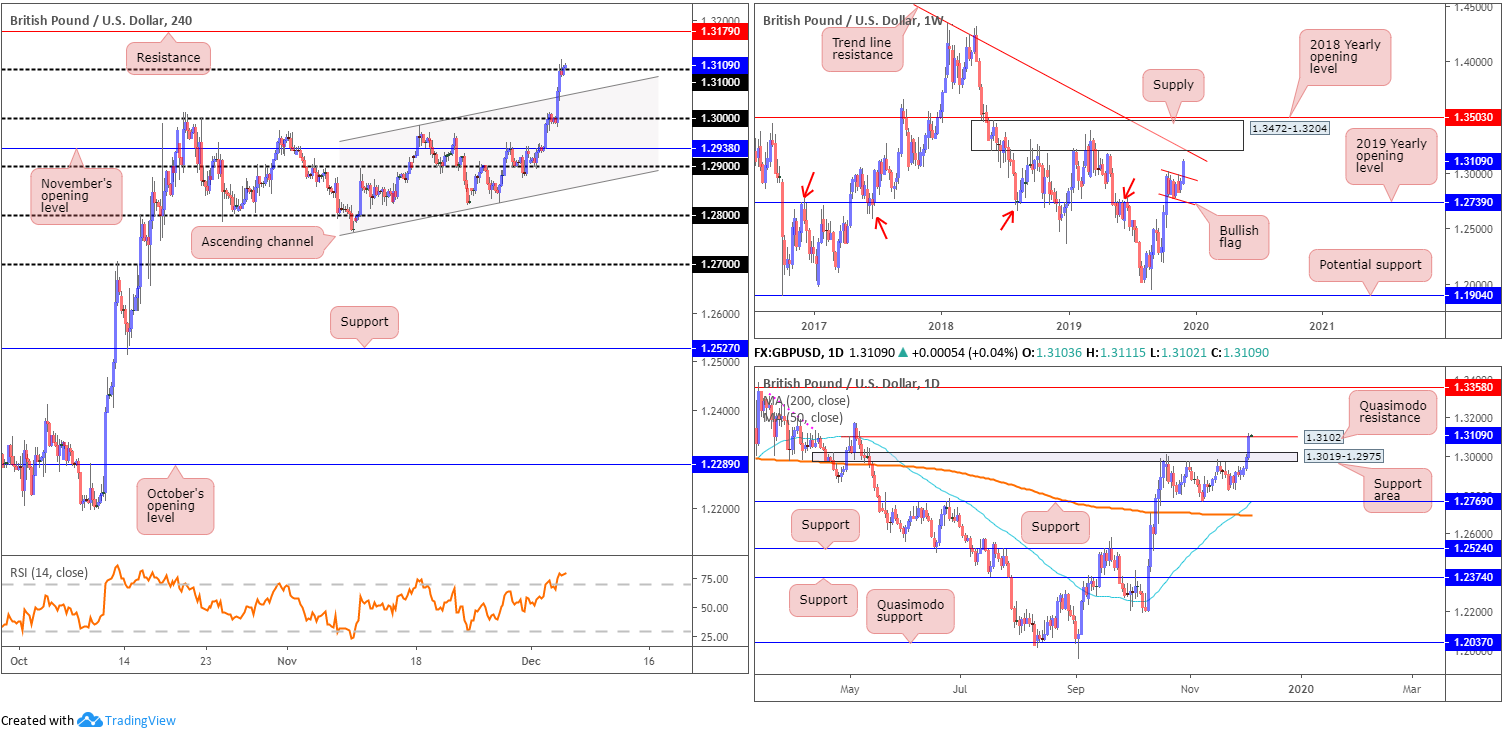
With H4 price seen toying with the 1.31 handle in early Asia, and having limited effect as resistance, the next port of call to the upside falls in around resistance at 1.3179.
On a wider perspective, daily price recently overthrew a familiar resistance area at 1.3019-1.2975, and is currently chewing on Quasimodo resistance at 1.3102. Technical studies reveal limited active supply (see pink line) beyond here until price crosses paths with resistance priced in at 1.3358.
In recent reports, weekly price highlighted the following:
The technical landscape on the weekly timeframe continues to support further upside in GBP/USD, exhibiting a bullish flag (typically considered a continuation pattern) forming just north of the 2019 yearly opening level 1.2739. A decisive close higher here may lead to the unit crossing swords with supply at 1.3472-1.3204, and long-term trend line resistance, etched from the high 1.5930. Regarding the immediate trend, the market faces a downward trajectory from 1.4376, with a break of the 1.1904 low (labelled potential support) confirming the larger downtrend from 1.7191.
Areas of consideration:
Longer term, weekly price stresses a robust bullish tone out of its bullish flag, though unfortunately faces nearby resistance. Further to this, most traders will require a close out of the flagging formation to form before committing funds. Given the move out of the flag has nearly reached its first upside target already, this leaves little room to reduce risk to breakeven and profit.
Shorter term, Wednesday’s report underlined the following:
Entering long on the back of a decisive H4 close formed above 1.30 is certainly an idea worth exploring, with an initial upside objective set at 1.31. Conservative traders may opt to wait for a retest at 1.30 following the close higher; this helps avoid any whipsaws and, if the retest forms by way of a bullish candlestick pattern, provides entry/risk levels to work with.
Well done to any readers who managed to take advantage of yesterday’s move higher.
Going forward, a H4 close above 1.31, preferably followed up with a retest in the shape of a bullish candlestick formation, may also identify as a buy signal, targeting H4 resistance at 1.3179, closely shadowed by the underside of weekly supply at 1.3204.
AUD/USD:
(Italics represent previous writing).
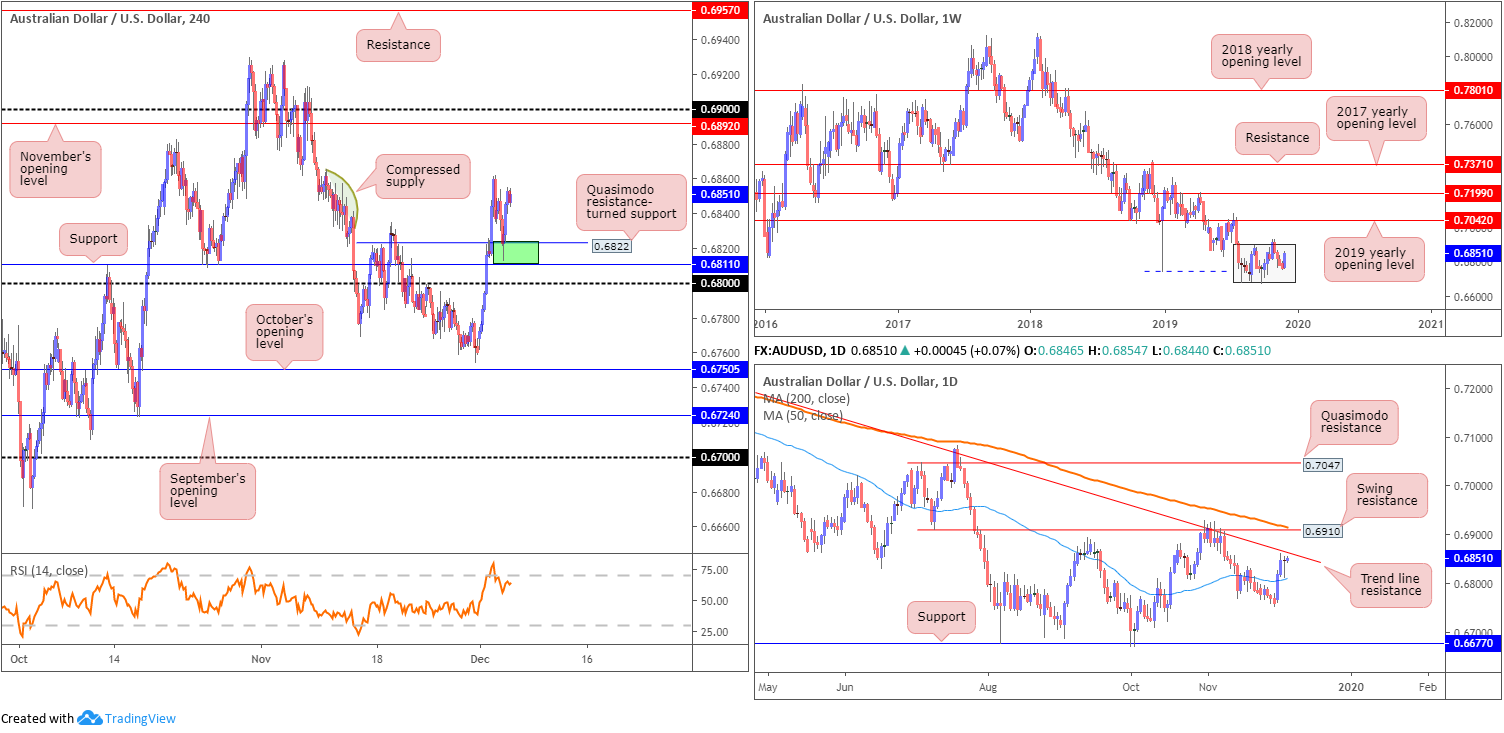
The Australian economy grew 0.4% in seasonally adjusted chain volume terms in the September quarter 2019 and 1.7% through the year, according to figures released by the Australian Bureau of Statistics (ABS) in early trade Wednesday. This immediately triggered a run lower, which continued until London bottomed between H4 support at 0.6811/0.6822 (green). A retest at 0.6822 was a noted support to watch for in Wednesday’s technical analysis; well done to any readers who managed to take advantage of this move.
November’s opening level represents the next logical resistance on the H4 scale at 0.6892. In terms of the relative strength index (RSI), the indicator is seen trading out of overbought territory.
With respect to the weekly timeframe, the unit remains within the walls of its current range between 0.6894/0.6677 (light grey). The primary downtrend, visible from this timeframe, has been in play since early 2018. Daily activity, on the other hand, recently crossed above the 50-day SMA (blue – 0.6809) and shook hands with levels just south of trend line resistance, extended from the high 0.7393.
Areas of consideration:
Once again, well done to readers who managed to long H4 support at 0.6822. This was a challenging trade considering trend line resistance surfacing nearby on the daily timeframe. Traders may consider locking in profits and reducing risk to breakeven at current price, leaving a portion of the position running in the event we push higher on the H4 scale to 0.6892.
USD/JPY:
(Italics represent previous writing).
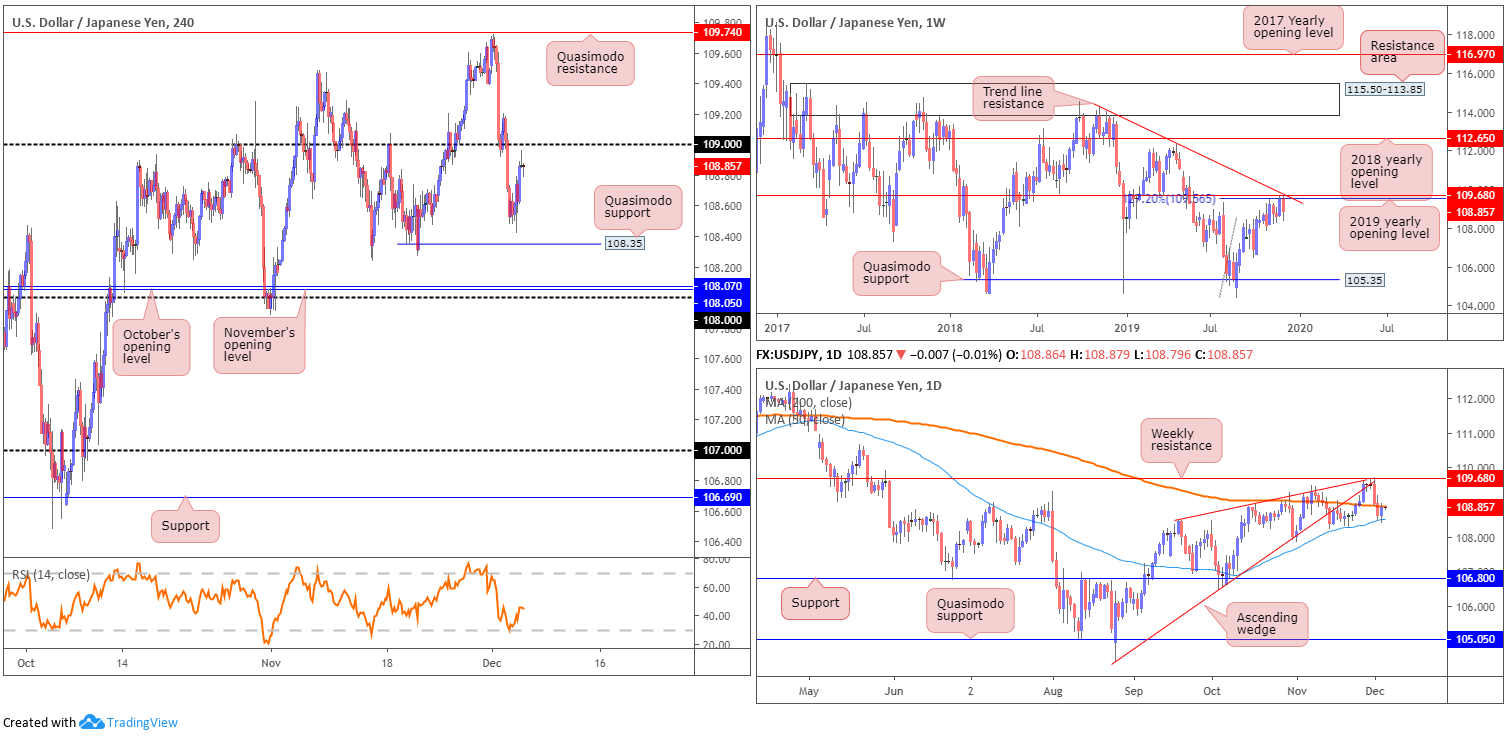
USD/JPY is consolidating around 108.85 having rallied from below 108.50 to current levels. 109 stands as the next obvious resistance on the H4 scale this morning, with a violation of this level likely to encourage further buying towards Quasimodo resistance plotted at 109.74.
Although the pair has been entrenched within a trending phase since late August, sellers appear to be making an appearance. This, technically speaking, is largely due to the combination of weekly resistances positioned around the 109.68 neighbourhood: a 127.2% Fibonacci ext. point at 109.56 (taken from the low 104.44), resistance formed at 109.68, the 2019 yearly opening level, and trend line resistance, extended from the high 114.23.
The story on the daily timeframe reveals price action trading south of its 200-day SMA (orange – 108.87), though has recently established support off the 50-day SMA (blue – 108.51). This follows the unit retesting the ‘cradle point’ of a broken ascending wedge at the beginning of the week, formed from the low 104.44. A break of the 50-day SMA on the daily timeframe exposes support at 106.80, confirming additional downside on the weekly timeframe.
Areas of consideration:
Having noted the 200-day SMA recently entering the fold as potential resistance, a bearish theme off the underside of 109 may be on the cards today. Psychological levels, however, have a tendency to attract fakeouts. These are generally interpreted as whipsaws to run stop-loss orders. To help avoid such a scenario, traders may opt to wait for additional candlestick confirmation to form before pulling the trigger. This not only helps identify seller intent, it also provides entry and risk levels to work with, too.
USD/CAD:
(Italics represent previous writing).
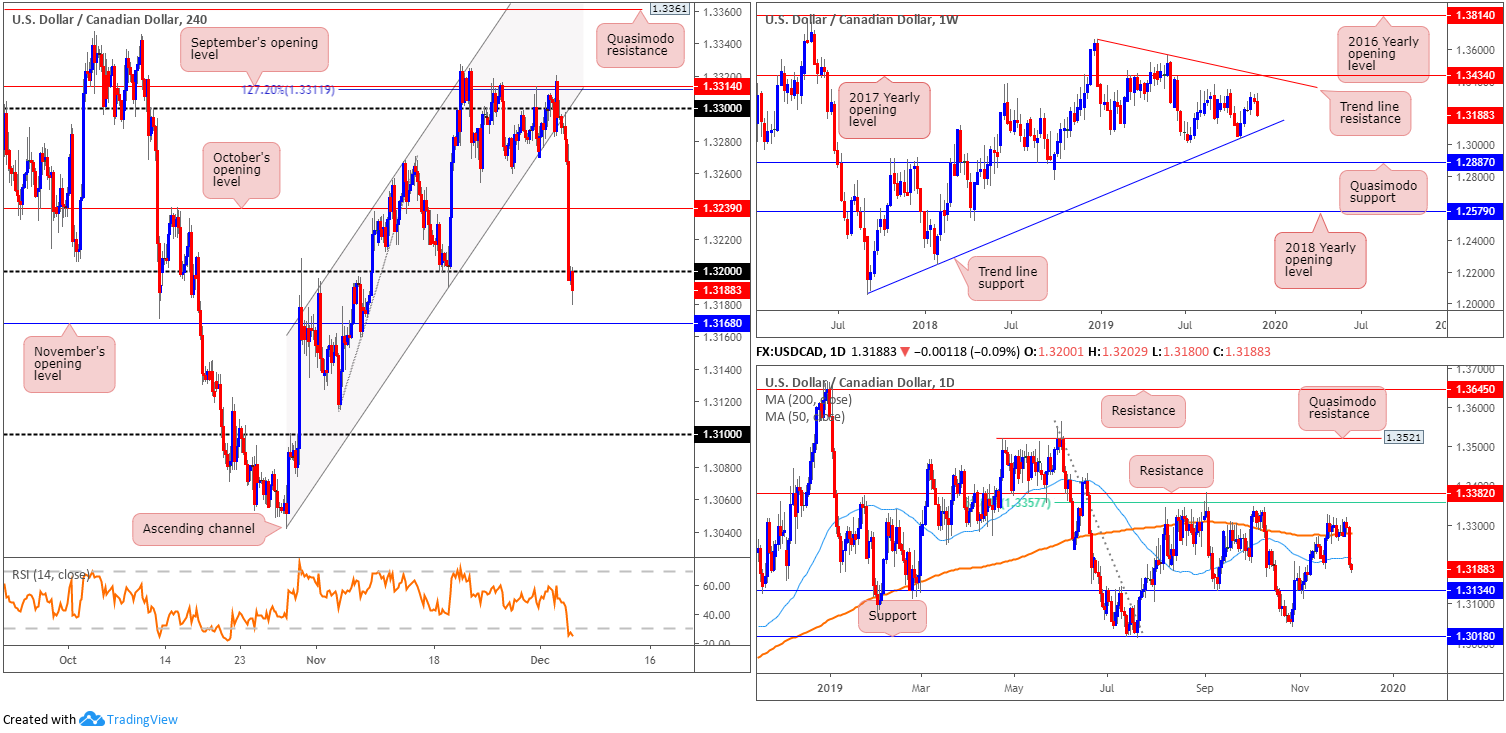
The Canadian dollar flexed its financial muscle against the US dollar Wednesday, benefitting from both a hawkish statement from the Bank of Canada (BoC) and rising oil prices (+3.64%).
USD/CAD tunnelled through channel support, extended from the low 1.3042, and retested the underside of the broken region going into London’s open. This was a noted move to watch for in Wednesday’s technical briefing, so well done to any readers who managed to board this train. October’s opening level at 1.3239 gave way and, in recent hours, the 1.32 handle also collapsed. This consequently exposes November’s opening level at 1.3168 as the next downside support region.
Also of interest, in one fell swoop, daily price engulfed the 200/50-day SMAs at 1.3279 and 1.3215, respectively. Notable support is expected to emerge around the 1.3134 neighbourhood, with a break of this base likely drawing crosshairs towards support at 1.3018. Before reaching 1.3018, however, traders are urged to take into account the weekly trend line support, taken from the low 1.2061.
Areas of consideration:
According to the technical landscape, further losses are likely. Sellers attempting to take advantage of this, however, face immediate support in the shape of November’s opening level at 1.3168, closely followed daily support priced in at 1.3134. Searching for lower timeframe entries around the underside of 1.32 could be an option; this helps reduce risk and increase reward to the said downside support targets.
USD/CHF:
(Italics represent previous writing).
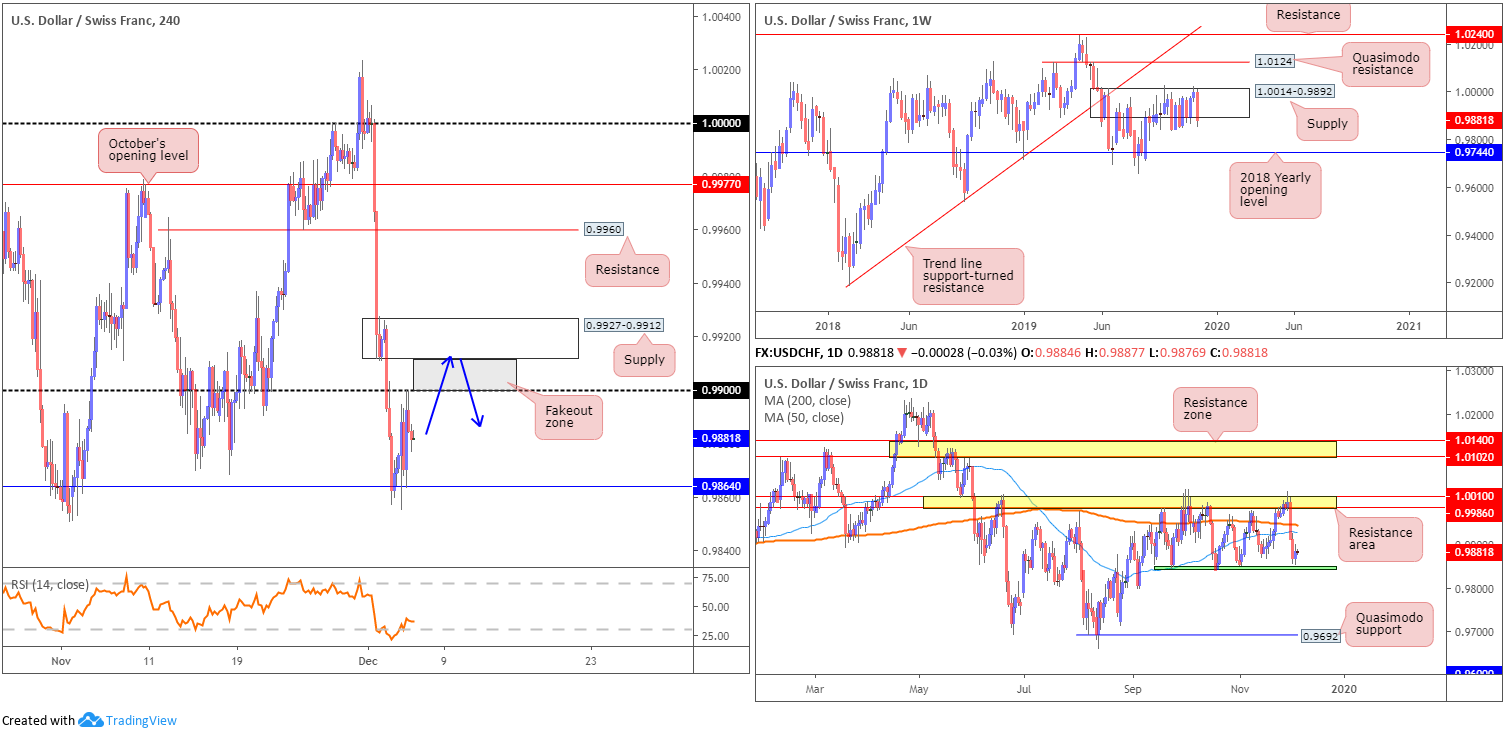
Following two consecutive losing sessions, USD/CHF chalked up a modest recovery Wednesday, adding 16 points, or 0.16%.
Yesterday’s recovery, however, was contained by the 0.99 handle based on the H4 timeframe. With support plotted nearby at November’s opening level drawn from 0.9864, a range between these two barriers may develop. Outside of these zones, we have fresh supply positioned at 0.9927-0.9912 and the round number 0.98 offering potential support (not visible on the screen).
On more of a broader viewing, since mid-September, daily price has been busy carving out a consolidation between support around the 0.9845ish region (green) and a resistance area at 1.0010/0.9986. Yesterday saw the unit settle at the lower end of the said range.
Technical research based on the weekly timeframe shows the pair remains consolidating within the walls of a supply zone at 1.0014-0.9892, despite whipsawing through the top edge of the said zone on two occasions. A move higher from here has Quasimodo resistance at 1.0124 in sight, followed by resistance at 1.0240 and trend line support-turned resistance, extended from the low 0.9187. To the downside, nevertheless, the 2018 yearly opening level awaits at 0.9744.
Areas of consideration:
Focusing solely on the H4 timeframe this morning, a fakeout zone is present between the round number 0.99 and supply at 0.9927-0.9912. It is common knowledge stop-loss orders congregate around psychological levels. Therefore, a break through 0.99 will trip buy stops from not only sellers attempting to fade 0.99, but also those attempting to catch the breakout. This provides liquidity for bigger players to sell into from the noted supply and bring price lower.
As such, the current supply area is a worthy contender for any technician’s watchlist.
Dow Jones Industrial Average:
(Italics represent previous writing).
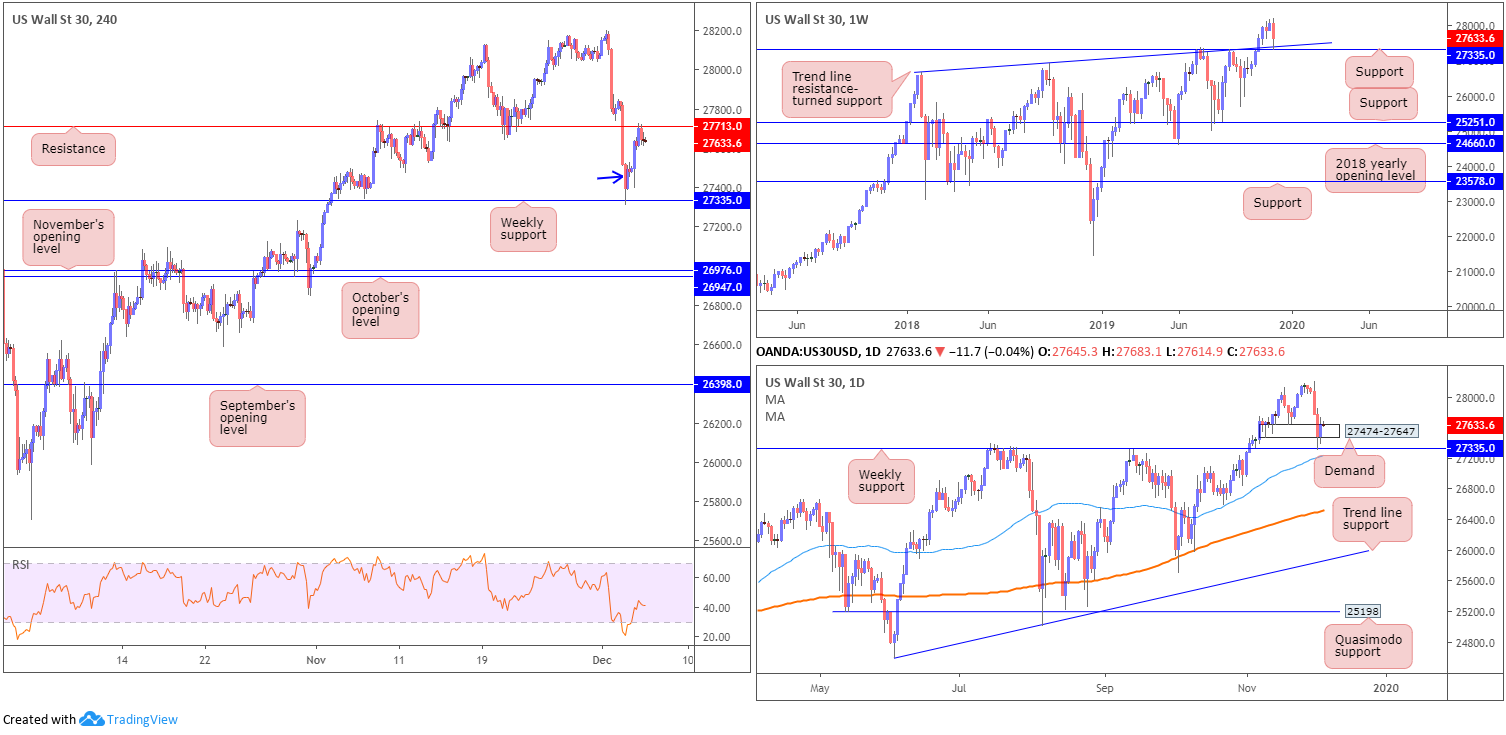
US stocks bounced back Wednesday amid reports China and the US could be close to a trade deal. The Dow Jones Industrial Average added 146.97 points, or 0.53%; the S&P 500 advanced 19.56 points, or 0.63% and the tech-heavy Nasdaq 100 added 41.79 points, or 0.51%.
Wednesday’s technical briefing highlighted the possibility of further buying, following weekly price retesting support coming in at 27335, which happens to align closely with trend line resistance-turned support, extended from the high 26670.
Lower on the curve, daily demand at 27474-27647 also suffered a raw whipsaw in recent movement, likely tripping sell stops. As you can see, price action drove through orders at the said demand to collect weekly buyers at the noted support level.
With weekly support also serving as a ‘floor’ on the H4 timeframe, coupled with H4 price forming an inside candlestick formation (blue arrow), price rallied yesterday and touched gloves with H4 resistance at 27713.
Areas of consideration:
Buying the said H4 inside candle pattern was noted as a possible entry long into this market in yesterday’s report, targeting the said H4 resistance. Well done to any readers who managed to jump aboard this move. Reducing risk to breakeven and removing a portion of the position off the table is certainly an option now. Leaving a slice of the position running is also something to consider, given both weekly and daily timeframes exhibit scope to explore higher ground.
XAU/USD (GOLD):
(Italics represent previous writing).
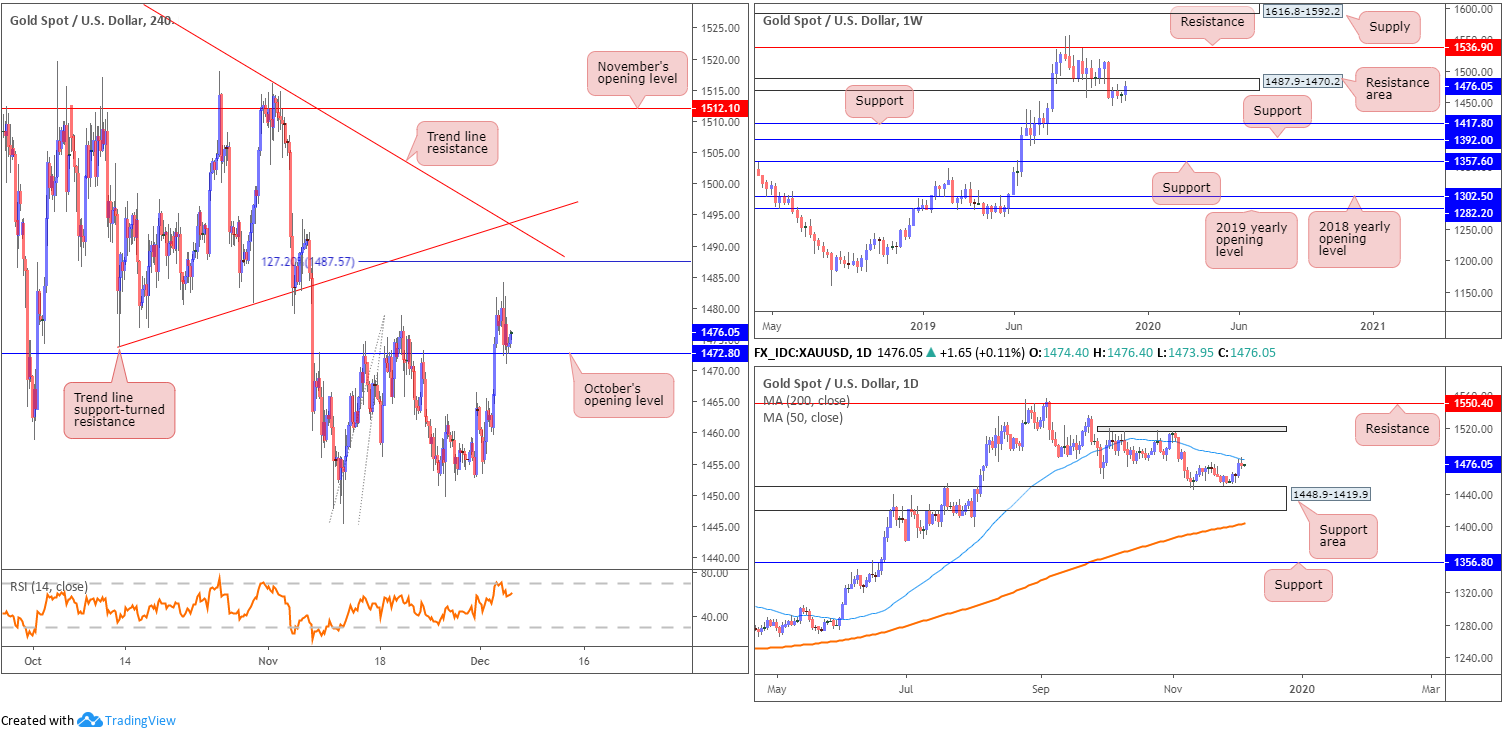
A turnaround in the global risk sentiment prompted a modest wave of selling Wednesday. After scoring a fresh weekly high at 1484.1, XAU/USD spot turned lower and retested October’s opening level at 1472.8, based on the H4 timeframe. As evident from the chart, bullion stabilised off 1472.8 into the close, which could prompt a run higher today, targeting yesterday’s high, followed by a 127.2% Fibonacci ext. point at 1487.5, closely shadowed by two converging trend line resistances (1473.8/1557.1).
Higher-timeframe movement reveals daily price tested the underside of a 50-day SMA (blue – 1482.2) yesterday and held ground. This follows a rebound from nearby support area coming in at 1448.9-1419.9. Should buyers overthrow the said SMA, tops sited around the 1518.8 point are in sight.
The story on the weekly timeframe reveals price action driving higher into a resistance area at 1487.9-1470.2. Note the top edge of this zone coincides closely with the two aforementioned H4 trend line resistances.
Areas of consideration:
Entering long from H4 support at 1472.8, although appealing on this scale, faces resistance both on the weekly timeframe out of 1487.9-1470.2, and also the 50-day SMA on the daily timeframe.
Assuming the higher-timeframe picture represents an accurate view, a H4 close south of 1472.8 could be a move worth keeping an eye out for. A H4 close beneath this base could be enough to drag price towards the top edge of the current daily support area at 1448.9. Conservative traders, however, may opt to wait and see if a retest at the underside of 1472.8 occurs, before pulling the trigger. This helps recognise seller intent and offers traders entry and risk levels to work with.
The accuracy, completeness and timeliness of the information contained on this site cannot be guaranteed. IC Markets does not warranty, guarantee or make any representations, or assume any liability regarding financial results based on the use of the information in the site.
News, views, opinions, recommendations and other information obtained from sources outside of www.icmarkets.com.au, used in this site are believed to be reliable, but we cannot guarantee their accuracy or completeness. All such information is subject to change at any time without notice. IC Markets assumes no responsibility for the content of any linked site.
The fact that such links may exist does not indicate approval or endorsement of any material contained on any linked site. IC Markets is not liable for any harm caused by the transmission, through accessing the services or information on this site, of a computer virus, or other computer code or programming device that might be used to access, delete, damage, disable, disrupt or otherwise impede in any manner, the operation of the site or of any user’s software, hardware, data or property.


