
Key risk events today:
Australia Trade Balance; ECB Main Refinancing Rate, Monetary Policy Statement and Press Conference; Canada Trade Balance; US Unemployment Claims.
(Previous analysis as well as outside sources – italics).
EUR/USD:
Europe’s single currency derived fresh impetus from upbeat Eurozone services PMIs and continued USD depreciation Wednesday. The US dollar index recorded its seventh consecutive decline, unable to glean any lasting traction from better-than-anticipated US data, such as ADP and ISM non-manufacturing PMI prints.
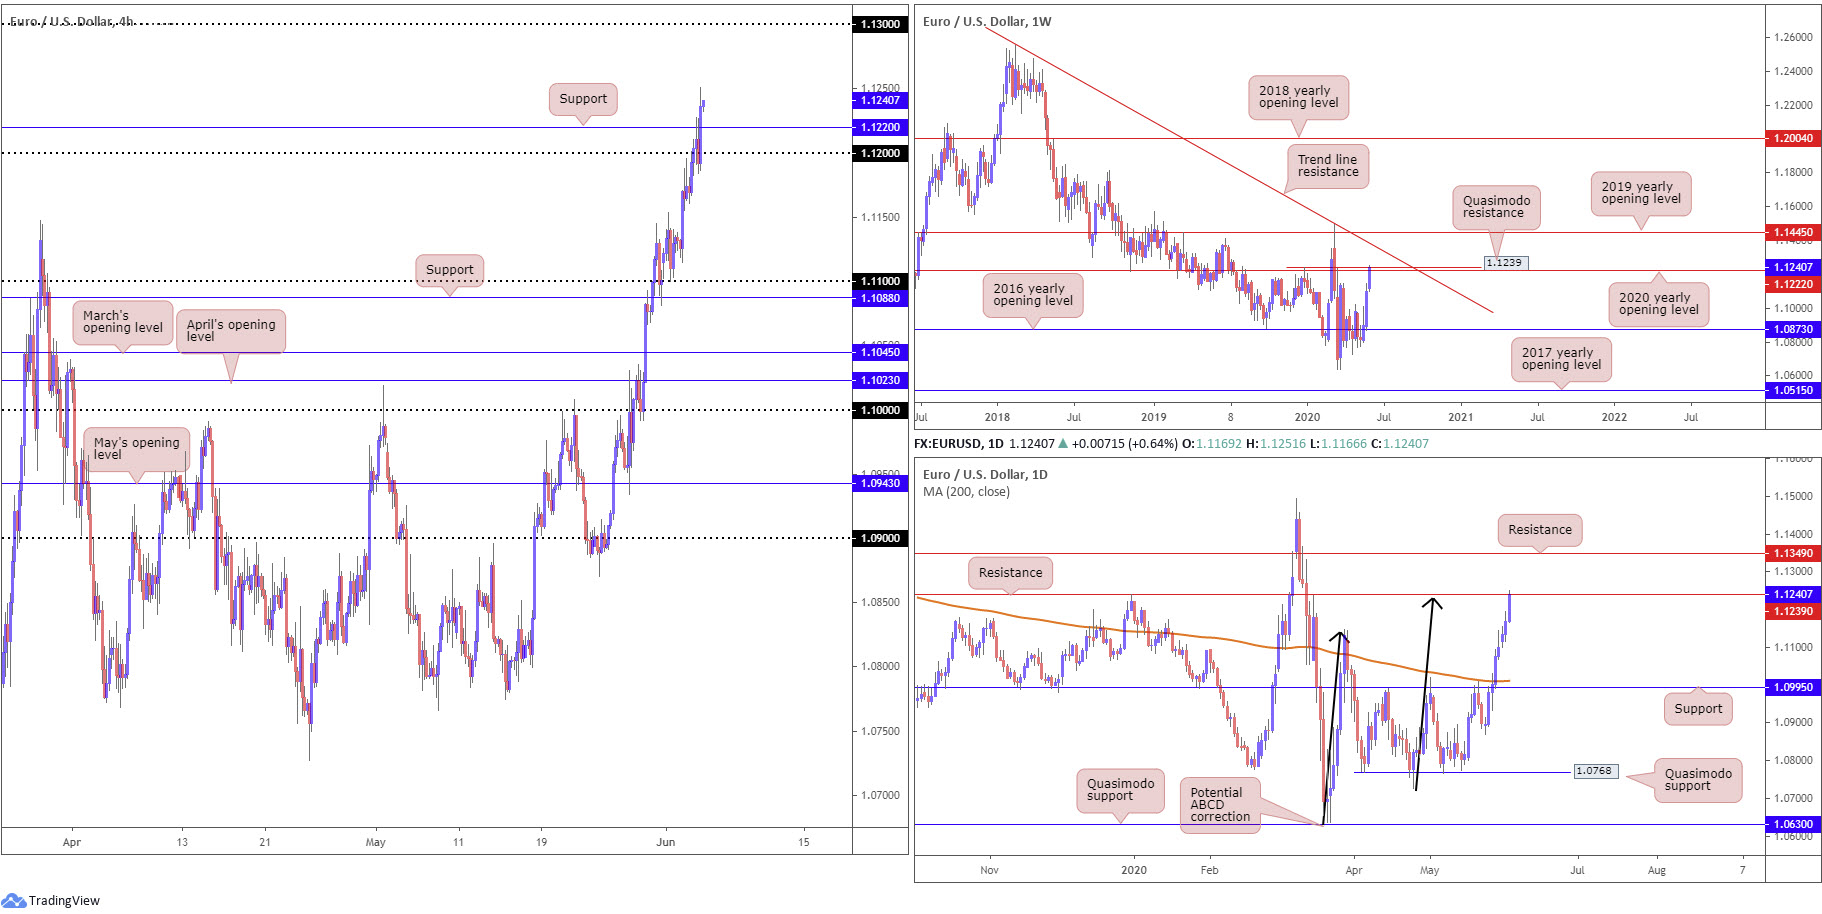
EUR/USD’s H4 activity overthrew both the 1.12 handle and Quasimodo resistance at 1.1220 (now a serving support) in recent hours, lifting to highs at 1.1251 and shining the spotlight on the possibility of an approach to 1.13.
Movement on the weekly timeframe has price action engaging with the 2020 yearly opening level at 1.1222 (regarded as strong resistance), and Quasimodo resistance at 1.1239. A breach here could land the pair at trend line resistance, extended from the high 1.2555.
In similar fashion, price action based on the daily timeframe shows the piece shaking hands with resistance at 1.1239 (essentially the same base as weekly QM), joined closely with an ABCD correction (black arrows) at 1.1226.
Areas of consideration:
Upside could be tested today; we’re trading into firm higher-timeframe resistances at the moment which have the ability to change the mood of this market, technically speaking. Therefore, buyers north of 1.12 may want to factor this into trade management.
In the event price action remains buoyed above 1.12, a retest scenario at 1.1220 could be worth watching out for. Conservative players, however, in view of higher-timeframe structure, may seek bullish candlestick confirmation before pulling the trigger.
GBP/USD:
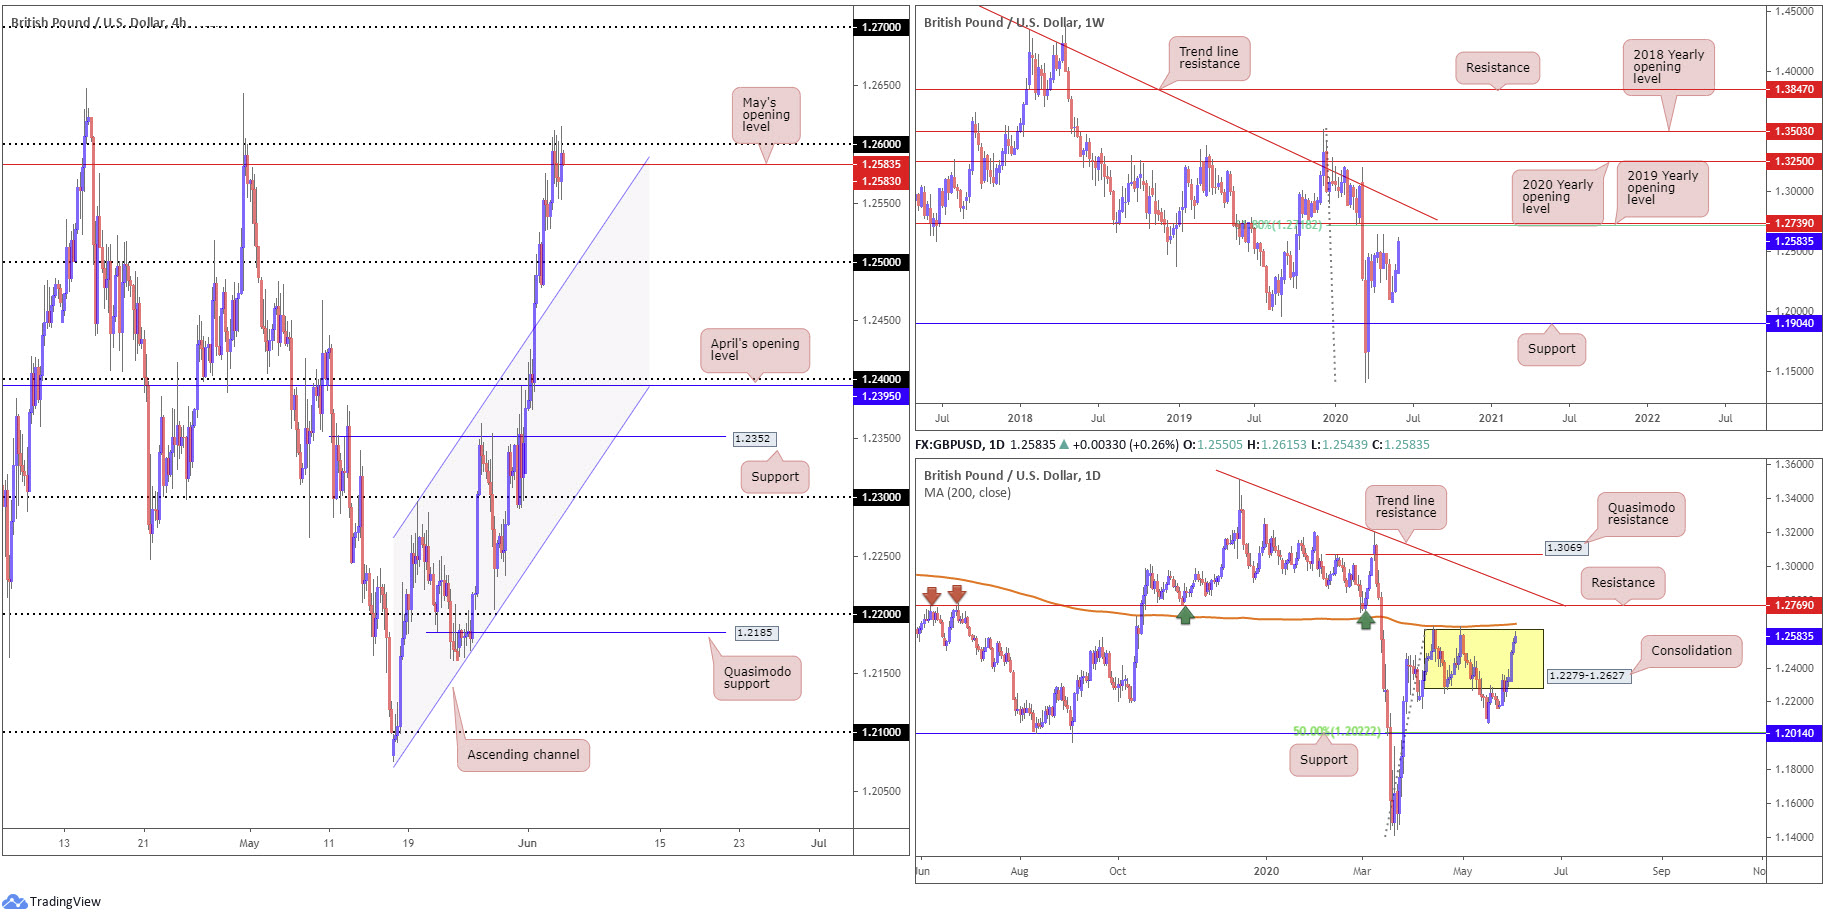
Demand for the British pound lifted GBP/USD to highs at 1.2615 Wednesday, levels not seen since the beginning of May. A better-than-expected UK final services PMI, as well as the buck remaining under pressure, saw the pair eke out modest gains. Despite this, H4 witnessed sellers reassert some dominance off the 1.26 handle, serving as reasonable resistance. Downside from here can expect support to materialise off channel resistance-turned support, extended from the high 1.2296, whereas tops at around 1.2644 are visible should we breach 1.26.
GBP/USD, from the weekly timeframe, appears poised to attempt a run to 1.2739, the 2019 yearly opening level, and a 61.8% Fibonacci retracement ratio at 1.2718, sited a handful of pips under trend line resistance, extended from the high 1.5930.
Analysis on the daily timeframe has candle action approaching range tops at 1.2627, reinforced somewhat by the 200-day SMA (orange – 1.2661). A violation to the upside could have price face resistance coming in at 1.2769.
Areas of consideration:
Wednesday’s technical briefing underscored the following (italics):
Between the 1.26 handle on the H4 timeframe and daily range tops at 1.2627 chalks up a potential reversal zone to work with today. Traders, however, are urged to pencil in the possibility of a fakeout above the zone to the 200-day SMA at 1.2659. Therefore, conservative sellers may seek candlestick confirmation out of 1.2627/1.26 before pulling the trigger.
As of yet, bearish candle action off 1.26 has been limited. As such, 1.2627/1.26 may still be a point of consideration for some traders today, particularly if a H4 bearish candlestick pattern emerges. Not only will this help identify seller intent, it provides structure to determine entry and risk levels.
AUD/USD:
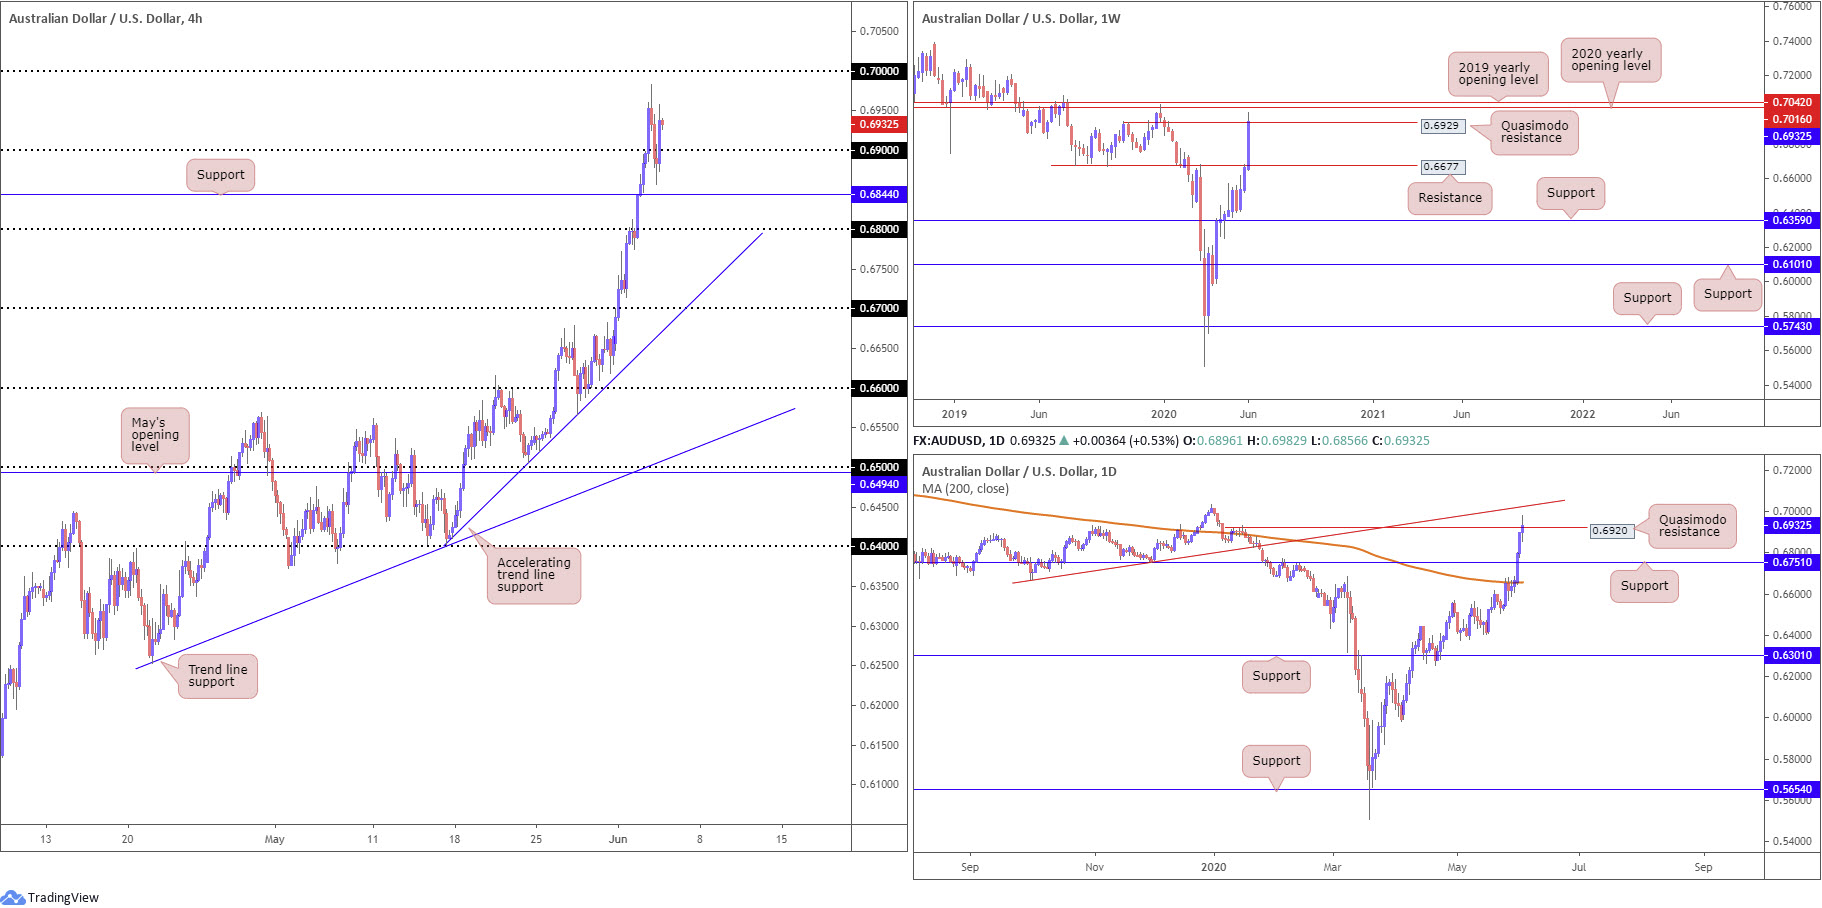
AUD/USD regained footing above 0.69 Wednesday, following an earlier fall to lows at 0.6856, missing H4 support at 0.6844 (prior Quasimodo resistance) by a hair. Risk-on flows continued to bolster price action, moving the key figure 0.70 into view.
The technical landscape on the weekly timeframe, after engulfing resistance at 0.6677, threw Quasimodo resistance at 0.6929 in the pot yesterday. Similarly, daily activity is seen testing Quasimodo resistance plotted at 0.6920, albeit threatening a pop to trend line support-turned resistance, taken from the low 0.6670.
Areas of consideration:
With weekly resistance attempting to make a name for itself, bullish strategies above 0.69 may be messy.
Should 0.70 make an appearance, however, this could appeal to sellers as a port of resistance seeing as how daily trend line resistance (0.6670) intersects closely with the level.
USD/JPY:
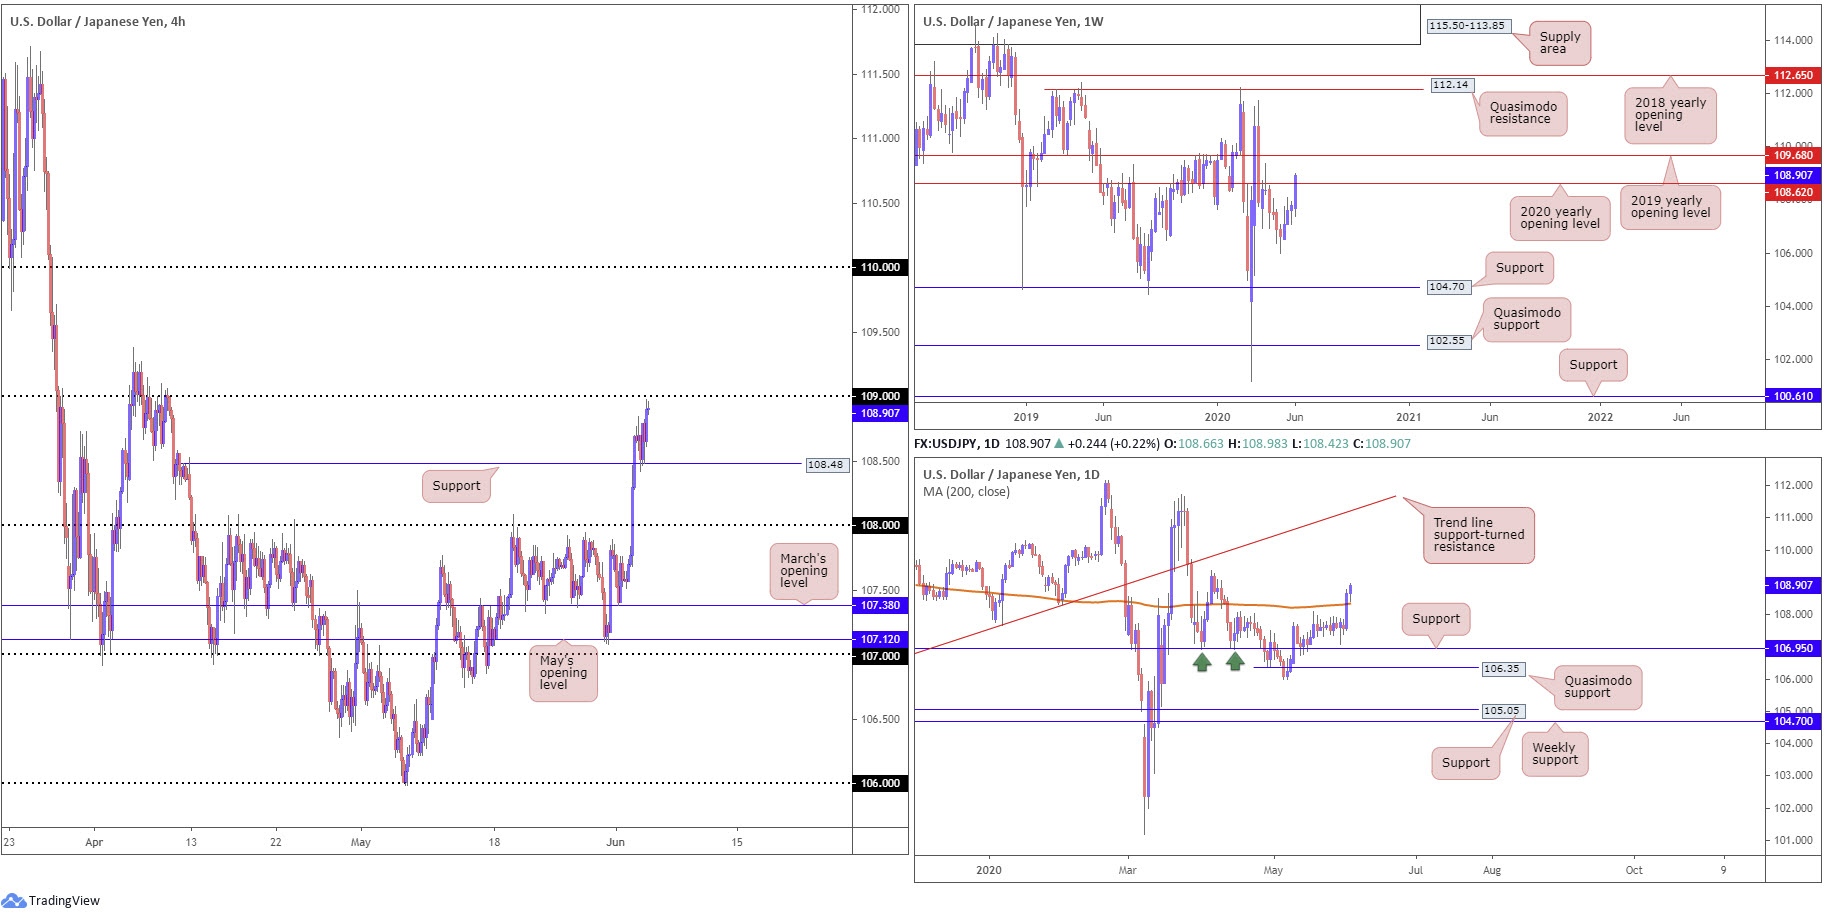
Following an early dip to support at 108.48 Wednesday (a prior Quasimodo resistance level), buyers regained consciousness and took aim at the 109 handle on the H4 timeframe as risk-on flows continued to dominate. 109 echoes viable resistance, having capped upside in late March and early April.
Meanwhile, Tuesday had daily price overthrow its 200-day SMA (orange – 108.34) in dominant fashion. This – coupled with yesterday’s extension – underlines the 109.38 April 6 high as the next feasible resistance on this timeframe.
Higher up on the curve, we can see weekly price recently surpassed the 2020 yearly opening level coming in at 108.62, a level that held price lower in April by way of a shooting star candle pattern. Ousting sellers at 108.62, as you can see, shoves the 2019 yearly opening level at 109.68 into sight.
Areas of consideration:
109 is unlikely to generate much selling pressure; as you can see, both weekly and daily price exhibit potential to climb further.
Should we unseat 109, bullish strategies may be in store to 109.38 (April 6 high), followed by weekly resistance at 109.68 (2019 yearly opening level). Conservative traders may watch for 109 to serve as support following a breach to higher levels, in order to help sidestep any fakeout scenarios.
USD/CAD:
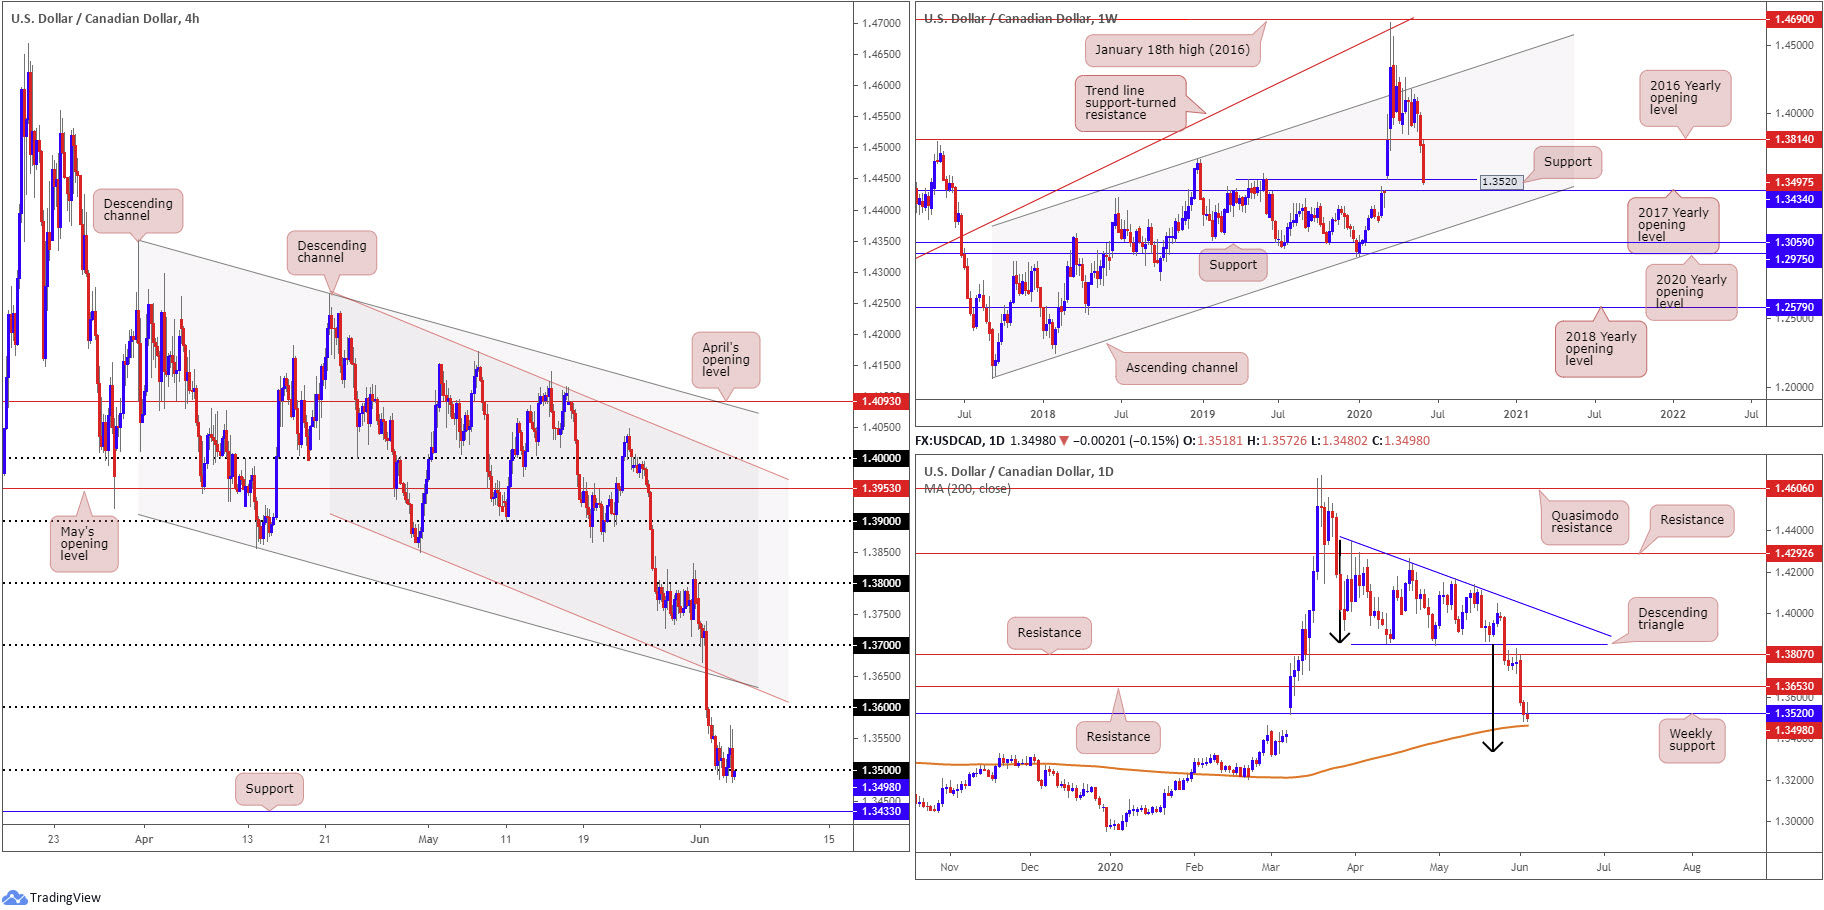
As of writing, USD/CAD treads water a touch beneath the 1.35 handle on the H4 timeframe, causing buyers off the round number to wince, as the unit appears poised to make a run for support priced in at 1.3433. In recent news we also noted the Bank of Canada (BoC) maintained its benchmark overnight rate at 0.25%, as expected, along with repo tapering.
Weekly support at 1.3520 (prior Quasimodo resistance level) offers a fragile tone at the moment, unlocking the door to the 2017 yearly opening level at 1.3434.
Elsewhere, daily movement reveals the 200-day SMA (1.3462) may welcome price action today – simple moving averages often serve as dynamic support/resistance. A break, however, could lead to the descending triangle’s take-profit base at 1.3332 (black arrows).
Areas of consideration:
H4 support at 1.3433, along with weekly support, in the shape of the 2017 yearly opening level, at 1.3434, marks a potential reversal zone to consider today.
The 200-day SMA at 1.3460ish may also provide a floor, which could have buyers attempt a recovery back above weekly support noted at 1.3520.
USD/CHF:
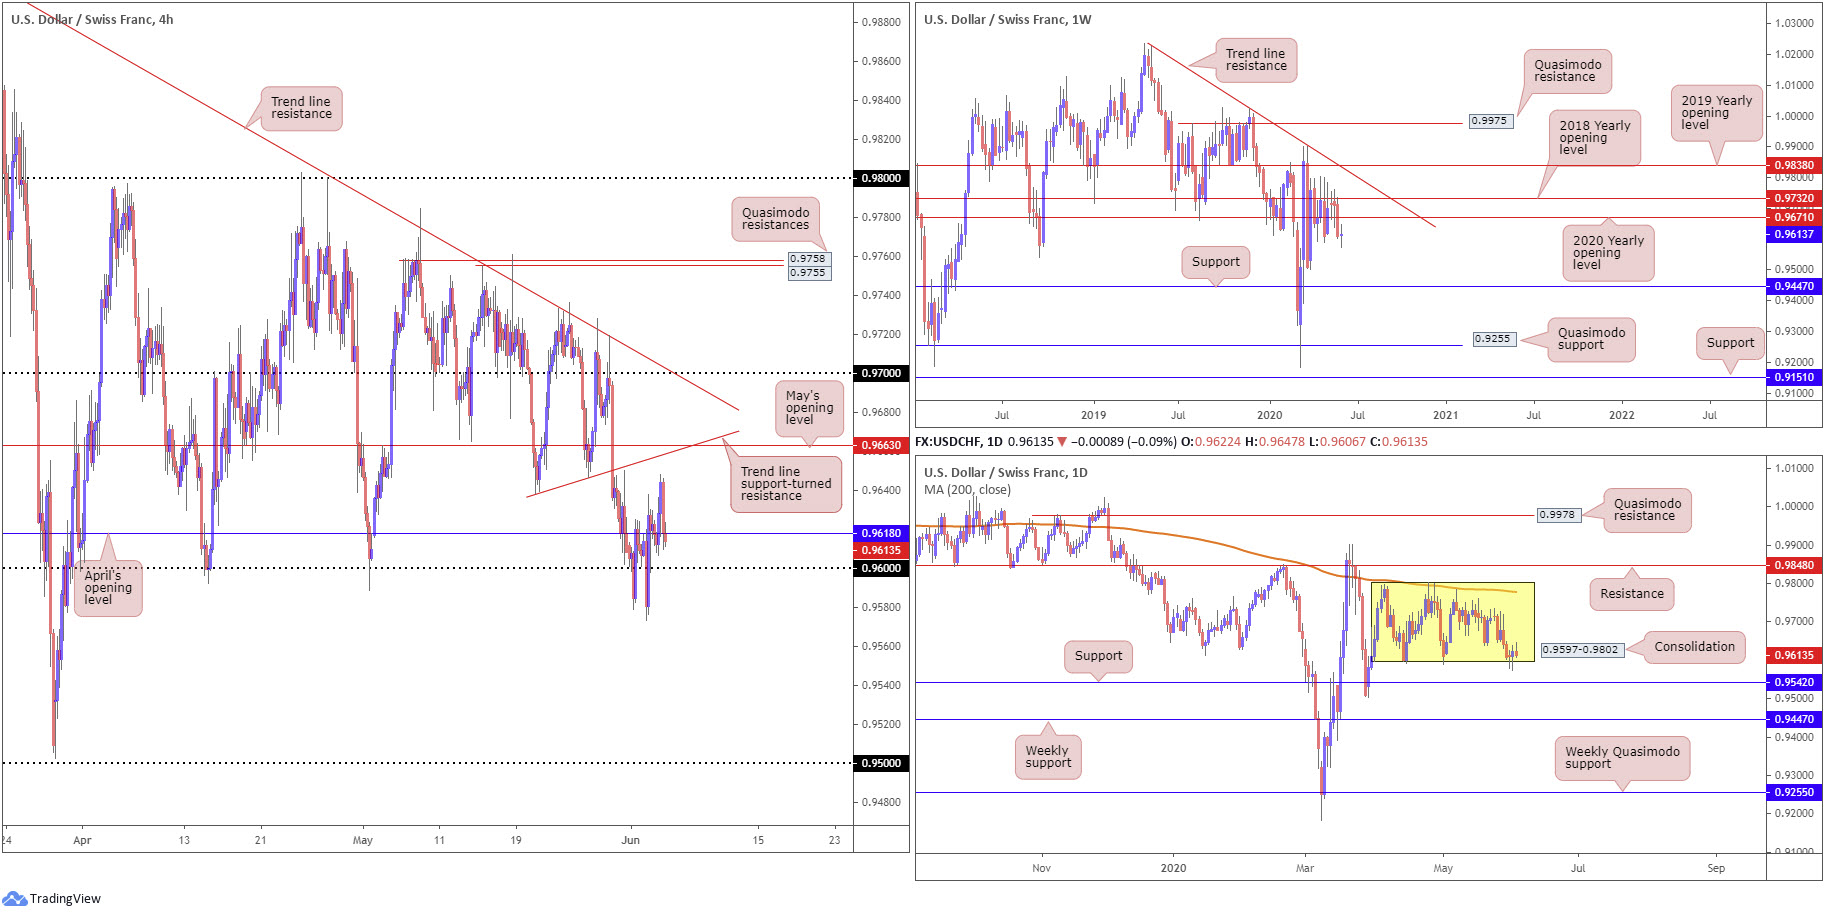
Despite ranging between 0.9647/0.9606, the day so far echoes an indecisive tone. Upbeat risk sentiment undermined the Swiss franc, though prevalent USD weakness capped upside attempts.
In recent hours, H4 candle action dipped to April’s opening level at 0.9618. As aired in recent analysis, potential for further upside exists north of 0.9618 towards May’s opening level at 0.9663 and a local trend line support-turned resistance, taken from the low 0.9638. Tunnelling lower, however, has 0.96 on the radar, aligning with the lower limit of the daily range at 0.9597.
Over the last week, longer-term flow observed a vigorous push to the downside, a move which ran through the 2020 yearly opening level at 0.9671, after failing to close above nearby resistance at 0.9732, the 2018 yearly opening level. Although a retest at 0.9671 could emerge, traders’ crosshairs will likely be fixed on support at 0.9447.
Since early April, price action on the daily timeframe has consolidated between 0.9802/0.9597, with early week shaking hands with the lower boundary and closing off worst levels. This may be enough to lift weekly price back up to the underside of 0.9671. Traders may also want to acknowledge the 200-day SMA (orange – 0.9778) joins the upper border of the aforementioned consolidation. Outside, traders will note resistance rests at 0.9848 and support from 0.9542.
Areas of consideration:
Holding off 0.9618, knowing we’re also coming off daily range lows at 0.9597, could appeal to intraday buyers today, targeting May’s opening level at 0.9663 as an initial target.
A retest at 0.96 may also spark interest, given the connection to daily range support at 0.9597. Any sustained move under 0.96, nonetheless, may collide into daily support at 0.9542 and maybe, with a little oomph, the 0.95 handle on the H4.
Dow Jones Industrial Average:
Major US benchmarks concluded higher across the board Wednesday amid optimism surrounding an economic rebound, despite civil unrest plaguing the country. The Dow Jones Industrial Average climbed 527.24 points, or 2.05%; the S&P 500 added 42.05 points, or 1.36%, and the tech-heavy Nasdaq 100 concluded higher by 47.38 points, or 0.49%.
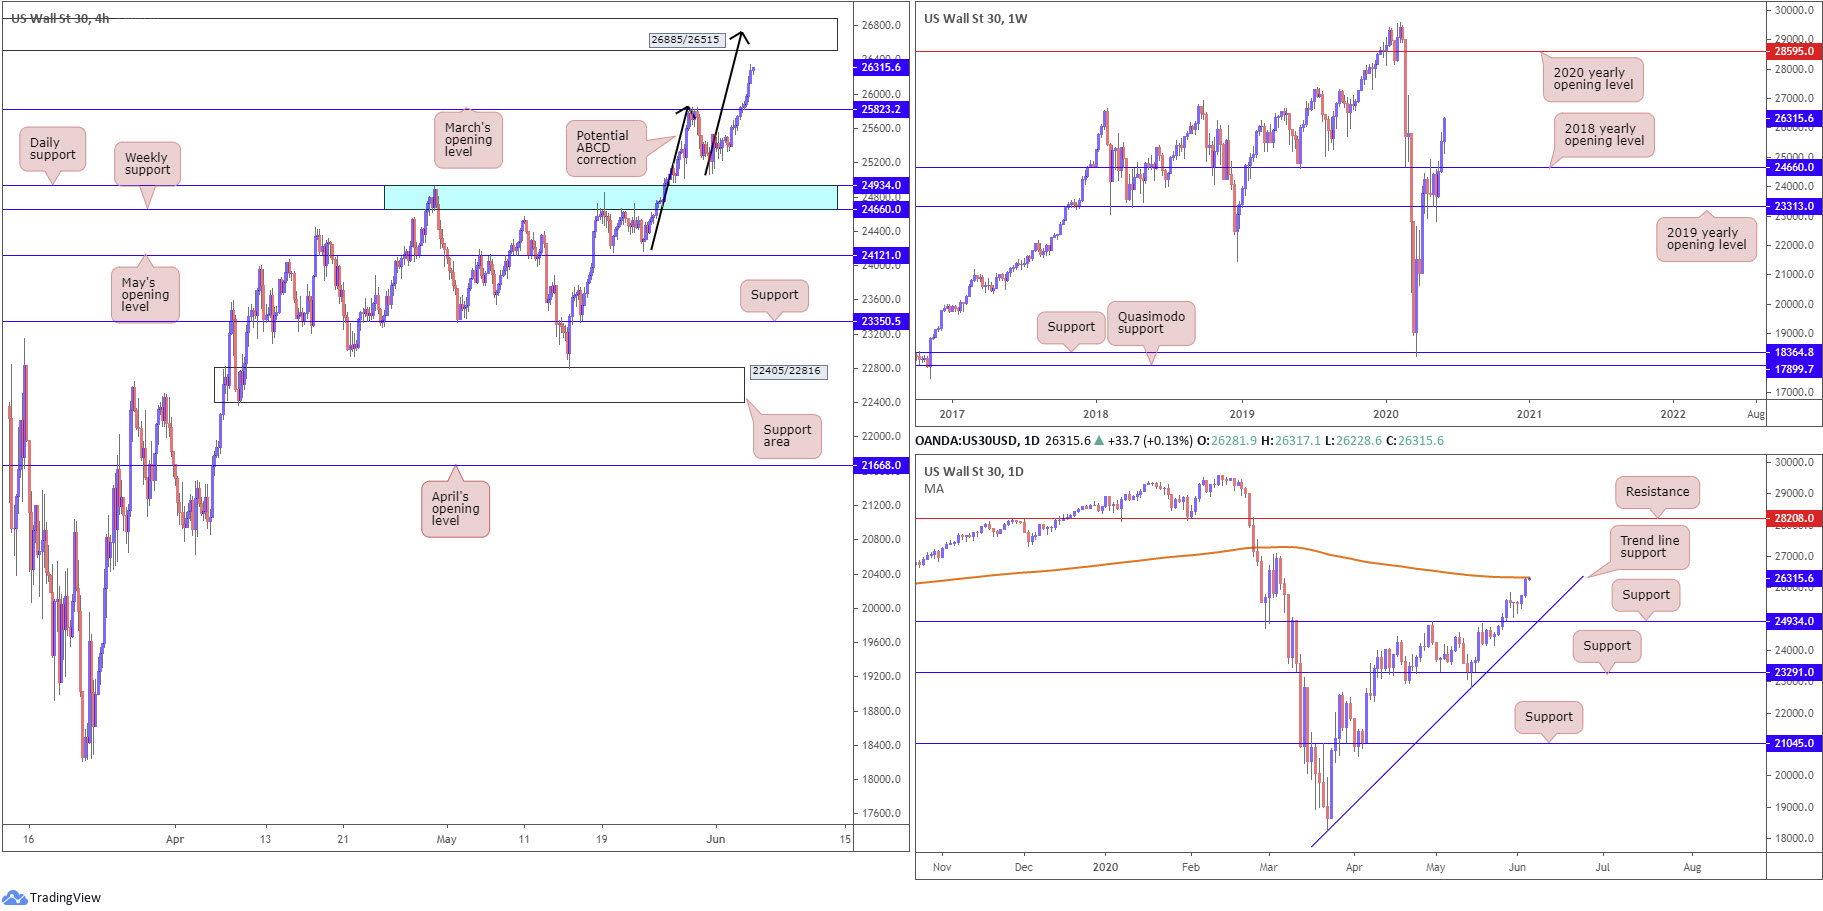
Sellers were unwelcome at March’s opening level at 25823 on the H4 timeframe yesterday, as buyers made quick work of the level. This, from a technical standpoint, lists a H4 resistance area at 26885/26515 in the firing range today, merging with a potential ABCD correction (black arrows) at 26743.
According to the daily timeframe, upside may be hampered as we recently joined the 200-day SMA (orange – 26335), with a break north of here exposing the 27092 March 4 high. From the weekly timeframe, the resurgence of bidding positions buyers in a fortunate position north of the 2018 yearly opening level at 24660. Sustained upside could eventually have the 2020 yearly opening level at 28595 emerge.
Areas of consideration:
As things stand, the odds of a reaction being seen out of H4 resistance at 26885/26515 is high. Not only does the area come with a H4 ABCD correction at 26743, daily sellers between the 27092 March 4 high and 200-day SMA at 26335 may aid selling.
Breaking the current H4 resistance zone, nonetheless, would signal a strong bullish signal, possibly reaching as far north as the 2020 yearly opening level at 28595.
XAU/USD (GOLD):
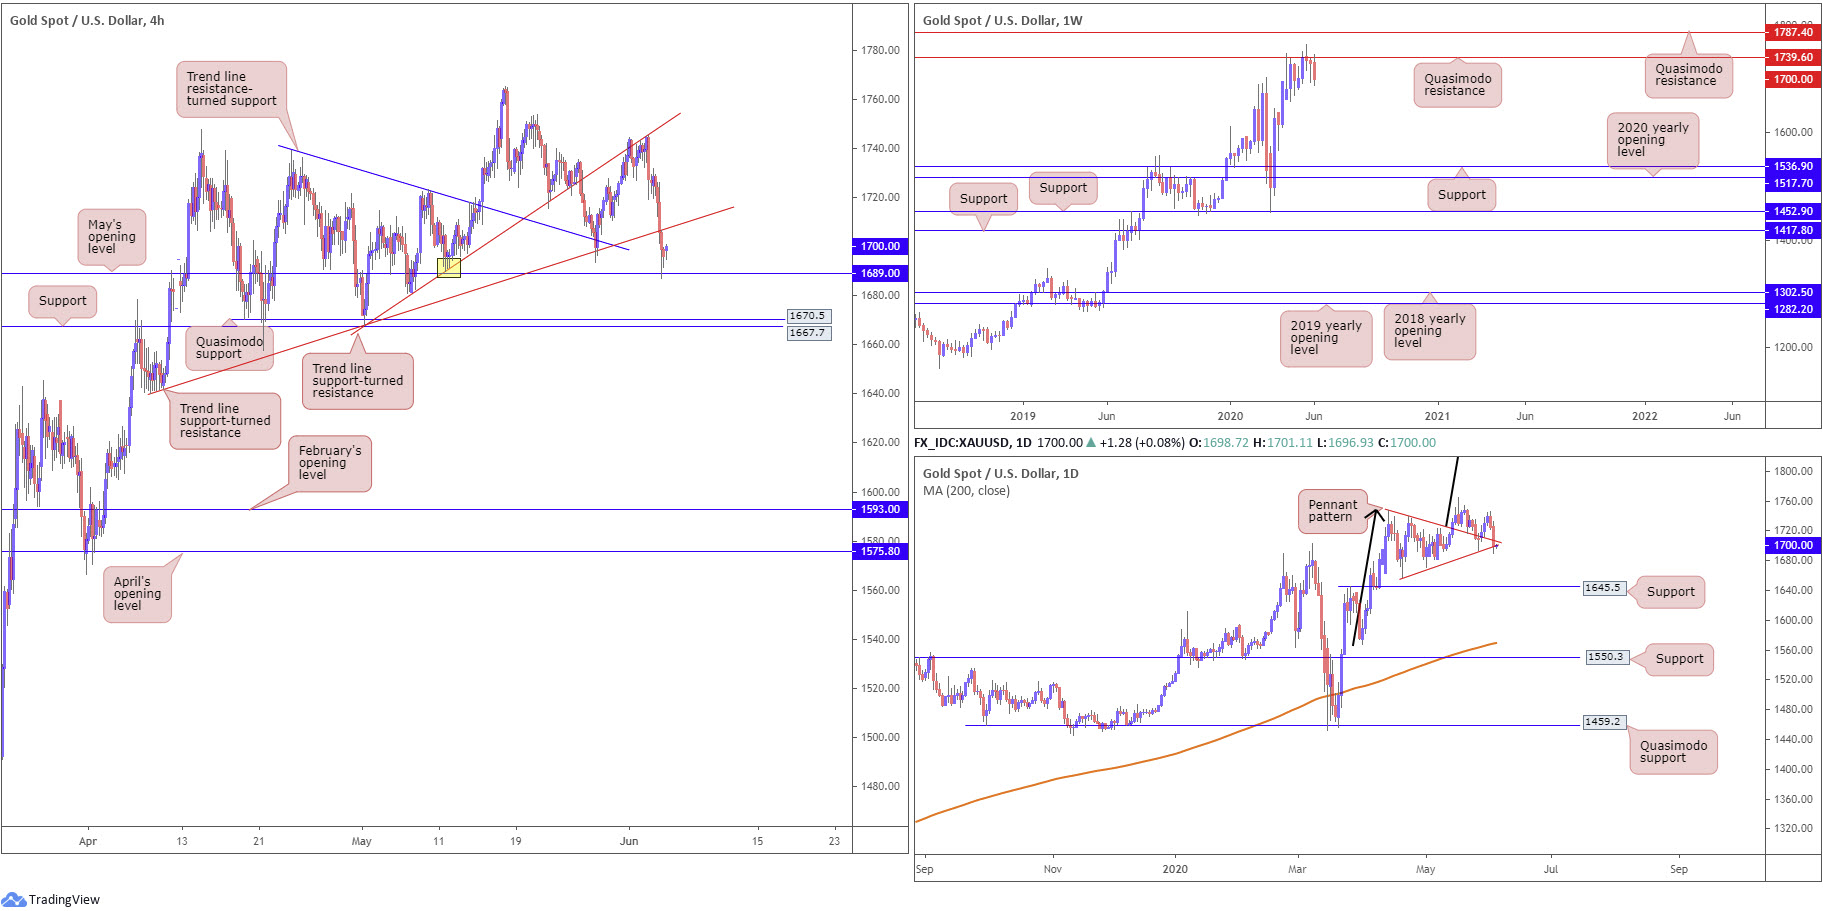
Weekly price is on track to finish the week shaped by way of a bearish outside pattern, as buyers lose flavour under weekly Quasimodo resistance at 1739.6. Weekly price has remained capped under the aforementioned Quasimodo resistance from mid-April. Clearance of 1739.6 underlines another layer of Quasimodo resistance at 1787.4. It may also interest some traders to note the trend on gold has faced a northerly trajectory since 2016.
The technical position on the daily timeframe reveals the bullish pennant configuration, established from a high of 1747.7 and a low coming in from 1658.1, is holding on by a thread. This threatens a possible decline to support formed at 1645.5.
Markets cheered the optimistic tone surrounding an economic recovery, with safe-haven assets feeling the pinch. Price touched gloves with May’s opening level at 1689.0 on the H4 timeframe yesterday and, as you can see, mildly pared losses into the close. South of here, Quasimodo support rests at 1670.5 as well as support drawn from 1667.7, while extending recovery gains could lead to trend line support-turned resistance, taken from the low 1640.1, being brought into the fight.
Areas of consideration:
Aside from the current trend facing north, buyers are not really positioned in a healthy light right now. Weekly price from Quasimodo resistance at 1739.6 could continue to weigh on movement, consequently tripping protective stops under the daily bullish pennant pattern’s structure. This could lead to sellers attempting to short the H4 trend line support-turned resistance, taken from the low 1640.1, today. A H4 close back above the said trend line, though, could have buyers take a stab at higher prices.
The accuracy, completeness and timeliness of the information contained on this site cannot be guaranteed. IC Markets does not warranty, guarantee or make any representations, or assume any liability regarding financial results based on the use of the information in the site.
News, views, opinions, recommendations and other information obtained from sources outside of www.icmarkets.com.au, used in this site are believed to be reliable, but we cannot guarantee their accuracy or completeness. All such information is subject to change at any time without notice. IC Markets assumes no responsibility for the content of any linked site.
The fact that such links may exist does not indicate approval or endorsement of any material contained on any linked site. IC Markets is not liable for any harm caused by the transmission, through accessing the services or information on this site, of a computer virus, or other computer code or programming device that might be used to access, delete, damage, disable, disrupt or otherwise impede in any manner, the operation of the site or of any user’s software, hardware, data or property.


