EUR/USD:
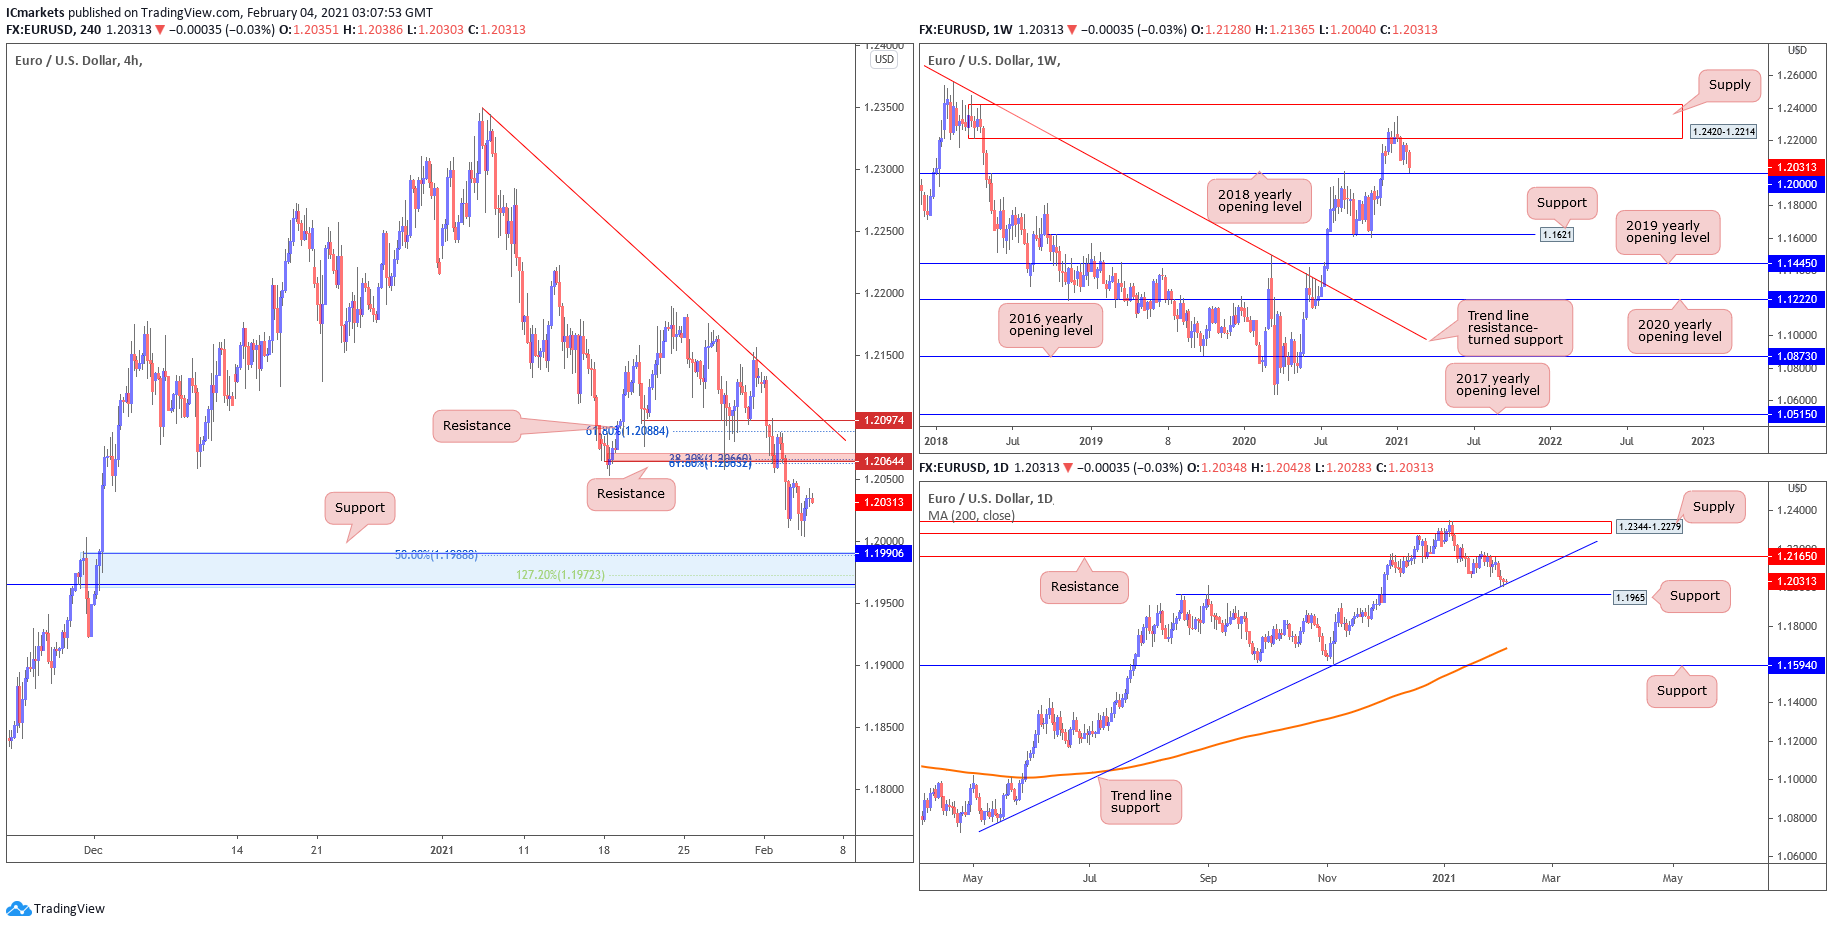
Looking at the weekly chart, we can see that prices are still in an uptrend as it trades between our weekly supply area at 1.2420 – 1.2214 and weekly support at 1.20000. The weekly support level also coincides with the 2018 yearly opening level. On the daily time frame, prices are approaching the support area at 1.1965 – 1.20040 which coincides with our daily ascending trend line and our weekly support area.
On the H4 timeframe, prices are facing bearish pressure from our short term resistance area at 1.20644 which coincides with our 61.8% fibonacci extension and 38.2% fibonacci retracement as well as the graphical resistance area. This would be an interesting level for sellers and recent price action around that area suggests it is a strong area of supply flowing in where we could see a reversal here. Similarly, prices on the weekly and daily time frames indicate that a bigger pullback could happen before prices reach the daily key support level.
Areas of consideration:
- 20644 resistance area found on H4 time frame
- 19906 support area found on H4 and daily time frame
GBP/USD:
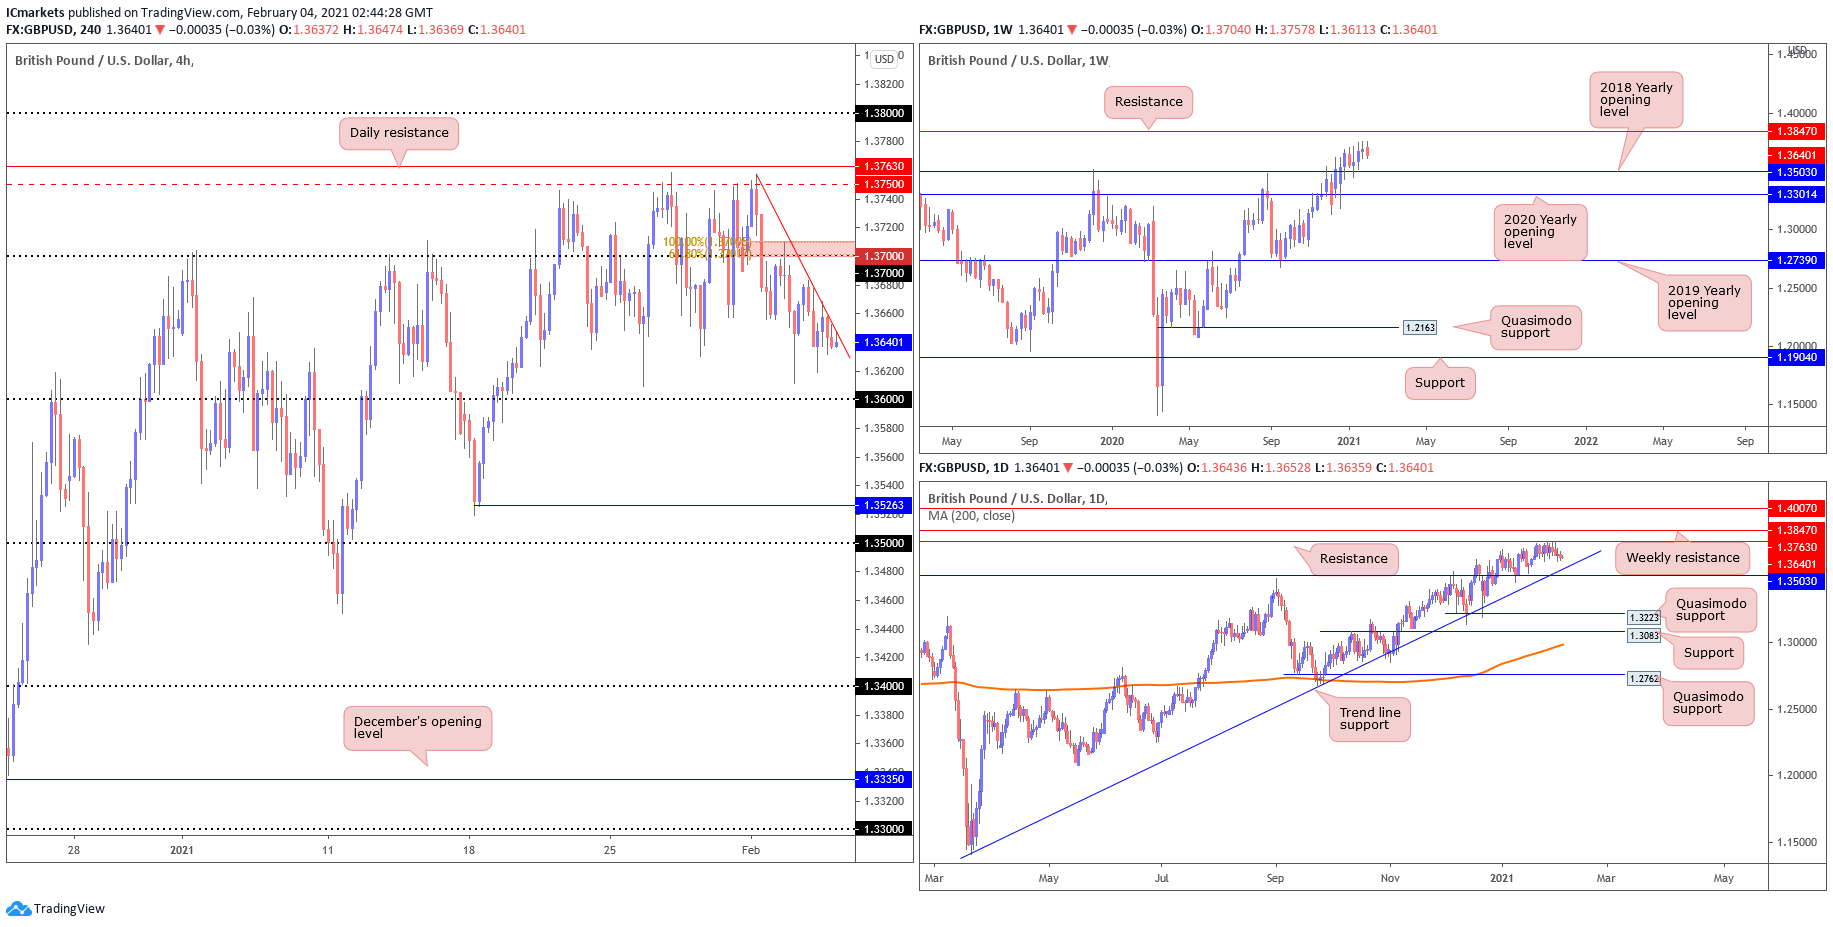
Looking at the weekly chart, we can see that prices are still in an uptrend as it trades between our weekly support at 1.35030 and weekly resistance at 1.38470. The weekly support level also coincides with the 2018 yearly opening level. On the daily time frame, there was a reversal below the daily resistance at 1.37630 and we are seeing limited downside before prices reach our weekly and daily support at 1.35030.
On the H4 timeframe, short term resistance at the 1.3700 resistance area, coincides with the 61.8% Fibonacci Retracement and 100% Fibonacci Extension. This would be an interesting level for sellers and recent price action around that area suggests it is a strong area of supply flowing in where prices could be faced with bearish pressure below this level. Prices are facing bearish pressure from our descending trend line as well where we could see a further downside to our next short term support level at 1.35263, keeping in mind the view on the larger time frame .
Areas of consideration:
- 3700 resistance area found on both Daily and H4 timeframe
- 35263 support level on H4 timeframe
AUD/USD:
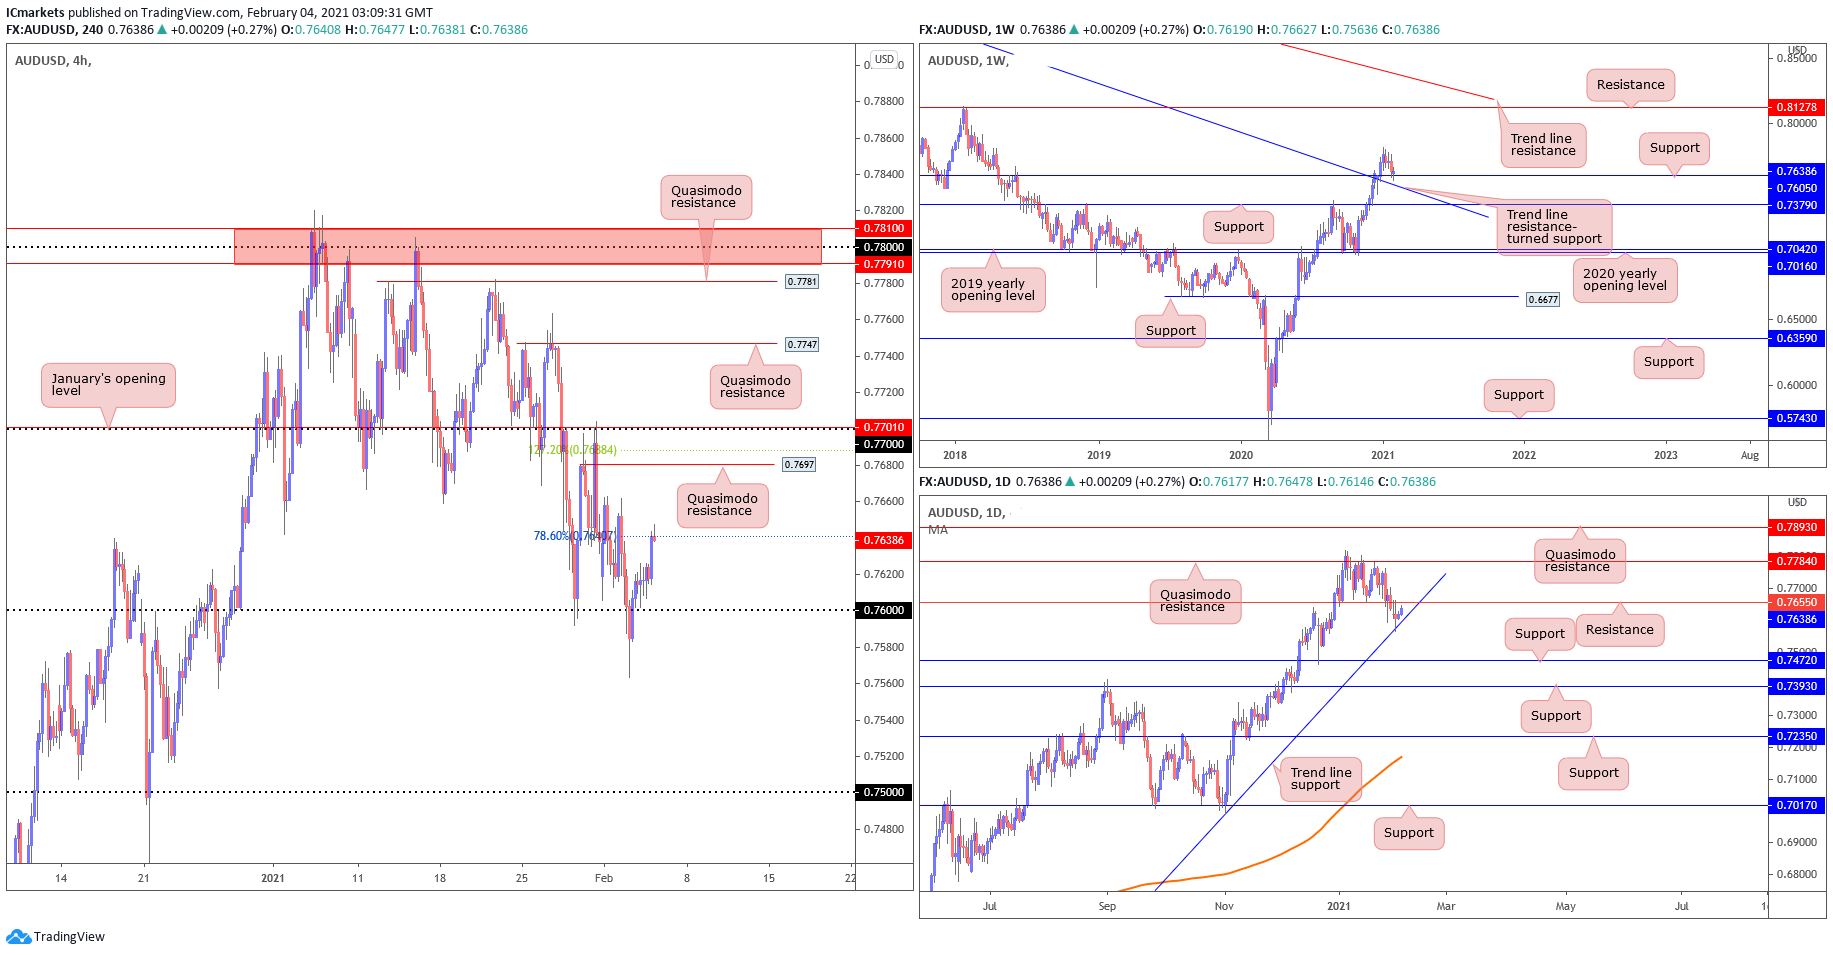
From the weekly timeframe, we can see a bounce on support level at 0.7605, a previous Quasimodo resistance, looking on the Daily we can also see a inverted head and shoulder candlestick pattern which reversed from the ascending trendline. H4 also shows price currently retracing back to 78.6% fibonacci level and failure to hold under the major figure of 0.76. Continuation of the bullish move may pull price towards the 0.7697 figure where previous Quasimodo resistance as well as near the zone of 127% retracement level. However, a retest of the major figure 0.76 may push prices further South when level is broken.
Areas of consideration:
- Breaking of 78.6% may pull prices up North to Quasimodo Resistance at 0.7697
- Daily trendline support has been respected
- Weekly show bullish reversal from Trendline resistance turn support.
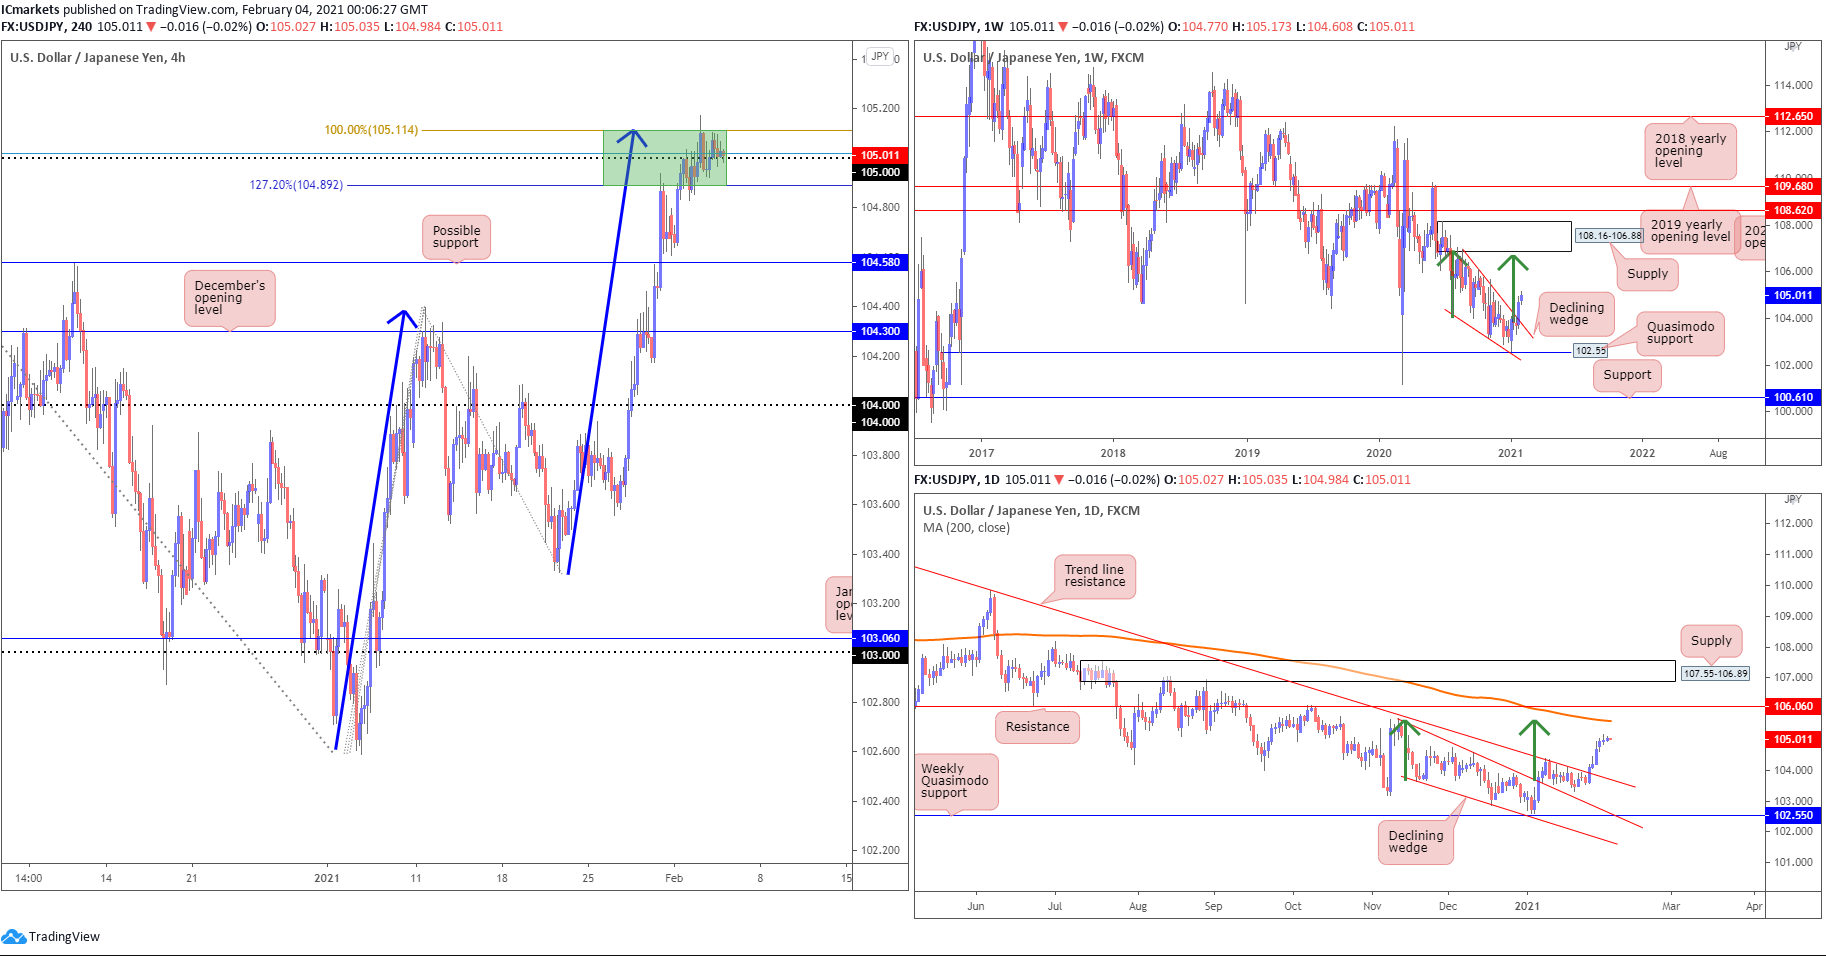
USD/JPY
The US dollar continued to clock fresh monthly highs against the Japanese yen, with H4 breaking above 127% Fibonacci retracement at 104.97. It reversed slightly from alternate AB=CD (blue arrows) target at 105.114. Since then, we have seen buyers step aside, kicking the 104.892 figure back into the light as a possible support level.
Against the backdrop of the H4 timeframe, Monday’s advance added upside impetus to the recent breakout above the weekly declining wedge (106.94/104.18). On the daily chart, price broke above the declining wedge and bounced further towards the weekly resistance level at 106.06, in line with the MA200 resistance. The daily timeframes displaying room to reach 106.06 underpins the possibility of further buying materialising north of 104.914(H4). However, before that on the H4 chart, we couldn’t ignore the resistance at 105.114 where the 100% fib extension is. If price is able to break above this 105 to 105.114 resistance zone, then we could expect the price to go north of 106.06 (weekly and daily).
Areas of consideration:
- 06 resistance on the Daily timeframe
- 11 resistance on H4 timeframe, in line with 100% Fibonacci extension in AB=CD pattern
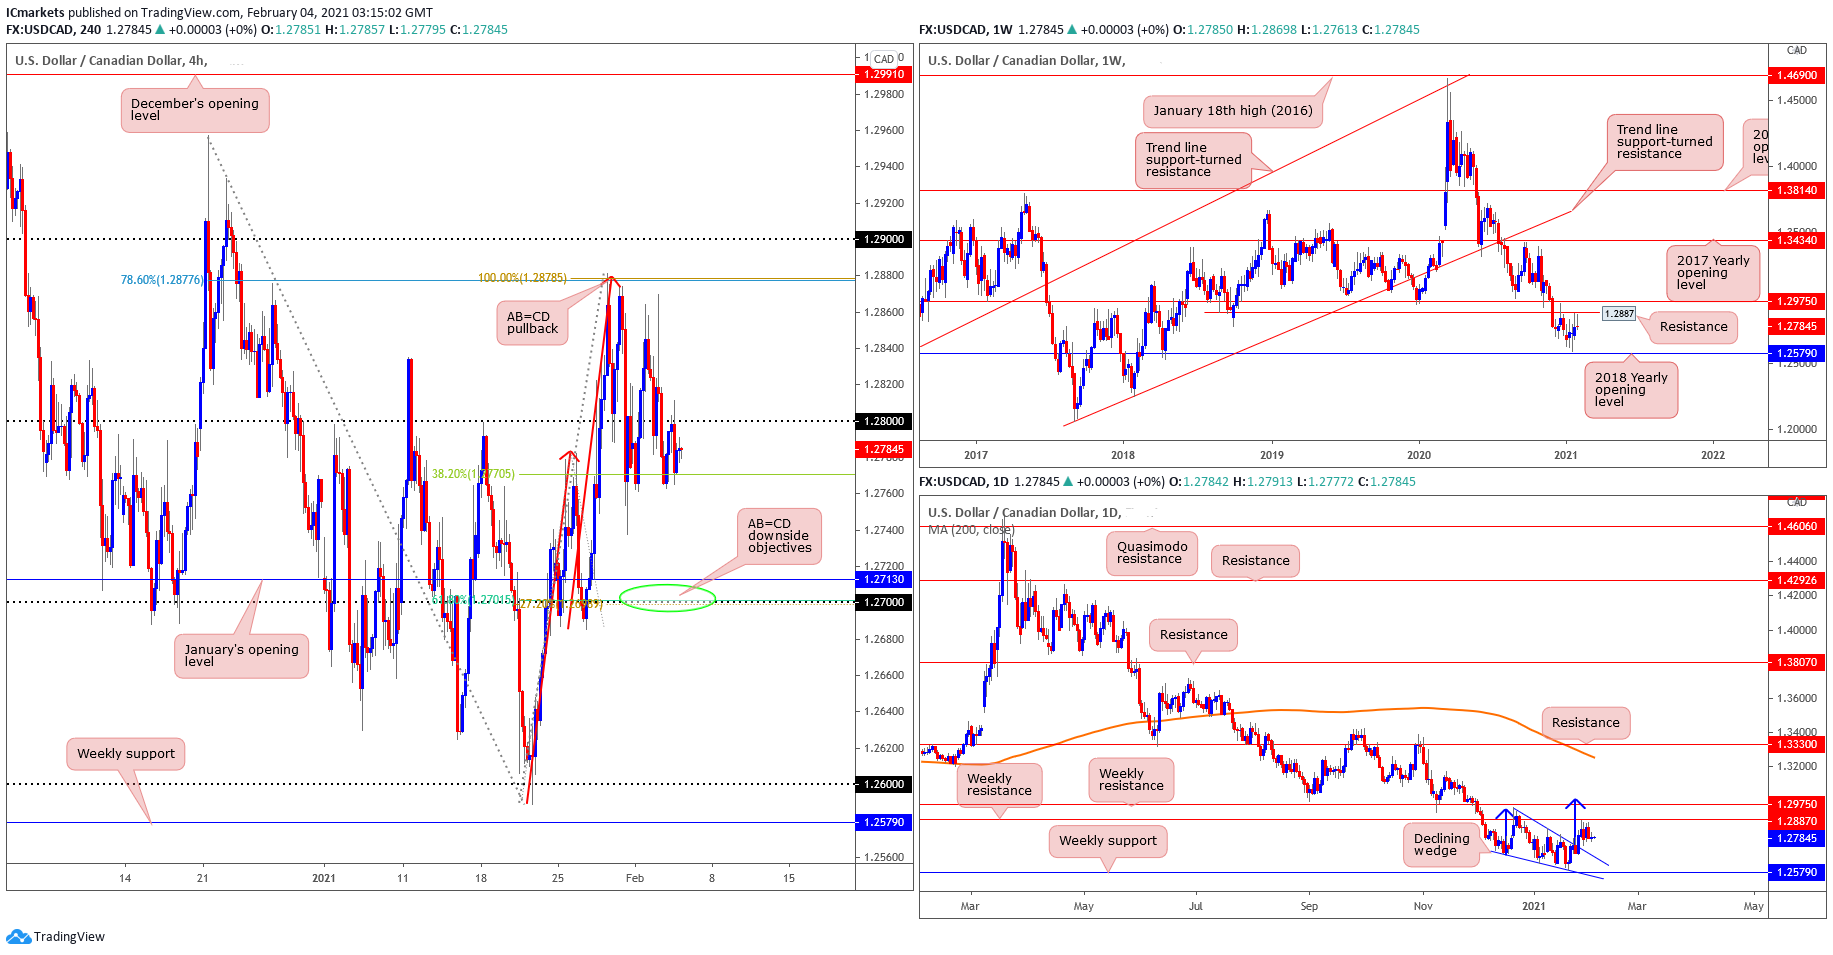
USD/CAD:
Looking at the weekly chart, prices may approach our weekly supply area at 1.2887 – 1.29750, which coincides with our 2020 yearly opening level for a retest before continuing the long-term bearish move which has been dipping since March (2020). On the daily time frame, the resistance target obtained using a 100% projection starting from the breakout of the declining wedge lines up with the weekly resistance area we have identified and was a key graphical resistance area, price have reversed in a strong 100-pip move since.
H4 has bounced from the 38.2% Fibonacci retracement ratio, first objective of AB=CD, continuation of bearish may achieve the second objective of 1.2701 at 61.8% fibonacci retracement ratio within touching range with the major figure of 1.27 and -27.0% Fibonacci retracement. This would be an interesting level for buyers and recent price action around that area suggests it’s a strong area of demand flowing. That said, we do caution the limited upside, keeping in mind the support level that prices are approaching at 1.2713, the opening of January, which may turn into resistance. As 1.28870 is a daily resistance level, H4 gaining much beyond the resistance area is unlikely.
Areas of consideration:
- Price trending between 1.28 major figure and 38.2% retracement
- Further bearish side to AB=CD second objective requires a break on 1.277.
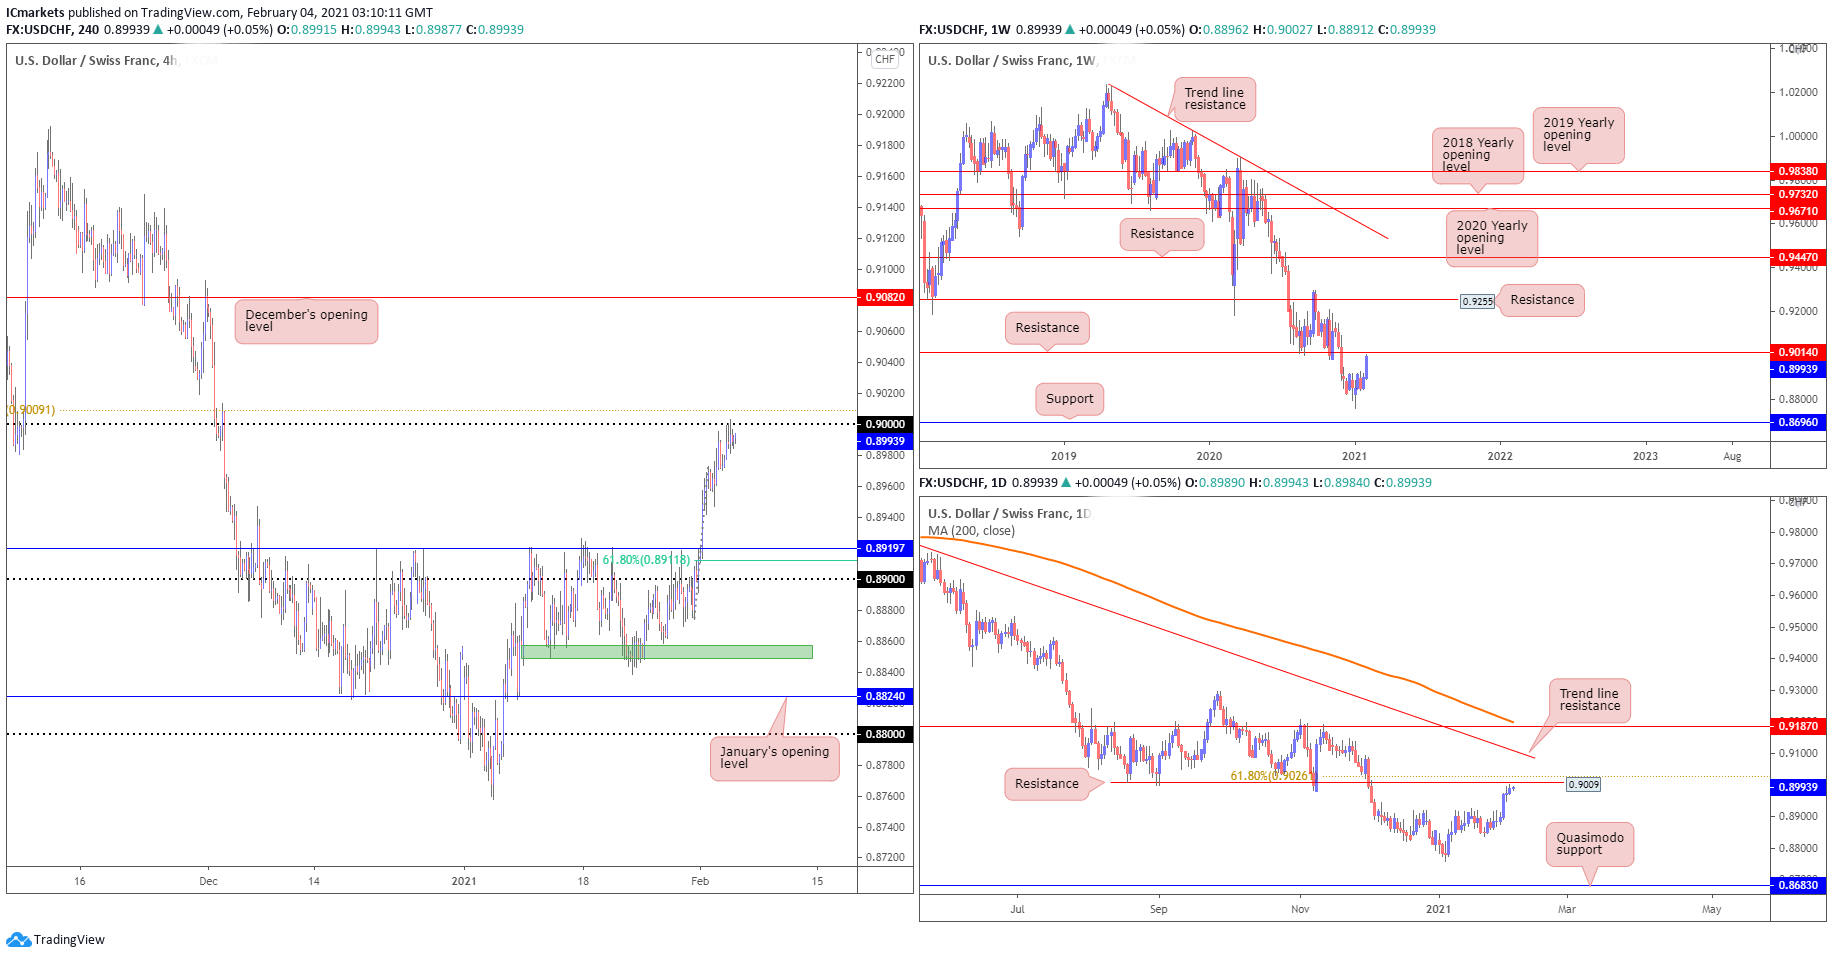
USD/CHF:
On the weekly timeframe, USD/CHF continues to be on a steady downtrend as it holds below the descending trend line resistance on Thursday. Price is now testing the horizontal pullback resistance level at 0.90140 which had held as a support level before price broke through in December 2020.
On the daily timeframe, price continues to push higher and is now testing the resistance level at 0.9009, There is potential for buyers to make a showing and for price to continue with further upside if it breaks above the horizontal pullback resistance level at 0.9009 and descending trendline resistance. Otherwise, should price fail to break this resistance level, there is potential for a bearish scenario where price drops to the 0.86830 which is our Quasimodo support level.
Looking at the H4 timeframe, we see the same picture where price is now testing the 0.900 resistance level, which is also in line with our 61.8% Fibonacci retracement. A break above this 0.900 level may provide the momentum for a bullish move towards the next resistance level at 0.9009 as seen on the daily timeframe. In this bullish scenario, we expect price to go north of 0.90820, which was the opening level of December 2020. Otherwise, it is possible for price to swing the other way towards the 0.8923-0.89 region, which is also in line with 61.8% Fibonacci retracement, providing strong support.
Areas of consideration:
- USD/CHF shows potential for limited upside in the short term.
- 8923-0.89 region is a strong support level that can be found on both the daily and H4 timeframes.
- 9009 resistance level is a strong resistance level to watch that can also be found on the daily timeframe.
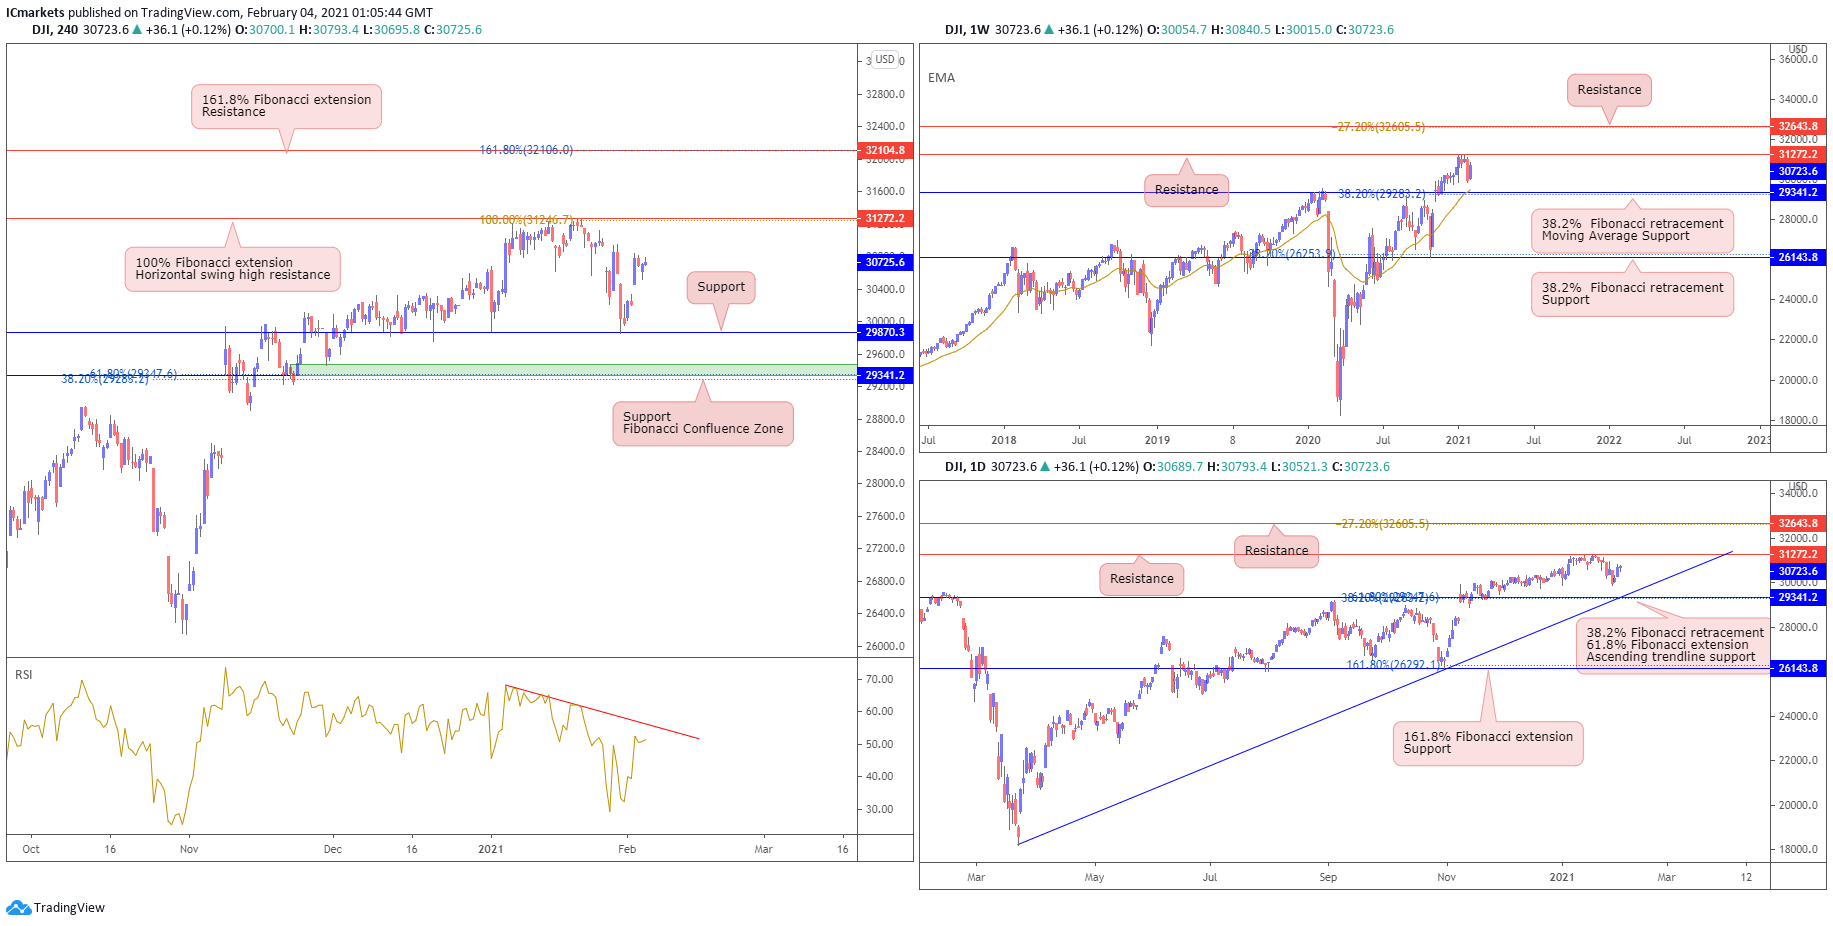
Dow Jones Industrial Average:
While the markets made a pullback from the weekly highs, we note that price still continues to hold above key graphical overlap support and moving average at around the 29340 level. Strategically speaking, there is a possibility that investors could still see price ranging sideways between 29340 support and 31272 resistance. The daily picture remains unchanged and still keeps its bullish structure with price holding above the daily ascending trendline support at 29340. Price closed higher overnight and is now coming close to 2021 year high at 31272.
On the H4, we see price drifting higher, edging closer towards 31272 resistance. 31272 price level is also 2021 year high which also finds confluence with key 100% Fibonacci extension level. It is possible to see sellers enter the market looking for a strong bearish reaction at this price level to push price lower. Otherwise, a break above 31272 will see new all time highs being formed and a possibility of price pushing to the next resistance at 32104.
Areas of consideration:
- RSI holding below descending trendline resistance where price reacted in the past
- 31272 resistance as the all time high and also currently 2021 yearly high
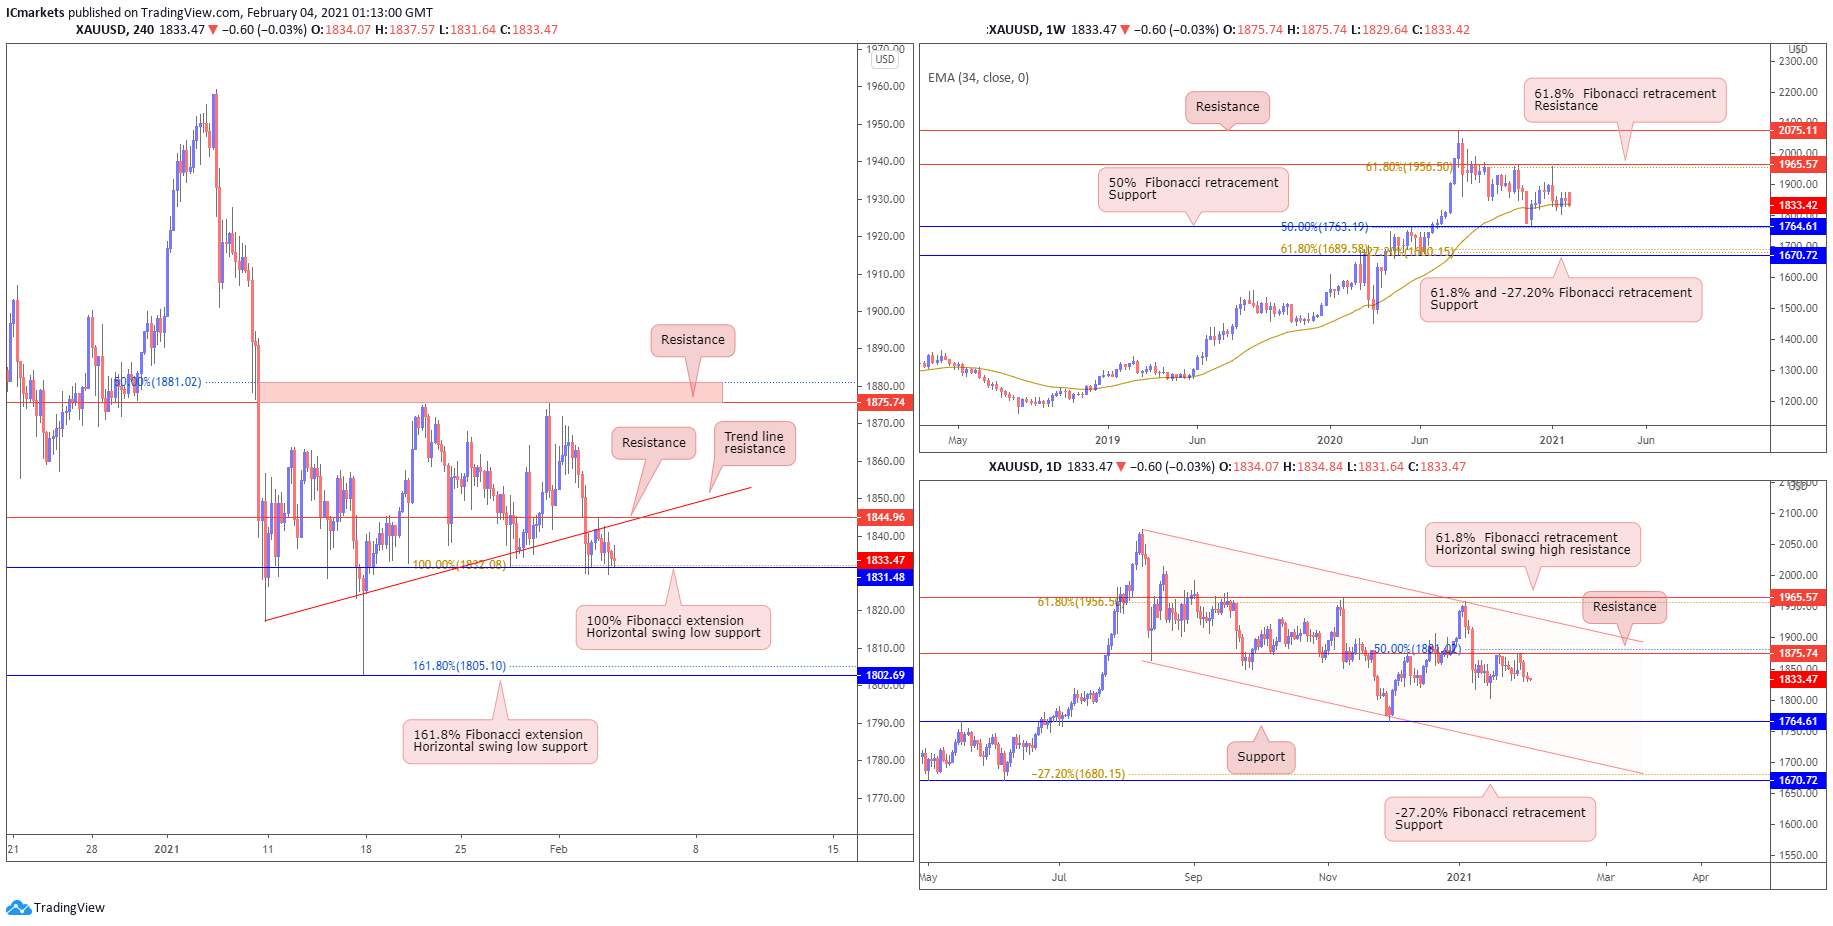
XAU/USD (GOLD):
On the weekly timeframe, we have the gold price drifting lower but still holding above long term moving average support. With price holding between support at 1764 and resistance at 1965, traders can expect price to show more range bound price action over the next few weeks. On the daily chart however, we see price forming a descending channel with price holding below the immediate 50% Fibonacci retracement level and resistance at 1875. As long as price continues to hold below this level, we could see a build up of selling pressure towards recent swing low and support at 1764. Upside potential is limited due to descending channel resistance as well.
On the 4H timeframe, price drifted lower and is currently testing 100% Fibonacci extension and graphical swing low support at 1831. Price has also broken below ascending trendline support (now resistance) at 1845. A strong break and candle close below our support at 1831 could see price fall deeper towards next support at 1802. Otherwise, surpassing 1845 resistance, we will see price re-integrating back into the H4 range and possibly drift higher towards 1875 resistance.
Areas of consideration:
- 1845 resistance level to surpass if price is to re-integrate H4 range
- 1831 is a strong intraday support level to watch. A break and a close below will see a deeper drop
The accuracy, completeness and timeliness of the information contained on this site cannot be guaranteed. IC Markets does not warranty, guarantee or make any representations, or assume any liability regarding financial results based on the use of the information in the site.
News, views, opinions, recommendations and other information obtained from sources outside of www.icmarkets.com.au, used in this site are believed to be reliable, but we cannot guarantee their accuracy or completeness. All such information is subject to change at any time without notice. IC Markets assumes no responsibility for the content of any linked site.
The fact that such links may exist does not indicate approval or endorsement of any material contained on any linked site. IC Markets is not liable for any harm caused by the transmission, through accessing the services or information on this site, of a computer virus, or other computer code or programming device that might be used to access, delete, damage, disable, disrupt or otherwise impede in any manner, the operation of the site or of any user’s software, hardware, data or property.


