
A note on lower timeframe confirming price action…
Waiting for lower timeframe confirmation is our main tool to confirm strength within higher timeframe zones, and has really been the key to our trading success. It takes a little time to understand the subtle nuances, however, as each trade is never the same, but once you master the rhythm so to speak, you will be saved from countless unnecessary losing trades. The following is a list of what we look for:
- A break/retest of supply or demand dependent on which way you’re trading.
- A trendline break/retest.
- Buying/selling tails – essentially we look for a cluster of very obvious spikes off of lower timeframe support and resistance levels within the higher timeframe zone.
- Candlestick patterns. We tend to only stick with pin bars and engulfing bars as these have proven to be the most effective.
For us, lower timeframe confirmation starts on the M15 and finishes up on the H1, since most of our higher timeframe areas begin with the H4. Stops usually placed 5-10 pips beyond your confirming structures.
EUR/USD:
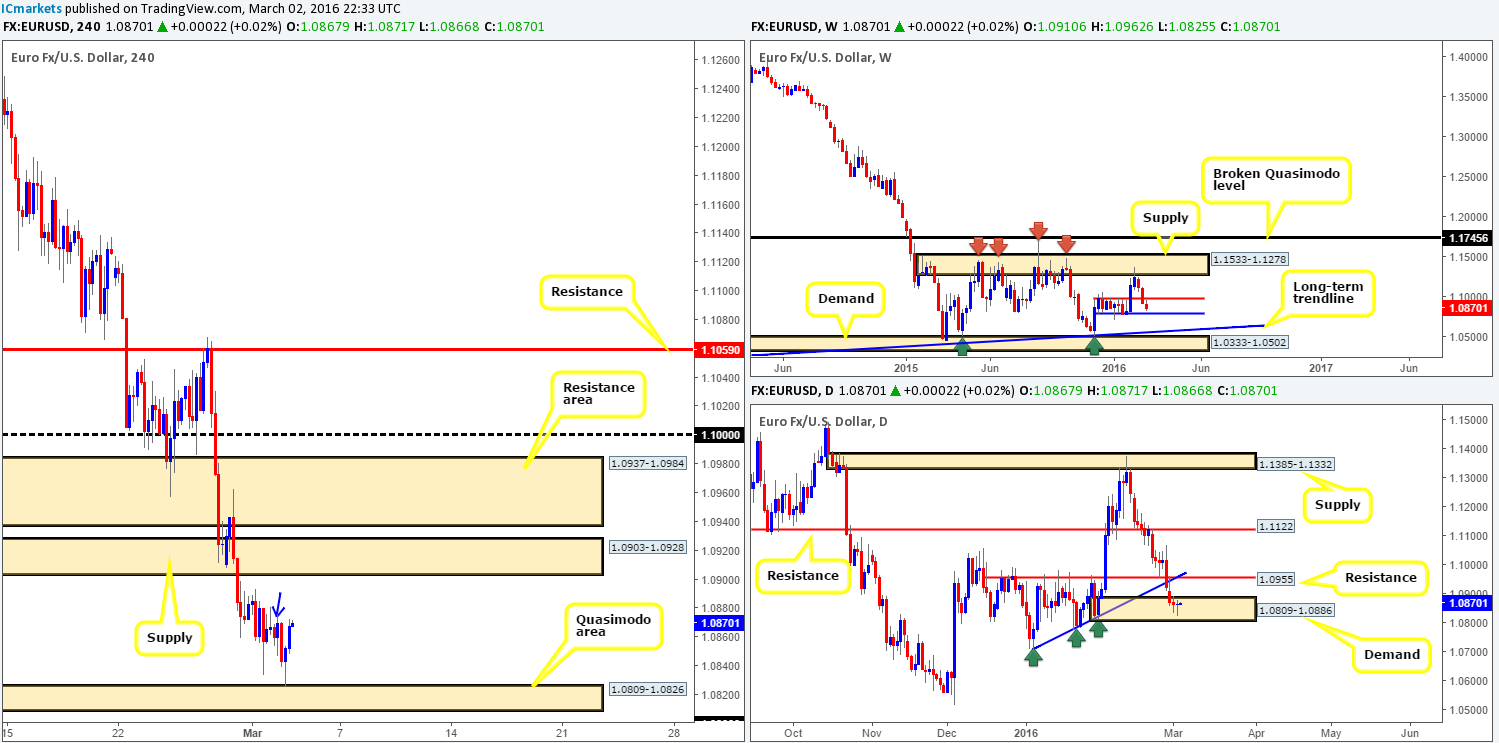
As was anticipated (http://www.icmarkets.com/blog/wednesday-2nd-march-daily-technical-outlook-and-review/), the single currency appears to have found a strong foothold off the top-side of a H4 Quasimodo support area seen at 1.0809-1.0826. We missed this move altogether as price hastily rotated from this zone – well done to any of our readers who managed to jump in on this one!
Evident from the H4 chart we can see that price closed the day out at 1.0867, just ahead of the high 1.0876 (blue arrow) which is rather significant, since this is the only remaining supply seen before the 1.0903-1.0928 area. Supporting a push higher today can be seen on the daily chart – a second consecutive bullish tail printed within the confines of demand at 1.0809-1.0886. Nevertheless, in the event that the bears make an appearance around the 1.0876 region today, longs could be in a little trouble as weekly bears have yet to connect with support at 1.0796, which sits BELOW the H4 buy zone, and around where your stop is likely placed! Therefore, the 1.0876 number is KEY for trade management today!
With regards to new trading boundaries, we have our eye on the H4 resistance area above at 1.0937-1.0984, due to it surrounding both weekly resistance 1.0983 and daily resistance at 1.0955. Buying this market on the other hand, will be permitted once/if price collides with the weekly support mentioned above at 1.0796 – in effect a fakeout below the current H4 Quasimodo barrier!
Levels to watch/live orders:
- Buys: 1.0796 region [Tentative – confirmation required] (Stop loss: dependent on where one confirms this area).
- Sells: 1.0937-1.0984 [Tentative – confirmation required] (Stop loss: dependent on where one confirms this area).
GBP/USD:
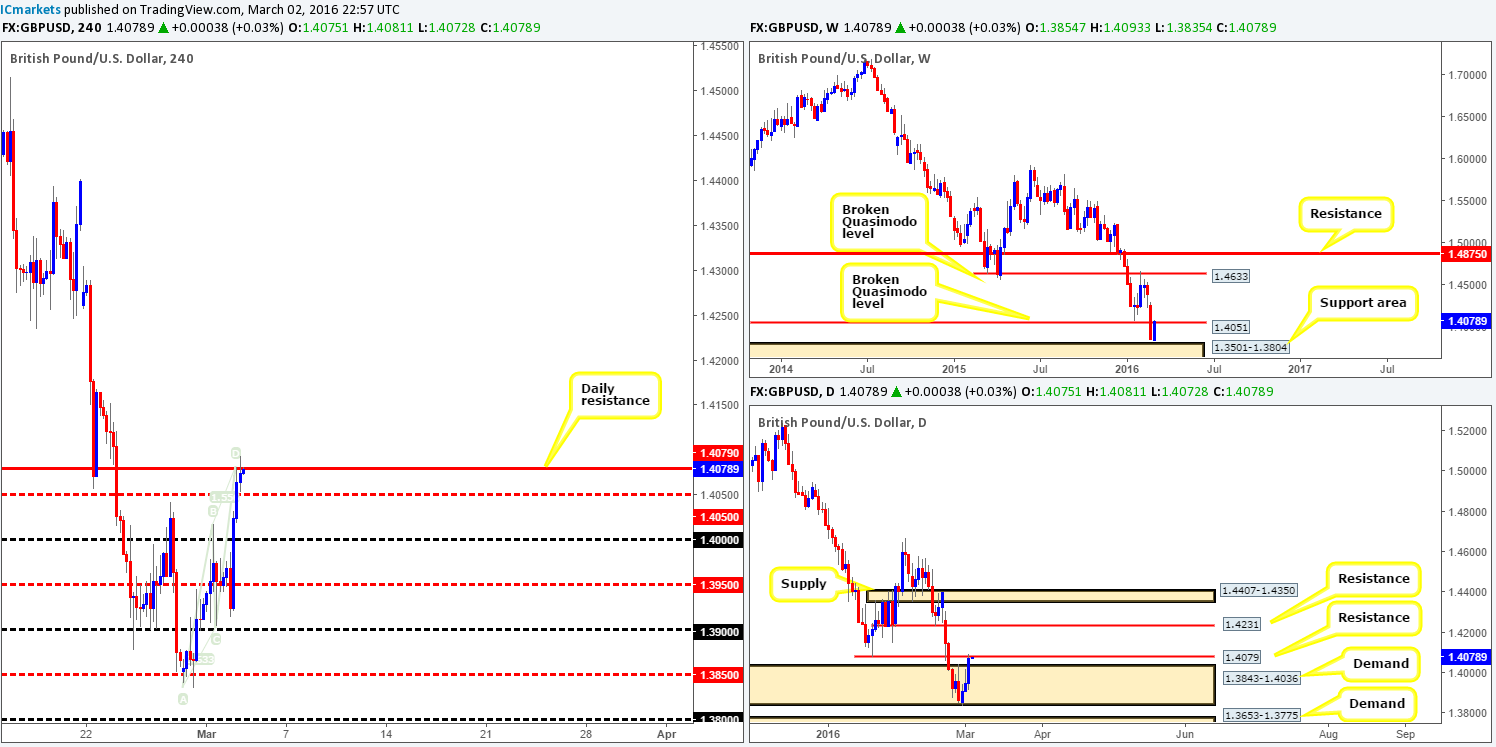
Starting from the top this morning, the broken weekly Quasimodo level at 1.4501 has now officially come into view. Whether this long-term structure holds firm or not can only really be determined by the weekly close in our opinion. Climbing down into the daily chart, nonetheless, Cable extended its recovery from daily demand at 1.3843-1.4036 for the third consecutive day yesterday, printing a near-perfect full-bodied bullish candle. Despite this, there could be trouble on the horizon as price connected with not only the weekly level just discussed above, but also a daily resistance drawn from 1.4079.
Stepping across to the H4 chart, the recent buying has completed what looks to be a Harmonic AB=CD bearish pattern, that fuses just beautifully with the aforementioned daily resistance level and trades in-line with the predominant trend. Therefore, we have taken a short entry at 1.40780 and placed our stop around the 1.4170 mark. Granted, this a large stop, but considering the higher-timeframe levels involved (see above), we’re also expecting a large decline. Ultimately, we’ll be looking to take partial profits around the 1.3950 region due to the H4 demand surrounding this level to the left at 1.3914-1.3969.
Levels to watch/live orders:
- Buys: Flat (Stop loss: N/A).
- Sells: 1.40780 [LIVE] (Stop loss: 1.41700).
AUD/USD:
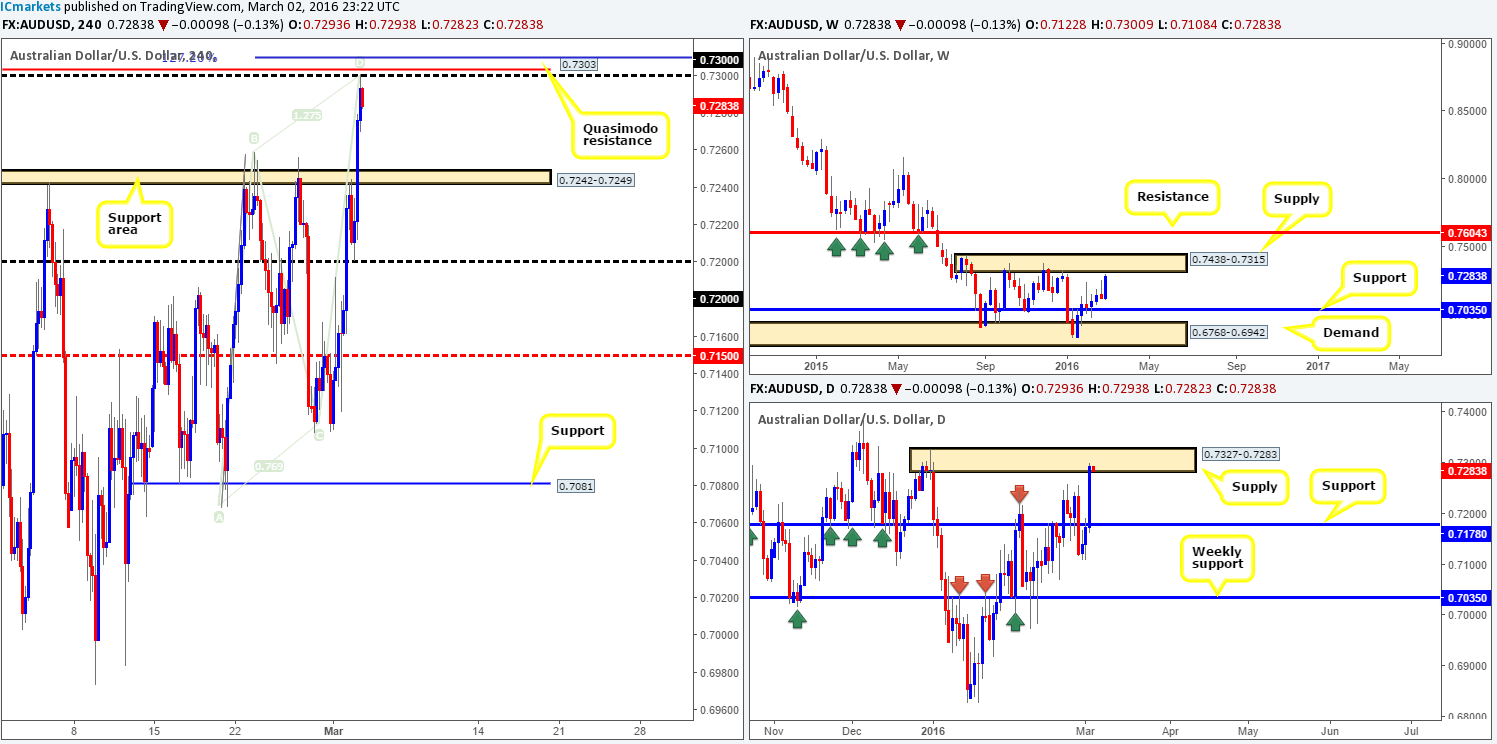
Mid-way through yesterday’s London session, the commodity currency retested the 0.7200 figure as support and launched itself around 100 pips north. By the close, price had demolished the H4 resistance (now support) area at 0.7242-0.7249, and connected beautifully with the 0.7300 handle. Alongside this number, we can also see that there’s a H4 Harmonic AB=CD bear pattern completion which shows the 127.2 EXT (blue line) looming just above at 0.7310, and a H4 Quasimodo resistance level at 0.7303. In addition to this confluence, daily action is currently housed within supply coming in at 0.7327-0.7283, and the weekly chart shows price trading within shouting distance of supply penciled in at 0.7438-0.7315 (capped upside since Aug 2015).
Therefore, we’re pretty confident this pair is heading south to at least the H4 support zone 0.7242-0.7249 today. The boat has clearly left for a market entry unfortunately, but one could look to try and board later alongside a lower timeframe sell signal.
Levels to watch/live orders:
- Buys: Flat (Stop loss: N/A).
- Sells: 0.7300 region [Tentative – confirmation required] (Stop loss: dependent on where one confirms this area).
USD/JPY:
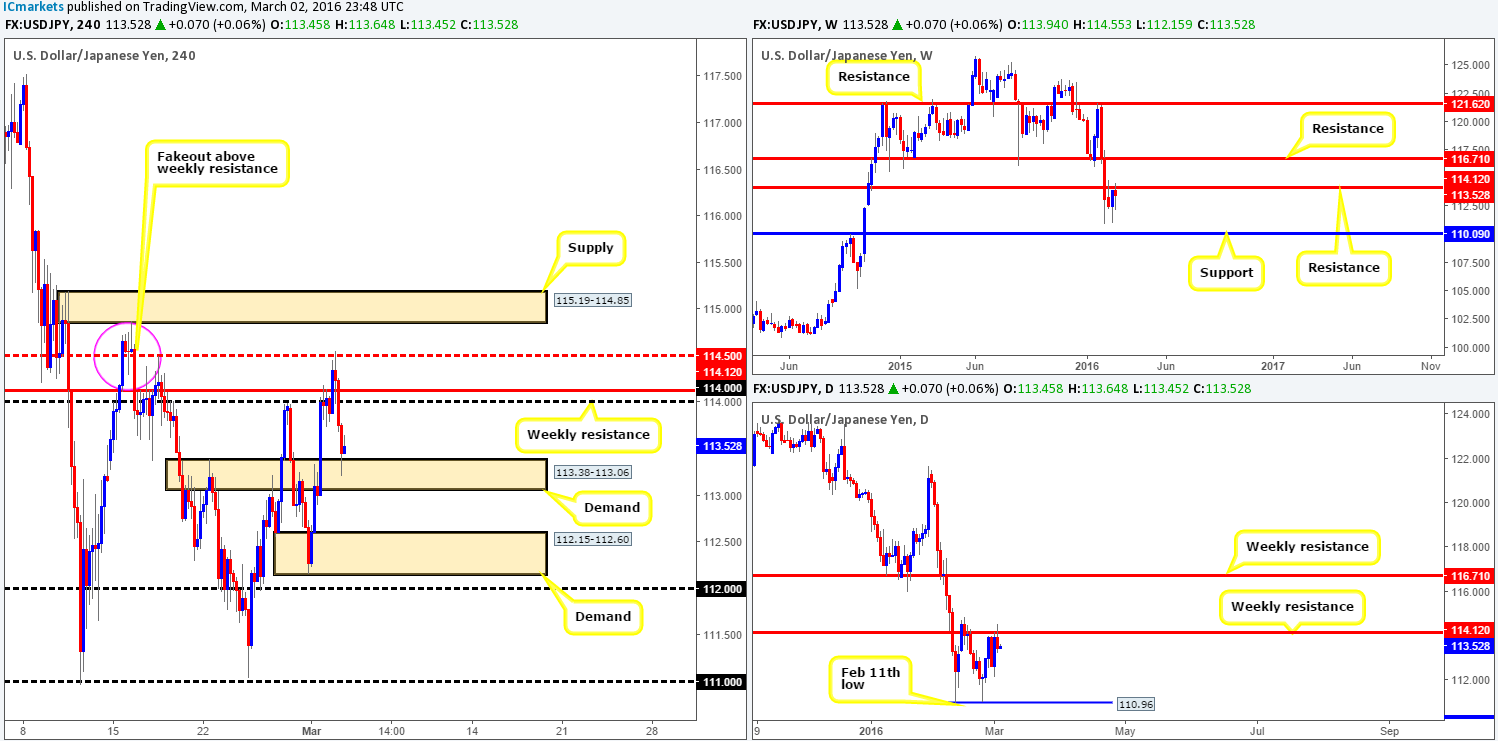
The USD/JPY came alive going into yesterday’s European open, breaking above both the 114.00 figure and the weekly resistance level at 114.12. This momentum, as you can see, was short-lived as strong offers defended the mid-level number 114.50, forcing price to touch gloves with H4 demand at 113.38-113.06.
In light of the above, is yesterday’s down move simply a retracement looking to break to new highs today, or is this the start of something more serious? The reason we say this is simply because if one looks to the weekly chart, the aforementioned resistance is being retested for a second time and looks to be holding firm at the moment.
Given the higher-timeframe picture (see above), we are going to pass on buying from the current H4 demand. If price should close below here, however, there may be a shorting opportunity on any retest seen thereafter, targeting H4 demand at 112.15-112.60 as your first take-profit target. Other than this, there’s really very little else being offered at this time.
Levels to watch/live orders:
- Buys: Flat (Stop loss: N/A).
- Sells: Watch for bids to be consumed around 113.38-113.06 and look to trade any retest seen thereafter (lower timeframe confirmation required).
USD/CAD:
In our previous report (http://www.icmarkets.com/blog/wednesday-2nd-march-daily-technical-outlook-and-review/) we mentioned to keep an eye on the lower timeframe action around H4 demand at 1.3358-1.3396 for confirmed longs. As is shown on the chart, price rallied beautifully from here, tagging the first take-profit level 1.3500 with relative ease, before aggressively collapsing to lows of 1.3414 by the day’s end.
There is no denying that the rotation seen from 1.3500 would be a little concerning for anyone currently long this market. However, let’s not lose sight of the bigger picture here traders. Weekly support at 1.3381 is still very much intact, along with the daily demand that surrounds this level at 1.3293-1.3396. Speaking of the daily chart, traders may also want to take note of the inverted pin-bar that formed as a result of yesterday’s trading – this is, in itself, considered a bullish signal.
Whilst there is a strong possibility that price may fake below the current H4 demand today, thus pushing price deeper into the above said daily demand, our bias still remains to the upside. As such, keep a close eye out for a second retest of the H4 demand zone for another chance to get in this market, or if price fails and breaks below look to buy on the fakeout lower (lower timeframe confirmation is recommended in both circumstances).

Levels to watch/live orders:
- Buys: 1.3358-1.3396 [Tentative – confirmation required] (Stop loss: dependent on where one confirms this area). Also, keep an eye out for a possible whipsaw below this area as there could be a buying opportunity here (see above text for details).
- Sells: Flat (Stop loss: N/A).
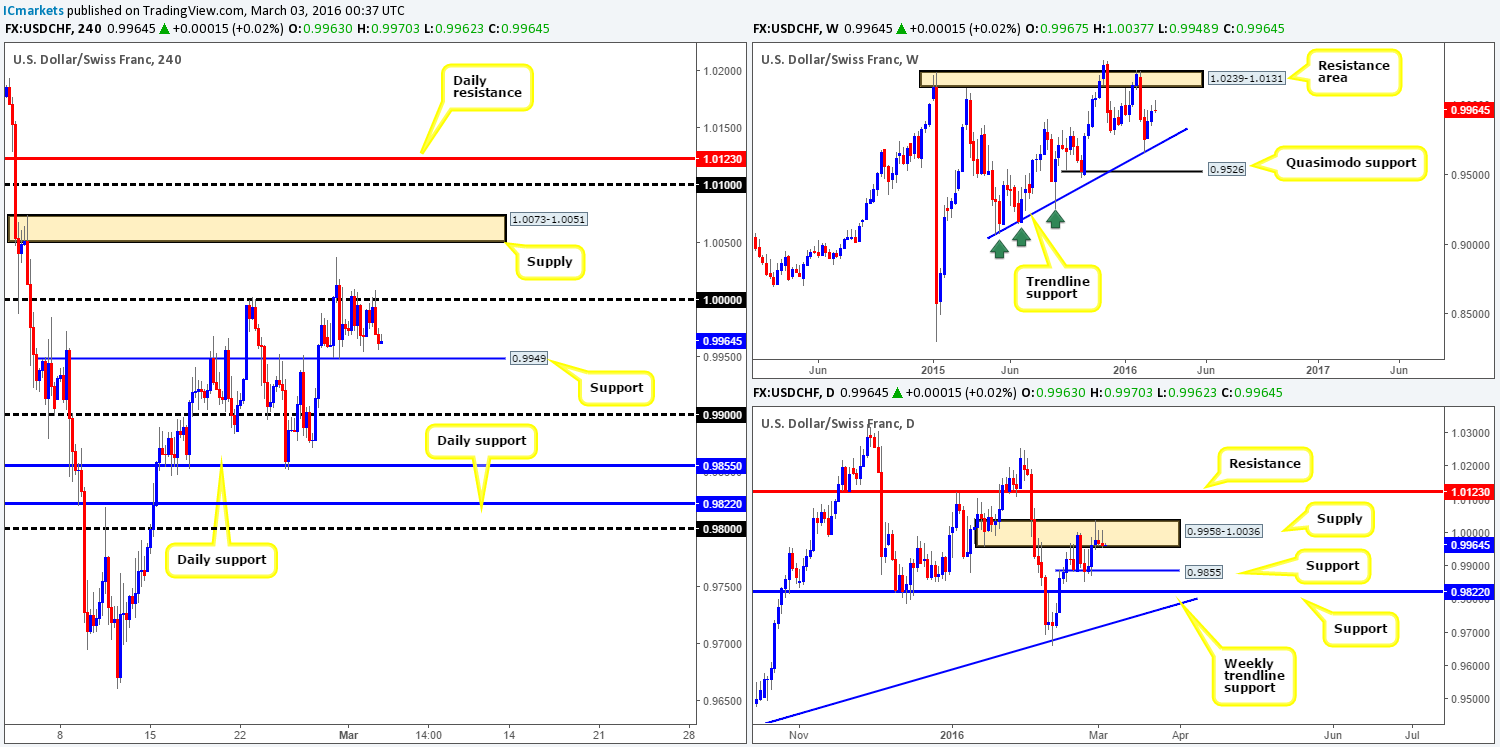
USD/CHF:
The following report is much the same as the previous due to a lackluster session yesterday.
The USD/CHF once again saw very little action yesterday as price continued clinging to the underside of parity before selling-off going into the American session. Despite this, daily action did in fact print a third consecutive selling wick within supply at 0.9958-1.0036.
As is evident from the H4 chart, price is presently capped between parity and a H4 support level drawn from 0.9949. Now, trading within this zone is a possibility today but not something that really interests us. What we are interested in, however, is the areas beyond this fifty-pip zone. A violation of 0.9949 could lead to a drop towards the 0.9900 figure, followed closely by daily support at 0.9855. This move, as we’re sure you can probably see, would be supported by the above said daily supply zone. To trade here, we’d need to see 0.9949 retested as resistance together with a lower timeframe sell signal.
Conversely, if parity is taken out today, this would likely expose H4 supply at 1.0073-1.0051, followed by the 1.0100 figure and daily resistance at 1.0123. As such, a trade long may present itself today should price retest 1.0000 following a close higher along with a lower timeframe buy signal. By entering long here, you would effectively be buying into daily supply, but considering that there’s room to move higher on the weekly chart up to a resistance area painted at 1.0239-1.0131, we believe it’s a safe trade.
Levels to watch/live orders:
- Buys: Watch for offers to be consumed around 1.0000 and look to trade any retest seen thereafter (lower timeframe confirmation required).
- Sells: Watch for bids to be consumed around 0.9949 and look to trade any retest seen thereafter (lower timeframe confirmation required).
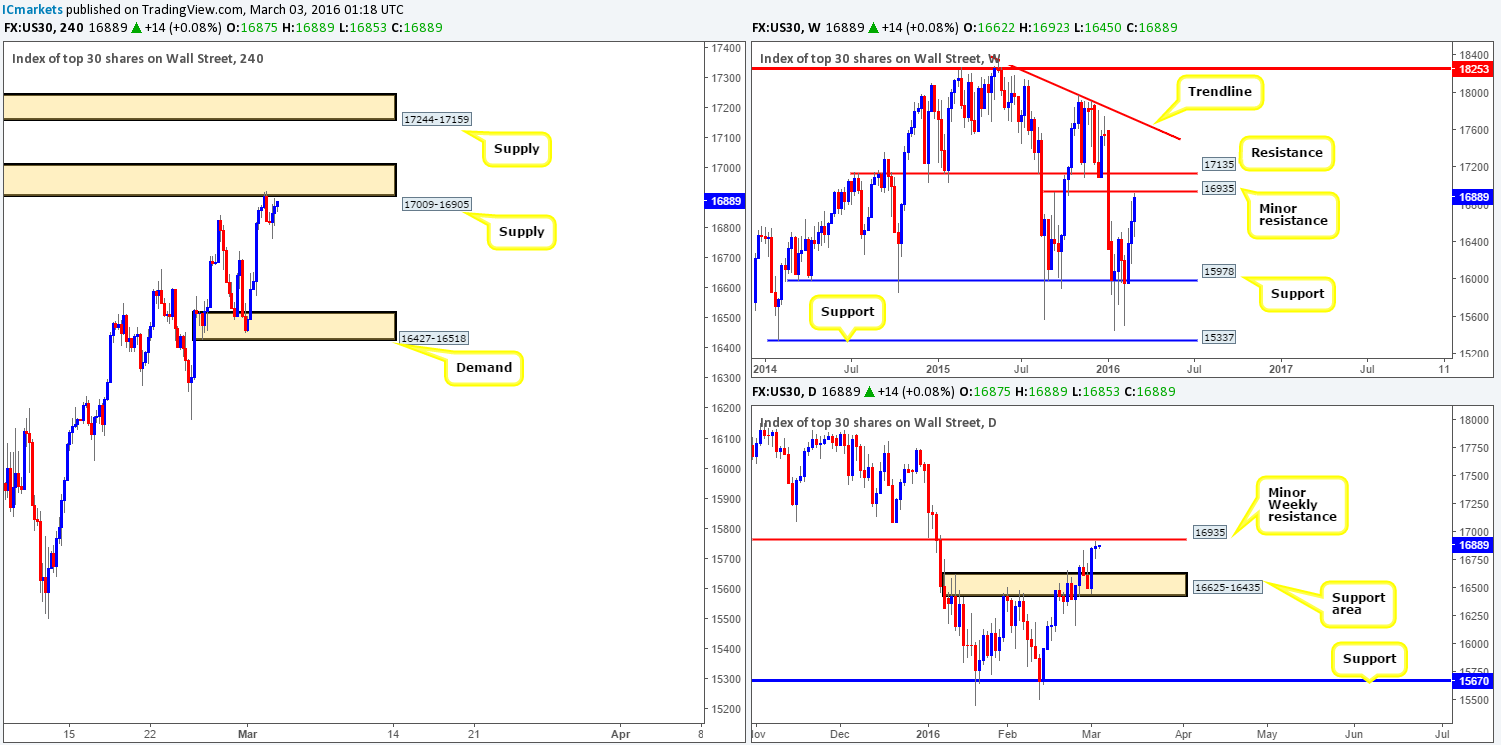
DOW 30:
Reporting from the weekly timeframe this morning, one can see that the DOW recently crossed paths with a minor resistance level coming in at 16935. In the event that this hurdle caves in, all eyes will be on the larger resistance above at 17135. Looking down to the daily chart, there is not much difference being seen other than the fact that a daily indecision candle printed upon reacting to the minor weekly level and the next downside target on this timeframe is demand at 16625-16435.
As can be seen from the H4 chart, supply at 17009-16905 (surrounds the current weekly minor resistance) was respected going into the European open yesterday, forcing price to lows of 16763 on the day. To our way of seeing things, one has two options here today/tomorrow. The first, continue watching the lower timeframe action unfold around the underside of the current supply, if an entry is seen, the first take-profit target comes in around demand at 16427-16518. Secondly, if the bears fail to muster enough strength to defend the above said zone, all eyes will then be on the supply just above at 17244-17159 (sits just above the weekly resistance hurdle 17135) for potential shorts.
Levels to watch/live orders:
- Buys: Flat (Stop loss: N/A).
- Sells: 17009-16905 [Tentative – confirmation required] (Stop loss: dependent on where one confirms this area). 17244-17159 [Tentative – confirmation required] (Stop loss: dependent on where one confirms this area).
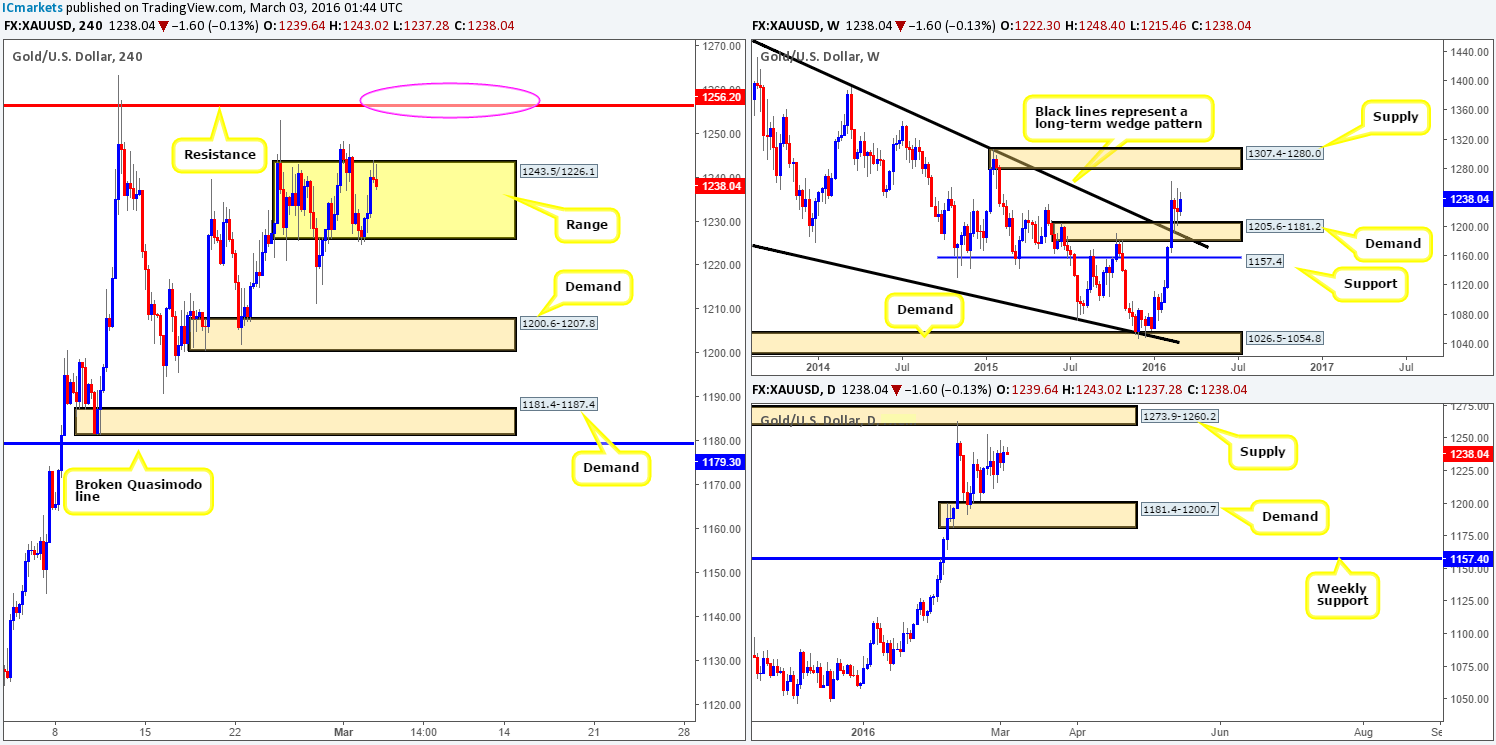
XAU/USD: (Gold)
From the H4 chart this morning, it appears that the yellow metal is beginning to chisel out a consolidation zone fixed between 1243.5/1226.1. Depending on how the markets react to the U.S data due to be released later on, we anticipate that Gold will remain within this range until the mighty NFP takes the stage tomorrow. As such, trades could be possible within the current range, but is not really something that sparks our interest.
The areas that are the more attractive, at least to us, are as follows (repeated from the previous report):
For buys:
- The demand at 1200.6-1207.8, which sits on top of the daily demand at 1181.4-1200.7 (which itself sits within weekly demand at 1205.6-1181.2).
- On the assumption that the above area caves in, however, the next buy zone can be seen at 1181.4-1187.4 – another demand which happens to be positioned within the extremes of the above said higher-timeframe areas.
For sells, we’re watching the H4 resistance at 1256.2 that lurks just below daily supply at 1273.9-1260.2. To enter short between these two barriers (pink circle), we would advise waiting for a lower timeframe sell signal to form prior to pulling the trigger. The reason being is simply because weekly action (as can be seen from the chart) shows room for the metal to continue rallying up to supply mentioned above at 1307.4-1280.0.
Levels to watch/live orders:
- Buys: 1200.6-1207.8 [Tentative – confirmation required] (Stop loss: dependent on where one confirms this area). 1181.4-1187.4 [Tentative – confirmation required] (Stop loss: dependent on where one confirms this area).
- Sells: 1260.2/1256.2 [Tentative – confirmation required] (Stop loss: dependent on where one confirms this area).


